
Abstract
Thermoplastic polyurethane (TPU) is one of the elastomeric polymers which has widespread applicability in various fields. Selective laser sintering (SLS) technology is gradually being used to manufacture actual end-use components and enables novel applications (footwear, healthcare mattresses, cable and wire) for TPU. This work aims to explore an optimum protocol (laser power, scanning speed and layer thickness) for SLS fabricated TPU components, and to evaluate the processability of TPU powder through systematically analyzing the morphological properties, structure, melting temperature, crystallization characteristics and tensile properties under different processing parameters. The optimum SLS processing parameters for TPU are laser speed of 3500 mm s−1, laser power of 25 W and layer thickness of 0.1 mm. The tensile strength and superlative toughness of SLS-fabricated TPU samples can reach up to 20.02 MPa and 26 631 J mm−3, respectively. The tensile strength of optimized SLS specimens (parameters: 20 W, 4500 mm s−1, 0.15 mm) has been increased by 87.1% compared to that of reference.
Export citation and abstract BibTeX RIS

Original content from this work may be used under the terms of the Creative Commons Attribution 4.0 licence. Any further distribution of this work must maintain attribution to the author(s) and the title of the work, journal citation and DOI.
1. Introduction
Thermoplastic polyurethanes (TPU) has been widely used in daily life (e.g., apparel accessories, footwear, toy models), industrial supplies (e.g., cable and wire, bearing, hose, and tube), and medical supplies (e.g. medical instrument cables, healthcare mattresses, and compression stockings) because of its excellent properties such as high elasticity, high energy absorption capability, prominent abrasion resistance, flame retardancy, and tearing resistance [1–6]. The commercial TPU products are manufactured according to the standard specifications by conventional systems, for instance, injection moulding, extrusion and blow moulding [1, 2, 7, 8]. However, the real applications of TPU have been limited to certain simple geometries [9] because of the complexity and time-consuming of the mould preparation. As a result, the traditional injection moulding process fails to manufacture the required products with complex structures and multifunctions.
Additive manufacturing (AM) is capable of fabrication of complex 3D parts directly from computer-aided design (CAD) including three-dimensional (3D) CAD models in a layer-by-layer manner [10–12]. The application of AM technology can not only reduce the manufacturing cycles and save raw materials, but also provide geometric freedom and individual customization [13]. Selective laser sintering (SLS) is a powder-bed based AM technique, in which the laser beam is used to melt the powders and bind them together [14, 15]. SLS can process a variety of materials including polymers (e.g., polyamide, polystyrene, etc) [16–22], metals (e.g., Al, Ti, Cu, Ni [23], alloys [24, 25] ), ceramics (alumina-zirconium ceramics synthesis) [26] and composite materials (e.g., Nylon-11 composites [27], ultra-high molecular weight polyethylene [28]).
The latest studies reported that multiaxial force sensors [29, 30], 3D soft auxetic lattice structures [31–34] and biomedical scaffolds [35] have been successfully fabricated with TPU powder via SLS technology. Some researches focus on the effect of the powder size and morphology on the mechanical properties and shape of final SLS fabricated products [36–38]. There are few reports regarding to the systematical research of SLS process optimization of TPU. The mechanical properties of SLS fabricated products mainly depend on the processing parameters (e.g., laser scanning power, laser scanning speed and layer thickness) [19, 39, 40]. However, the scanning power and scanning speed are limited to the 3D printers [19] and the layer thickness must be higher than the size of powders [41]. There is an urgent requirement to develop new types of functional polymers for SLS and further extending the potential applications. Therefore, this work aims to investigate the processability of a new elastomer TPU powder by SLS and systematically analyze the effects of SLS printing parameters on the morphology, thermal and mechanical properties of TPU.
2. Experimental
2.1. Materials
TPU powders (bulk density of 1.2 g cm−3) were obtained from laser sintering powders LUVOSINT® Lehmann & Voss, German, and used as received. The scanning electron microscopy (SEM) image (figure 1a) shows the irregular shape but relative smooth surfaces of TPU powders with a dominant particle size of 40–80 μm and an average size of 79.1 μm (figure 1b), which are suitable for SLS manufacturing process [42].
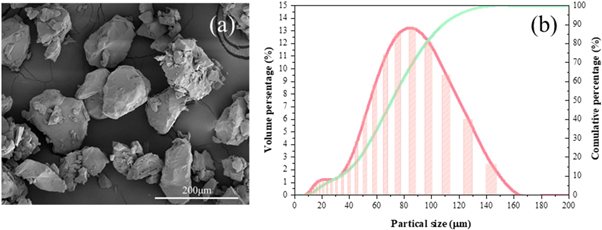
Figure 1. (a) SEM morphology and (b) particle size distribution of the TPU powders.
Download figure:
Standard image High-resolution image2.2. Preparation of TPU samples via SLS
The effects of SLS process parameters on the mechanical properties of TPU were investigated through the designing orthogonal experiments (table 1) and the results were calculated and analyzed to find out the optimal strategy. The relevant factors were scanning power, scanning speed and layer thickness. The orthogonal table L9(34) was designed in such manner that each factor has three levels (20, 23 and 25 W), set as scanning power (factor A), scanning speeds (factor B) of 4000, 4500 and 5000 mm s−1 were applied and layer thickness (factor C) of 0.1, 0.13 and 0.15 mm were used (please refer to supporting information tables S1 and S2 is available online at stacks.iop.org/MRX/7/055301/mmedia).
Table 1. Orthogonal experiment design of SLS processing.
| Factors | |||
|---|---|---|---|
| A | B | C | |
| No. | Power (W) | Speed (mm s−1) | Thickness (mm) |
| 1 | 20 | 4000 | 0.10 |
| 2 | 20 | 4500 | 0.15 |
| 3 | 20 | 5000 | 0.12 |
| 4 | 23 | 4000 | 0.15 |
| 5 | 23 | 4500 | 0.12 |
| 6 | 23 | 5000 | 0.10 |
| 7 | 25 | 4000 | 0.12 |
| 8 | 25 | 4500 | 0.10 |
| 9 | 25 | 5000 | 0.15 |
The TPU powders were manufactured via SLS equipment (HK S320 SLS system, Wuhan Huake 3D Technology Co. Ltd, China). A continuous wave CO2 laser (k = 10.6 μm) was equipped, which could be adjusted from 0 to 30 W. The powder was preheated by infrared radiation heating pipes before sintering. The effect parameters on the quality of SLS fabricated components included the laser power (p), laser scanning speed (v), laser scanning spacing (s), layer thickness (h) and powder bed temperature (Tb).The energy density (ED) was generally defined as the amount of energy input in a unit volume, which can be calculated by the equation (1) [43].

Three major parameters were fluctuated at discrete time intervals, including laser power, scanning speed and laser scanning spacing. Simultaneously, the rest parameters were set as fixed values (table 2). A 0.4 mm laser beam was used and the scanning spacing was set at 0.2 mm to ensure an overlap of 0.2 mm to the previous scan line. The specific SLS processing parameters were shown in Table S2.
Table 2. A summary of the processing parameters for the SLS experiments.
| Processing parameters | Values |
|---|---|
| Laser power (p) | 20–25 W (intervals of 2 W) |
| Laser scanning speed (v) | 4000–5000 mm s−1 (intervals of 500 mm s−1) |
| Laser scan spacing (s) | 0.2 mm |
| Layer thickness (h) | 0.10–0.15 mm (intervals of 0.02 mm) |
| Powder bed temp. (Tb) | 105 °C |
2.3. Characterization Techniques
Fourier transform infrared spectroscopy (FTIR) implemented by using a Bruker Tensor 27 instrument was used to measure the absorption of infrared radiation with an absorbance pattern of 600 to 4000 cm−1.
The crystalline characteristics of TPU powder and SLS fabricated specimens were analyzed by X-ray diffractometer technique (XRD, D8 ADVANCE, Bruker, Germany), using Cu Kα radiation in the 2θ range between 5° and 75° at sampling pitch of 0.02°, preset time of 5 seconds and scanning rate of 3 °/min.
A Zwick/Roell Z020 with a 1 kN load cell and 1 kN pneumatic clamps was used to carry out the tensile testing at room temperature according to the standard ISO 527-2 1B. Three samples ('dog bone' shape) were tested with a crosshead speed of 50 mm/min until the failure and the average value was reported. Since elastomers typically showed a extremely large elongation, the strain was calculated as the ratio of the extension of the clamps to the initial distance between the two clamps. The toughness of the samples was evaluated by the area under the stress-strain curve [44] and average value was reported after three repeated tests.
Thermal properties of SLS specimens were evaluated by Differential Scanning Calorimetry (DSC) (Perkin Elmer Instruments Ltd) under a nitrogen atmosphere. Specimens were ramped up to 250 °C at a heating rate of 10 °C/min and isothermally held for 5 mins. Afterwards the samples were ramped down to − 60 °C with a cooling rate of 5 °C/min.
The morphologies of the cross-section areas of the factured specimens (coated with platinum) after tensile tests were observed using JSM-7600F Scanning Electron Microscope (SEM) at the voltage of 10.0 kV.
2.4. Statistical analysis
All statistical analysis of the assay results was performed by variance (ANOVA) using GraphPad Prosm 6.0 (GraphPad Software, La Jolla, CA, USA). The multiple comparisions were performed by one-way ANOVA with a criterion α = 0.05.
3. Results and discussion
3.1. Orthogonal experiment
The effect of three factors on mechanical properties of TPU specimens was studied by orthogonal tests. The orthogonal table L9(34) is shown in table S1. The tensile properties of the specimens were listed in table 3. The range analysis of orthogonal experiments was shown in table 4, k1, k2 and k3 are the mean values of the tensile strength and elongation at the same level, which can be calculated by equation (2).

Where S1, S2 and S3 are the average tensile strength of scanning power (factor A), scanning speed (factor B) and layer thickness (factor C), respectively. For the same factor, range R is the average value difference between the maximum and the minimum values of K at the different levels.
Table 3. The results of orthogonal experiment.
| No. | Ave. tensile strength (MPa) | Elongation (%) |
|---|---|---|
| 1 | 20.08 | 423.50 |
| 2 | 10.70 | 503.43 |
| 3 | 14.25 | 490.40 |
| 4 | 16.86 | 474.80 |
| 5 | 18.28 | 473.73 |
| 6 | 19.23 | 460.57 |
| 7 | 22.24 | 421.43 |
| 8 | 20.93 | 378.97 |
| 9 | 12.78 | 499.63 |
Without any interaction between three factors, the result of RC > RB > RA is shown in table 4, indicating that the most remarkable factor for the tensile strength and elongation is layer thickness, then scanning speed and at last the laser power. For laser power (factor A), k3 > k2 > k1, which means as scanning power increases, the tensile strength and elongation of testing samples increase. For scanning speed (factor B), k1 > k2 > k3 indicates that as the scanning speed increases, the tensile strength and elongation of testing samples decrease. For layer thickness (factor C), the trend of k1 > k2 > k3 indicates that when layer thickness increases, the tensile strength and elongation decrease. When the scanning speed reaches the intermediate value, the tensile strength and elongation are the highest. The best combination of three factors should be A3-B1-C1, namely laser power of 25 W, scanning speed of 4000 mm s−1 and layer thickness of 0.1 mm. However, the layer thickness should be larger than particle size and the average particle size of the powder was 79.1 μm. In that case, the minimum layer thickness is 0.1 mm.
Table 4. Range analysis of orthogonal testing results.
| A | B | C | |
|---|---|---|---|
| Factors | Laser power | Scanning speed | Layer thickness |
| Tensile strength (MPa) | |||
| K1 | 15.01 | 19.73 | 20.08 |
| K2 | 18.12 | 16.64 | 18.26 |
| K3 | 18.65 | 15.42 | 13.45 |
| R | 3.64 | 4.31 | 6.63 |
| Elongation (%) | |||
| K1 | 472.44 | 439.91 | 421.01 |
| K2 | 469.70 | 452.04 | 451.64 |
| K3 | 433.34 | 483.53 | 470.10 |
| R | 39.10 | 43.62 | 49.09 |
In this research, the specimen produced at the parameters of 20 W, 4500 mm s−1 and 0.15 mm displayed the lowest tensile strength, which was chosen as the reference to compare with the specimen fabricated at the optimisation conditions.
The maximum laser power of the equipment is 25 W. Hence, the laser scanning power of 25 W, layer thickness of 0.1 mm, and five different laser scanning speed values of 3000, 3250, 3500, 3750 and 4000 mm s−1 were used to further optimize the processing parameters and investigate the effect of laser scanning speed on the tensile properties of SLS fabricated TPU products (table 5). Four samples are made for each set of parameters.
Table 5. A summary of the optimal processing parameters for the SLS experiments.
| Processing parameters | Value |
|---|---|
| Laser power (p) | 25 W |
| Laser scanning speed (v) | 3000–4000 mm s−1 (intervals of 250 mm s−1) |
| Laser scan spacing (s) | 0.2 mm |
| Layer thickness (h) | 0.1 mm |
| Powder bed temperature (Tb) | 105 °C |
3.2. FTIR and XRD analysis of TPU specimens
The peak at 3332 cm−1 specifies the N–H group in urethane (–NHCOO–), and the peaks at 2955 and 2850 cm−1 belong to the asymmetric and symmetric vibration of the –CH2 group (figure 2). The transmittance of TPU specimens decreases after sintering, and there is a strong similarity about the results of TPU specimens produced under different parameters.
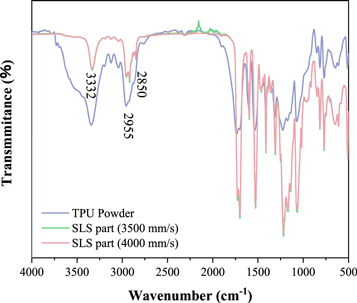
Figure 2. FTIR result of TPU specimens by SLS.
Download figure:
Standard image High-resolution imageThe diffraction peak at 2θ = 20° is the characteristic of the hard segment of TPU crystalline structure [45]. Compared with TPU raw powder, the diffraction intensity of SLS specimen (3750 and 4000 mm s−1) decreases (figure 3). FTIR and XRD results showed that the TPU powders were printed successfully without chemical reactions occurred during sintering because of no extra chemical bonds.
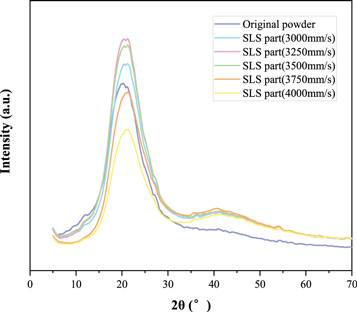
Figure 3. XRD patterns of the original TPU powder and specimens manufactured by SLS.
Download figure:
Standard image High-resolution image3.3. Mechanical properties
The tensile strength of the TPU samples made by different processing parameters are shown in figure 4. It can be found that as the scanning speed increases, the tensile strength of samples first increases, and reaches the maximum value at the scanning speed of around 3500 mm s−1. Then, the tensile strength begins to decrease, with the increasing of scanning speed. Generally, the higher the scanning speed, the lower the tensile strength. The scanning speed determines the heating time of TPU powder taken from the CO2 laser beam. At a fixed laser power, an enhancement of the scanning speed shortens the heating time on polymer powders, resulting in weaker bonding between powder particles therefore deteriorating the mechanical properties. When laser energy density is too low, the TPU powder cannot be sufficiently melted, resulting in a lower mechanical strength. The melt viscosity of TPU powder decreases, and the laser energy density increase, and thus the product shows increased mechanical strength. However, if the laser energy density is too high, TPU powder would be over melted and decomposed, leading to a decrease in the mechanical strength. Based on the results of the statistical analysis in figure 4, it can be found that there is a significant difference between the tensile strength of the specimnes manufactured under the scanning speed of 4000 mm s−1 and 3500 mm s−1 (P < 0.05). It is also proved that the incomplete sintering has a negative effect on the mechanical properties of materials which is caused by high scanning speed.

Figure 4. Tensile strength of TPU specimens under different scanning speed.
Download figure:
Standard image High-resolution imageBased on the results discussed above, the main SLS processing parameters for the TPU powder can be optimized as follows: the laser power of 25 W, scanning speed of 3500 mm s−1 and layer thickness of 0.1 mm.
The stress–strain curves of the SLS specimens fabricated under different parameters are shown in figure 5. The mechanical properties of the TPU samples made by the different parameters are summarized in table 6. The SLS specimens exhibited the best tensile strength of 20.02 MPa and toughness of 26 631 J mm−3. The elongation of the specimens decreases, when scanning speed increases. And the specimens manufactured under the scanning speed of 3000 mm s−1 showed a significant statistical difference compared with the specimens manufacutred at 3500 mm s−1 in elongation. It shows that materials aging which is induced by oversintering can exert a negative effect on elongation.
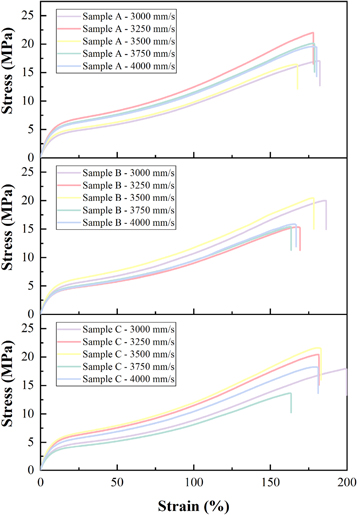
Figure 5. Stress–strain curves of the SLS TPU specimens under different parameters.
Download figure:
Standard image High-resolution imageTable 6. The mechanical properties of TPU under different processing parameters. Data is shown as the mean ± SD.
| Mechanical Properties | 3000 mm s−1 | 3250 mm s−1 | 3500 mm s−1 | 3750 mm s−1 | 4000 mm s−1 |
|---|---|---|---|---|---|
| Tensile Strength (MPa) | 18.56 ± 0.55 | 19.31 ± 1.04 | 20.02 ± 0.51 | 19.42 ± 0.58 | 17.69 ± 0.95(*) |
| Toughness (J/mm3) | 26 229.67 ± 2357.40 | 26 242.00 ± 5518.18 | 26 631.00 ± 4794.40 | 21 448.00 ± 5799.36 | 25 265.33 ± 2881.48 |
| Elongation at break (%) | 617.30 ± 8.19 (*) | 595.66 ± 15.89 | 581.76 ± 9.67 | 564.06 ± 9.11 | 578.43 ± 2.47 |
*indicates a significant difference compared to the 3500 mm s−1 group (P < 0.05).
The results indicated that the internal voids in TPU specimens have a negative effect on the toughness and ductility, and the inevitable holes in SLS sample accelerate the initiation and failure of cracks. Nonetheless, the elongation of SLS components of TPU is still better than that of commercially SLS polymers including PA, PEEK and PS [46–48].
3.4. Melting and crystallization characteristics
The DSC curves of TPU powder and SLS specimens made under different parameters are shown in figure 6. Table 7 shows glass transition temperature (Tg), melting enthalpy (ΔH) and melting temperature (Tm) of TPU powders and SLS specimens. The increasing glass transition temperature was caused by a homogeneous mixture due to the partially dissolving of hard segments into soft phase [49]. Intermolecular hydrogen bonding forms an impermeable hard-segment domain, which may enhance the mechanical properties of TPU. When the scanning speed was decreased from 3750 to 3500 mm s−1, the mobility of TPU chains increases. This might increase the probability of forming hard segment domains. The integrated endothermic peak of 'hard segments domains' increased from 14.11 to 14.82 J g−1 between 105 ℃ and 170 ℃. Once the scanning speed decreases, the glass transition temperature of TPU specimen shifted to higher temperature due to the decrease of mobility of TPU soft segments.

Figure 6. DSC analysis of SLS fabricated TPU specimens under different scanning speed.
Download figure:
Standard image High-resolution imageTable 7. DSC analysis of TPU powders and SLS fabricated specimens.
| Sample code | Tg (°C) | ΔH (J g−1) | Tm (°C) | |
|---|---|---|---|---|
| Raw material | −19.01 | −14.11 | 145.59 | |
| SLS sample | 3000 mm s−1 | −19.77 | −13.64 | 145.68 |
| 3250 mm s−1 | −22.88 | −14.39 | 144.96 | |
| 3500 mm s−1 | −25.87 | −14.82 | 146.08 | |
| 3750 mm s−1 | −23.84 | −14.62 | 142.91 | |
| 4000 mm s−1 | −18.48 | −13.43 | 145.47 | |
3.5. Morphological analysis
The cross-section areas of TPU parts after tensile testing are shown in figure 7. The typical failure mode is cleavage cracks accompanied with some smooth dimples. Some dimples and flowing stripes are clearly shown in the figures. The intended morphology can be found as the typical characteristic due to over-sintering [50].

Figure 7. Cross-section areas of the facture after tensile test at the different scanning speeds: (a) 3000 mm s−1, (b) 3250 mm s−1, (c) 3500 mm s−1, (d) 3750 mm s−1, (e) 4000 mm s−1.
Download figure:
Standard image High-resolution image
When the scanning speed reaches up to 3500 mm s−1 (figure 7c), the highest tensile strength was obtained. Figure 7 (a–b) show the fracture surfaces of samples with different scanning speeds (3000 and 3250 mm s−1, respectively). High energy density owing to over-sintering will lead a negative impact on the mechanical properties. When scanning speed increases, enlarged dimples and unmelted particles may appear because of insufficient energy density. These unmelted cores make the material behave as a microcomposite, which showed a pinning effect. As a result, the substantial increment in elongation at the break can be improved [19].
4. Conclusions
This work investigated the effects of SLS parameters on the processability of TPU powder. The major findings include:
- 1.Layer thickness has the remarkble effect on tensile strength and elongation, followed by scanning speed and then the laser powder. As the scanning speed increases, the mechanical properties of TPU samples increase then decrease. As the scanning power or layer thickness increases, the mechanical properties decrease.
- 2.The molten materials were heated up uniformly at 105 °C until the entire production process was completed without any chemical reactions during the SLS process, proved by XRD and FITR results.
- 3.The optimal tensile strength and superlative toughness of the optimized TPU sample (the laser power of 25 W, scanning speed of 3500 mm s−1 and layer thickness of 0.1 mm) are 20.02 MPa and 26 631 J mm−3, respectively, which has an 87.1% enhancement in tensile strength compared to that of reference specimen (20 W, 4500 mm s−1, 0.15 mm).
Acknowledgments
The authors gratefully acknowledge the financial support from National Natural Science Foundation of China (Grant No. 51675496, No. 51902295, No. 51671091,). This paper is Center for Innovative Gem Testing Technology (CIGT) contribution CIGTWZ-2019027. Many thanks to the State Key Laboratory of Materials Processing and Die & Mould Technology of Huazhong University of Science and Technology for the SEM and tensile tests.