Abstract
Zn1−xSmxO nanoparticles, with 0.00 ≤ x ≤ 0.10, were prepared using chemical co-precipitation method. The structure and morphology of the obtained samples were characterized using x-ray powder diffraction (XRD), transmission electron microscopy (TEM) and scanning electron microscopy (SEM), respectively. However, the mechanical properties were investigated via digital Vickers microhardness tester. Vickers microhardness measurements were carried out at different applied loads, varying between 0.5 and 10 N at dwell time 60 s on pressed discs of average thickness 3 mm. Hv decreased as the Sm-content increased up to 0.02 and then it increased for higher concentrations. Whereas, it increased as the applied load increased, revealing that the samples exhibited a reverse indentation size effect (ISE). The microhardness measurements were interpreted using various models such as Meyer's law, Hays and Kendall (HK) approach, elastic/plastic deformation (EPD), proportional specimen resistance (PSR) and the indentation-induced cracking (IIC). Mechanical parameters such as Young's modulus (E), yield strength (Y), fracture toughness (K) and brittleness index (B) were calculated as a function of x. The most adequate model for the true microhardness of these samples is IIC. It was found that the addition of Sm content enhanced the mechanical properties of the prepared samples after x = 0.02. Dielectric measurements were used to compute different parameters such as real and imaginary parts of the complex permittivity, dielectric loss (tan δ) and ac conductivity (σac).
Export citation and abstract BibTeX RIS

Original content from this work may be used under the terms of the Creative Commons Attribution 4.0 licence. Any further distribution of this work must maintain attribution to the author(s) and the title of the work, journal citation and DOI.
1. Introduction
Recently, semiconductor nanomaterials have established wide knowledge than their same bulk materials, due to their size and surface effects, which display distinctive properties such as magneto-optical, electrochemical, sensor materials, bio-medical and photo-catalytic activity [1–5]. Also, the use of semiconductor materials in modern applications as computer and photovoltaic production led to fully open research in the field of materials science [6–10]. Among the II-VI semiconductor compounds, ZnO is denoted by broad direct band gap energy, large exciton binding energy (60 meV) and high transmission in the visible zone [6, 11–16]. Owing to these characteristics, ZnO nanoparticles play an essential role in different applications [17, 18].
Doping ZnO semiconductor nanoparticles with impurities like transition metals and rare earth elements improved its electrical, optical, mechanical and magnetic properties. Ram et al [19] reported the effect of Co2+ doping on the structural and dielectric properties of ZnO nanoparticles synthesized by solution combustion technique where urea is used as fuel. By sol-gel method, Adra et al [20] investigated the influence of doping transition metals (Ni, Co, Mn and Cr) and annealing temperature on the structural and mechanical properties of ZnMgO nanoparticles. Ghosh et al [21] investigated the result of Ni doping on the dielectric constants of ZnO and its frequency dependent exchange interaction via a simple dissolution followed by precipitation method. The study of materials with high dielectric constant led to many applications like microelectronics [22]. The material's dielectric constant is an essential property that influences opto-electronic and transport properties. Dynamic properties of semiconducting and dielectric materials such as dielectric constant, dielectric loss tangent, conductance and capacitance show the internal structure of the material in the zone of comparatively low conductivity.
Recently, researches regarding the mechanical properties of nanoparticles showed a great interest as a result of the difference in the mechanical properties between nanoparticles and microparticles together with bulk materials allowing for many applications in variety of domains like tribology, surface engineering and nanomanufacturing/nanofabrication [23]. Mechanical parameters like hardness, yield strength, elastic modulus, fracture toughness and brittleness alter exceedingly with different doping [20] and their investigation for ZnO compound is vital because of its use in nano-electro-mechanical systems, transparent high power electronics and nano-generators [24]. In industry, hardness tests are often accustomed to find out the fabrication quality of the materials and especially the management of the effectiveness of heat treatment because of the simple nondestructive test applied rapidly. In modern material science, fracture mechanics is an important tool in improving the mechanical performance of materials and components. ZnO is a relatively soft material that is used in ceramic capacitors. The piezoelectric constant, high heat capacity and heat conductivity, low thermal expansion, and high melting temperature of ZnO are beneficial for ceramics, which require a large electromechanical coupling. Unfortunately, ceramics are very sensitive to flaws and have a disposition to brittle failure [25]. The brittle fracture behavior of dielectric ceramics and the relationships between defects such as cracks and electrical degradation must be considered to avoid failure of ceramic capacitors. Stresses originating from the ferroelectric phase transformation in these dielectric materials may act as a driving force for crack growth. Zinc oxide applied for varistors, are mainly designed with respect to electrical rather than mechanical properties, and thus they usually contain a high degree of porosity which may act as the origin of fracture. The interconnection between the electric and mechanical properties in the fabrication of electro-ceramics is vital.
Motivated by the importance of Samarium in variety of applications and the lack in the experimentation concerning the influence of Samarium doping on the dielectric and mechanical properties of ZnO nanoparticles, this work investigates the effect of Sm doping on ZnO nanoparticles. Our investigated values of the mechanical properties for Samarium doped ZnO nanoparticles should provide a basis for future experimental studies to improve the dielectric applications along with ceramic capacitors.
2. Experimental techniques
The Zn1−xSmxO nanopowder samples, 0.00 ≤ x ≤ 0.10, were prepared by co-precipitation method using zinc chloride (ZnCl2) as the source of zinc and samarium (III) chloride hexahydrate as the source of Sm. Based on stoichiometric ratios, the portions of each substance were computed for x = 0.00, 0.01, 0.02, 0.04, 0.06, 0.08 and 0.10 in Zn1−xSmxO nanoparticles. This method was reported in previous work [26].
Zn1−xSmxO nanoparticles were characterized by x-ray powder diffraction at room temperature using Bruker D8 advance powder diffractometer with Cu-Kα radiation (λ = 1.54056 Å) in the range 10° ≤ 2θ ≤ 80°. TEM micrographs were obtained by using Jeol transmission electron microscope JEM- 100CX, operated at 80 kV. In addition, SEM images were performed using AIS 2300 C scanning electron microscopy, operated at 20 kV × 1.0 k, with a resolution power of 50 μm. The Vickers microhardness (Hv) values of the Zn1−xSmxO nanoparticles with x = 0.00, 0.01, 0.02, 0.04, 0.06 and 0.10 were measured in air using a digital microhardness tester (MHVD-1000IS) at room temperature. The applied loads F range from 0.25 N to 10 N for dwell time t = 60 s. For each value of F, the mean value of three Hv readings, taken at different locations of the sample's surface to ensure the accuracy of Hv, was calculated using equation (1) by measuring the dimension of the diagonal length of the indentation d (μm) [27].

The dielectric measurements of Zn1−xSmxO nanoparticles were performed using HIOKI 3532–50 LCR Hi-tester (10 KHz ≤ f ≤ 1100 KHz, 25 °C ≤ T ≤ 500 °C). The powder samples were pressed at 12 tons for 2 min into pellets of diameter 13 mm and thickness 2–4 mm. The pellets were heated at 800 °C for 2 h, then they were painted by silver from both sides to act as electrodes which in turn were joined by a thin copper wire and conducting silver paste to provide ohmic contacts. From the measurements of capacitance, dielectric loss (tanδ) and the dimensions of the pellet, the dielectric constants (ε' and ε'') and ac conductivity (σac) were determined using equations (2)–(4)respectively:


where ε0 is permittivity of free space  A is the area of electrode (m2), d is the pellets thickness, f is the frequency of applied field (Hz) and ω = 2πf is the angular frequency.
3. Results and discussion
3.1. Characterization analysis
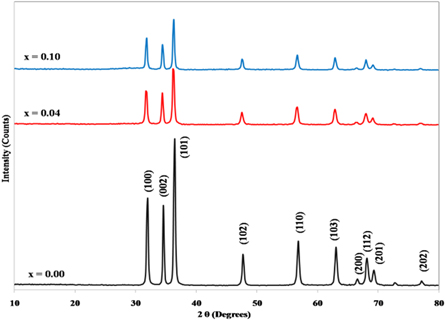
Figure 1 reveals the XRD patterns of Zn1−xSmxO for x = 0.00, 0.04 and 0.10. The observed peaks match with those of wurtzite hexagonal structure ZnO (JCPDS card No. 36–1451, a = b = 3.249 Å, c = 5.206 Å) with the preferred orientation of (101) planes. There are no indications for secondary phases for all prepared samples, indicating the high purity and the complete solubility of Sm on Zn location. The crystalline size and the lattice parameters, listed in table 1, were calculated by using Scherrer's equation and Bragg's equation respectively [26]. The crystalline size, calculated from XRD, was found to decrease with the increase of Sm doping which can be attributedto the distortion of the crystal lattice due to substitution of larger ionic radii of Sm3+ ions (0.95 Å) compared to Zn2+ ions (0.74 Å) [26]. The values of the lattice parameters a and c varied with the increase of Sm doping, revealing that the ZnO structure was disturbed by the doping of Sm. In table 1, the values of a and c of Zn1−xSmxO nanoparticles, with 0.00 ≤ x ≤ 0.10, were greater than those of pure ZnO for x = 0.02, 0.04, and 0.10. However, the lattice constants decreased for x = 0.01, 0.06, and 0.08 with respect to pure ZnO. Decrease in lattice parameters is expected when Sm substitutes Zn while the lattice parameter will increase when Sm occupies interstitial sites [26, 28].
Figure 1. XRD patterns of Zn1−xSmxO for x = 0.00, 0.04 and 0.10.
Download figure:
Standard image High-resolution imageTable 1. Values of the lattice parameters (a and c) from XRD and the crystallite size (D) conducted from XRD and TEM measurements for Zn1−xSmxO nanoparticles.
| x | a(Å) | c(Å) | D(XRD)(nm) | D(TEM) (nm) |
|---|---|---|---|---|
| 0.00 | 3.242 | 5.193 | 54.4 | 49.4 |
| 0.01 | 3.236 | 5.164 | 43.4 | 38.8 |
| 0.02 | 3.243 | 5.194 | 36.2 | 33.2 |
| 0.04 | 3.244 | 5.197 | 35.6 | 31.1 |
| 0.06 | 3.234 | 5.182 | 35.6 | 30.6 |
| 0.08 | 3.239 | 5.188 | 35.2 | 29.2 |
| 0.10 | 3.356 | 5.392 | 33.4 | 27.5 |
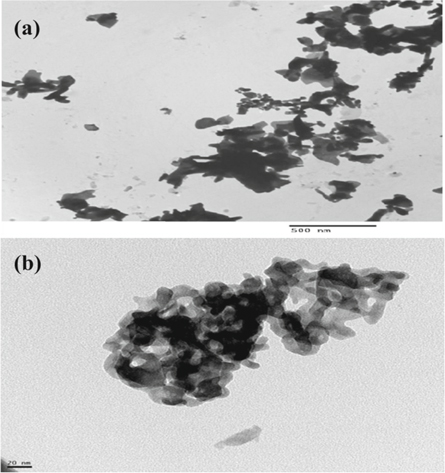
Figures 2 (a) and (b) show the TEM images of Zn1−xSmxO for x = 0.00 and 0.10, respectively. The computed size from TEM is in good agreement with those calculated from XRD as shown in table 1. Figure 2(b) clearly shows an agglomeration of the prepared nanoparticles for a high doping level of Samarium with x = 0.10 [26].
Figure 2. TEM micrographs for Zn1−xSmxO with: (a) x = 0.00 and (b) x = 0.10.
Download figure:
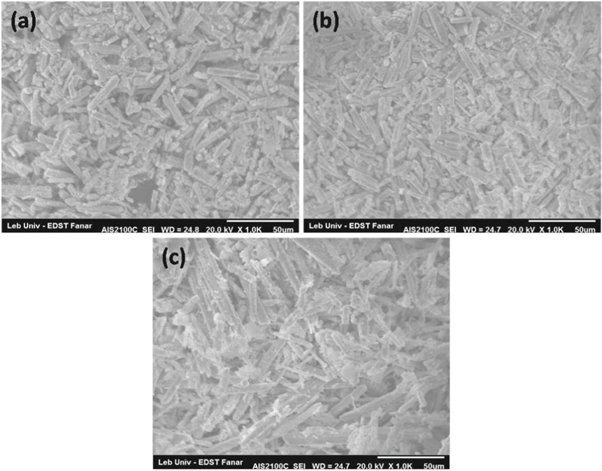
Standard image High-resolution imageThe SEM micrographs of Zn1−xSmxO nanoparticles with x = 0.00, 0.04 and 0.10 are shown in figure 3. Figure 3(a) reveals that the nanoparticles were distributed in homogenous and uniform shape manner. It possesseswell defined grain boundaries and pores. From figures 3(b) and (c), it is noticed that doping ZnO with Sm has influenced the surface morphology and the size of the particles which reveals the good consistency between the SEM results with our published data regarding the decrease of crystalline size with further increase of Sm concentrations [26]. Upon doping, the surface becomes more rough and the particles denser and smaller; consequently, the agglomeration of nanoparticles with each other may be attributed to the higher relative surface to volume ratio causing an increase in the attractive forces among the nanoparticles [29, 30]. The schematic diagram represented in figure 4 shows the morphological changes and the growth mechanism of agglomeration process especially at high doping concentrations of Sm.
Figure 3. SEM images of: (a) x = 0.00, (b) x = 0.04 and (c) x = 0.10.
Download figure:
Standard image High-resolution imageFigure 4. Schematic illustration of the growth mechanism for agglomeration of ZnO nanoparticles at high Sm doping percentages.
Download figure:
Standard image High-resolution image3.2. Vickers microhardness measurements
Figure 5 shows the Hv values, calculated using equation (1), as a function of F at loading time t = 60 s for Zn1−xSmxO with x = 0.00, 0.01, 0.02, 0.04, 0.06 and 0.10. For F ≤ 5 N, Hv increases non-linearly along with the applied load; however, a plateau regime exists for F > 5 N, revealing a reverse indentation size effect (RISE). Li and Bradt [31] investigated the RISE behavior by IIC model, where the applied load is balanced in the maximum depth by the total sample resistance. According to this model, the ISE behavior explains friction (slip) and elastic effects. On the other hand, indentation cracking in the samples will lead to the RISE behavior. To investigate the best fit model regarding our obtained experimental Hv results, Meyer's law (equation (5)) together with HK (equation (6)), EPD (equation (7)), PSR (equation (8)) and IIC (equation (9)) models are analyzed using:


where A is the standard hardness constant, n is Meyer's index, A1is a load independent constant, W is the minimum applied load needed to start an indentation, A2 is a constant, d0 is related to the plastic deformation,  is a constant related to plastic properties,
  represents the surface energy and λ1, K1, K2 are constants.
Figure 5. Variation of Hv as a function of F at loading time t = 60 s for Zn1−xSmxO with x = 0.00, 0.01, 0.02, 0.04, 0.06 and 0.10.
Download figure:
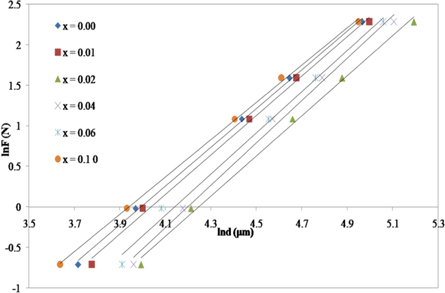
Standard image High-resolution imageTo ensure the RISE behavior of the samples, Meyer's law was applied. The plot of ln(F) against ln(d), shown in figure 6, reveals the linear dependence from which A and n are calculated and listed in table 2. It is noticed that the samples displays RISE behavior since the values of slope (n) are greater than 2. The parameters obtained from the above mentioned models are listed in table 2. Negative values of W, d0 and α obtained from HK, EPD and PSR models, respectively, reveal the RISE behavior indicating that the applied load is adequate to explain only the plastic deformation for all samples [20, 32].
Figure 6. Variation of lnF against lnd using Meyer's law for Zn1−xSmxO with x = 0.00, 0.01, 0.02, 0.04, 0.06 and 0.10.
Download figure:
Standard image High-resolution imageTable 2. The fitting parameters obtained from different models for Zn1−xSmxO with x = 0.00, 0.01, 0.04, 0.06 and 0.10.
| x | Meyer | HK | EPD | PSR | IIC | |||||
|---|---|---|---|---|---|---|---|---|---|---|
| n | A | W | A1 | A2 | d0 | α | β | k | m | |
| *10−5 (GPa) | (N) | *10−4 (N/(μm)^2) | *10−4 (N/(μm)^2) | (μm) | (N/(μm) | *10−4 (N/(μm)^2) | (N^((3 − 5 m)/3)/μm^(2−3 m)) | |||
| 0.00 | 2.392 | 7.098 | −0.43003 | 4.9 | 5.616 | −11.75 | −0.01081 | 5.5 | 78.728 | 0.4 |
| 0.01 | 2.431 | 5.462 | −0.453 | 4.6 | 5.382 | −12.63 | −0.01118 | 5.2 | 91.377 | 0.41 |
| 0.02 | 2.476 | 2.726 | −0.49273 | 3.2 | 3.686 | −16.73 | −0.01001 | 3.6 | 91.652 | 0.42 |
| 0.04 | 2.613 | 1.721 | −0.60271 | 3.8 | 4.665 | −18.88 | −0.01356 | 4.5 | 139.91 | 0.46 |
| 0.06 | 2.536 | 2.753 | −0.60979 | 4.1 | 4.928 | −16.46 | −0.01313 | 4.8 | 123.47 | 0.44 |
| 0.10 | 2.301 | 1.155 | −0.31592 | 5.1 | 5.664 | −8.743 | −0.00859 | 5.6 | 52.72 | 0.36 |
The theoretical values of Vickers microhardness are calculated using the following relations [27, 33]:


where  and m are constants that are load independent.
The indentation-induced cracking (IIC) model explains the RISE behavior. From equation (13), the values of k and m are obtained from the plot of ln(Hv) versus ln( ). The values of m, listed in table 2, are smaller than 0.6 showing that the samples follow the RISE mode where no elastic deformation is observed [33, 34].
Figures 7(a) and (b) display the variation of measured Hv (experimental) and calculated Hv (theoretical) as function of F for Zn1−xSmxO with x = 0.00 and 0.04, respectively. It is clearly shown that IIC model matches our experimental results with a deviation about 5%.
Figure 7. Variation of measured Hv (experimental) and calculated Hv (theoretical) from HK, EPD, PSR and IIC models as function of F for Zn1−xSmxO with (a) x = 0.00 and (b) 0.04.
Download figure:
Standard image High-resolution imageThe mechanical parameters (E, Y, K and B) are calculated using equations (14)–(17) and recorded in table 3 together with the measured microhardness values of Zn1−xSmxO samples.


Table 3. Values of E, Y, K and B at applied load in the plateau region for Zn1−xSmxO with x = 0.00, 0.01, 0.04, 0.06 and 0.10.
| x | Hv (GPa) (plateau region) | E (GPa) | Y (GPa) | K (GPa.μm1/2) | B (μm−1/2) |
|---|---|---|---|---|---|
| 0.00 | 0.845 | 69.28 | 0.28 | 1.22 | 0.69 |
| 0.01 | 0.792 | 64.91 | 0.26 | 1.20 | 0.65 |
| 0.02 | 0.535 | 43.82 | 0.17 | 0.93 | 0.57 |
| 0.04 | 0.637 | 52.24 | 0.21 | 1.19 | 0.53 |
| 0.06 | 0.681 | 55.81 | 0.22 | 1.21 | 0.56 |
| 0.10 | 0.893 | 73.18 | 0.29 | 1.12 | 0.79 |
The proportionality between the young's modulus (E) and the yield strength (Y) with the hardness explains the same trend in variation of their values as given in table 3. Their values decrease initially when the Sm concentration is up to x = 0.02, then rise with increasing Sm content and exceed the original values of the pure ZnO sample, when the Samarium dopant is at x = 0.10. The decrease in Hv for doped samples with x = 0.01 and x = 0.02 relative to the undoped sample is related to the decrease of crystalline size from 54.4 nm to 36.2 nm. When the size of the particles decreases, porosity of the samples increases. Hence, the hardness of the doped samples decreases [20]. Therefore, increasing the porosity results in decreased mechanical properties; however, the majority of applications involving porous ceramics require excellent mechanical properties [35–37]. The increase of the hardness with the further increase in the Sm doping above x = 0.02 may be attributed to the substitution of Zn2+ ions by Sm3+ ions in the crystal lattice which decrease the weak lattice stresses on the surface by removing the defect centers [38]. The increase in microhardness can be also ascribed to the impedance to crack propagation among the grains and the enhancement of grain connectivity with Sm-substitution. For Co and Al co-doped nano-crystalline ZnO samples, Siddheswaran et al [39] describes that Vickers microhardness depends on the dopant concentrations, as it increases with Co and decreases with Al content. E and Y values change in the same manner due to their relation to the hardness. The higher value of E and thus Y of a sample, the stronger the bond between the atoms or molecules in materials. The values of the fracture toughness and brittleness fluctuate with the Samarium concentration.
ZnO is considered to be relatively 'soft' material compared to other ceramics [40] and the hardness values of ZnO vary between 0.0105 GPa and 6 GPa as reported by Kaya et al [41] and Keyan et al [42], respectively. The hardness of our synthesized Zn1−xSmxO nanoparticles is equal to 0.845 GPa for x = 0.00 which lies in the above-mentioned range.
3.3. Dielectric studies
For pure and Sm-doped ZnO samples, the dielectric constants (ε' and ε''), dielectric loss (tan δ) and ac conductivity (σac) are measured by changing the frequency at a specific temperature. The reliance of dielectric parameters on frequency and temperature is useful in structural changes, transport mechanism and defect behavior of a solid [43]. The polar molecule ZnO, exhibiting a permanent dipole moment, is sensitive to external ac electric filed. Upon doping ZnO with Samarium, persistent electric dipoles arise due to hopping between Zn2+ and Sm3+ ions [44].
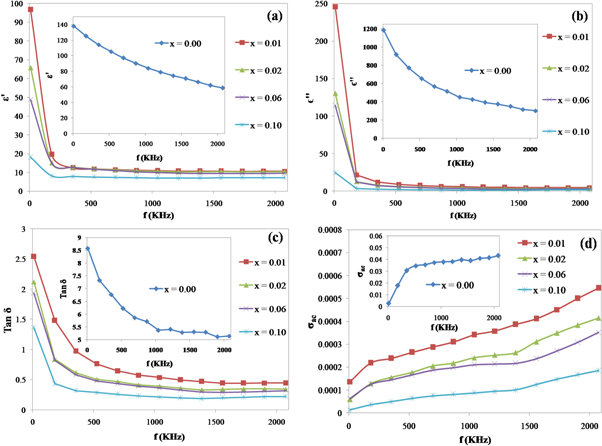
Figures 8(a)–(d) and 9(a)–(d) display the variation of ε', ε'', tan δ and σac as function of frequency for Zn1−xSmxO (x = 0.01, 0.02, 0.06 and 0.10) at 300 and 773 K, respectively. The insets of the figures represent the dependence of ε', ε'', tan δ and σac on the frequency for x = 0.00. It is clearly noticed that the dielectric constants and dielectric loss achieve high values at lower frequencies and then they decrease exponentially with increasing frequency, where they reach constant values at higher frequencies. The predominance of the four polarizations (space charge, orientational, electronic and ionic) and the existence of space charge polarization near the grain boundary interfaces in the low frequency zone explain the higher values of dielectric constants and dielectric loss [45, 46]. The reduction in the values of dielectric constant and dielectric loss at higher frequencies may be attributed to the drop in the importance of these polarizations together with the lack of charge polarization near the grain boundary interface [47], leading to the contribution of the prepared samples in nonlinear optical (NLO) applications because of high optical quality of the crystal with minor defects [48, 49]. The observed frequency dependent dielectric behavior can be explained by Maxwell-Wagner type relaxation [50]. Materials with structural in-homogeneity are formed of well conducting grains that are separated by insulating grain boundaries. Upon applying external electric field, the space charge carriers can easily move into the grains where they gather and become trapped through the defects at the interfaces leading to the formation and alignment of dipole moments. At low frequencies, the high values of dielectric constants may be ascribed to charged defects, interfacial dislocations, grain boundaries effect, oxygen vacancies, micro-pores, dangling bonds and interfacial/space charge polarization because of heterogeneous dielectric structure. Above a certain frequency of the external electric field where the orientation polarization is dominant [51, 52], the hopping between different metal ions cannot follow the alternating field. The probable origin of orientation polarization is the presence of oxygen vacancies and zinc interstitials in the nano-sized ZnO [53]. The polarizability of metal ions lags behind the external electric field at higher frequencies where the dielectric constants attain constant values. The dielectric loss (tan δ) values decrease with increasing frequency and become almost frequency independent at high frequency zones because the motion of domain walls is inhibited and magnetization is forced to change rotation, revealing the application of these materials in high frequency devices [54]. Materials with high dielectric constants along with low dielectric loss have received exceptional recognition in various applications [55, 56]. The dielectric constants and dielectric loss are also influenced by the Samarium doping. It is noticed that these parameters decline with the increase in the concentration of Sm for the same frequency that may be explained by the effect of Sm3+ on the polarizability of ZnO [57].
Figure 8. Variation of ε', ε'', tan δ and σac as function of frequency for Zn1−xSmxO with x = 0.01, 0.02, 0.06 and 0.10 at T = 300 K.
Download figure:
Standard image High-resolution imageFigure 9. Variation of ε', ε'', tan δ and σac as function of frequency for Zn1−x SmxO with x = 0.01, 0.02, 0.06 and 0.10 at T = 773 K.
Download figure:
Standard image High-resolution imageRegarding the dependence of ac conductivity on the frequency, it is observed that σac increases along with the frequency for all samples due to grain effect and increase in hopping of charge carriers as explained by Koop's theory [51]. The increase in conductivity is almost zero in low frequencies region. Above a certain characteristic frequency called the critical frequency, the conductivity increases according to the Jonscher power law relation [58] in disordered materials:

where  is angular frequency, A is a constant and s is a frequency exponent, generally less than or equal to 1. As stated above,
  is calculated using equation (4). The interfaces or grain boundaries present potential barriers to the movement of charge carriers that seem to be confined in a potential well. The charge carriers are free to migrate inside the grains; however, the grain boundaries pose resistance to the flow of the charge carriers that cannot move further.
At high frequencies, the charge carriers possess enough energy to overcome the potential barriers leading to the fast improvement in the conductivity, because increase in frequency intensifies the charges flow. Values of s > 1 are announced in ion conducting glasses [59] and ionic crystals [60, 61] and pointed up by Papathanassiou et al [62–64] in a new form of the universal power law, where they concluded that there is an upper frequency limit for the dispersive conductivity after which saturation is observed. The measured conductivity almost saturates in the high frequency limit as observed in some cases such as in conducting polypyrrole and polyaniline [65]. Panteny et al [66] reported that at high frequencies (>107 Hz), the ac conductivity of the capacitors is much higher than that of the resistors; then, the network conductivity presents a frequency independent behavior. Vohra et al [67] announced that  gets saturated to a value approximately equal 10−3 Ω−1cm−1 near 8 GHz for As2Se3. In our work, the frequency limit of our instrument is 106 Hz; consequently, the saturation of ac conductivity could not be detected.
For a given frequency, the conductivity decreases with the increase of Samarium doping due the reduction in the concentration of intrinsic donors leading to the cease of the hopping mechanism between Zn2+ and Sm3+; consequently, the n-type conductivity of host ZnO decreases [68].
Figures 10(a) and (b) represent the temperature dependence of dielectric constant ε' and ac conductivity σac at f = 500 KHz for x = 0.01, 0.02 and 0.06. Values of ε' and σac decrease as the Samarium doping content increases at all temperatures. It is noticed from figure 10 that the dielectric constant ε' decreases with the increase in measuring temperature up to 450 K and then increases with more rise in temperature. The following behavior may be ascribed to the depletion of pore space volume between the particles, when the synthesized nanoparticles are influenced by high temperature sintering that leads to a growth in the larger grains at the expense of smaller grains and decrease of the energy barrier with fast grow of the diffusion of atoms to another grain. Thus, our sintered nanoparticles reveal conductor type behavior because of the increase of conductivity with enlargement of the mobility. At T = 773 K, ε' and σac attain the highest values which are attributed to structural relaxation where the polarization resulting from molecular dipoles becomes significant and adds to other contributions of polarizability [69] and the increase of the mobility of the charge carriers in accordance with the ion hopping mechanism [70], respectively.
Figure 10. Variation of ε'(a) and σac (b) as function of temperature at constant frequency f = 500 KHz.
Download figure:
Standard image High-resolution image4. Conclusion
Single phase samarium doped ZnO nanoparticles were prepared by co-precipitation method and investigated via Vickers microhardness and dielectric measurements. The values of Hv increased with the applied load, indicating an RISE behavior of the prepared samples. Microhardness, Young's modulus and yield strength values decreased for Sm concentration up to x = 0.02, then they increased with further increase of Sm content and exceeded the original values of the pure ZnO sample at x = 0.10. The experimental data of the Hv measurements were explored using Meyer's law, PSR, EPD, H-K and IIC models. The most adequate model for the true microhardness of these samples is IIC. In the dielectric results, ε', ε'', tan δ and σac values decreased with the increase of Sm content. Meanwhile, ε', ε' and tan δ values decreased exponentially with the increase of frequency, while σac increased along with the increase of frequency. Consequently, the Sm doped ZnO samples are potential candidates to be used in high frequency devices and dielectric applications [71, 72]. The values of ε' and σac decreased as the Sm doping content increased at all temperatures, where they attained the highest values at 773 K.


