
Abstract
We present a comparative analysis of the structural and optical properties of electrosynthesized PQDs, a new class of size-tunable luminescent materials and their nitrogen doped counter parts(NPQDs). Nitrogen doping onto phopshorene lattice could be realized in situ at room temperature using either nitrogen containing electrolyte and/or supporting electrolyte in the solution. An increased quantum efficiency as well as redox behavior has been observed for PQDs upon nitrogen doping and a critical analysis of the effect of nitrogen on the structural, optical and electrochemical properties of PQDs suggests several potential benefits of applications ranging from electrocatalysts and molecular electronics to different types of sensors and bioimaging.
Export citation and abstract BibTeX RIS

Original content from this work may be used under the terms of the Creative Commons Attribution 4.0 licence. Any further distribution of this work must maintain attribution to the author(s) and the title of the work, journal citation and DOI.
1. Introduction
Phosphorene Quantum Dots (PQDs),which are quasi zero dimensional nanostructures of individual or few layer black phosphorus (BP) have received immense scientific acclaim in view of a new class of luminescent materials due to its unique structure and intrinsic semiconducting properties [1]. For example, the band gap could be modulated up to 2 eV depending on the number of layers although the bulk band gap of black phosphorous is only 0.2 eV. Another defining feature of phosphorene is its band structure asymmetry causing anisotropic effective mass in x and y directions which distinguishes itself from other 2D materials with profound implications for strain based measurements. Nevertheless, practical adaptation of phosphorene for device applications is substantially hampered by degradation under ambient conditions originating from the affinity of lone pairs on phosphorene towards oxygen causing destructive changes in their electronic properties[2]. Accordingly, several strategies such as Al2O3 passivation, capping with other 2D materials and surface modification with organic molecules have been developed as a result of the search of efficient protective modification procedures [3]. Alternatively, band gap variants of PQDs can be obtained by doping either isovalent or aliovalent heteroatoms in phosphorene lattice. However, isovalent heteroatom doping provides more beneficial effects as it does not affect the size and thickness of phosphorene to a great extent. Further, doping could enhance the carrier mobility and air stability of devices like transistors as observed in nitrogen doped graphene [4]. Importantly, doping can also improve oxidation resistance and exhibit novel physicochemical properties which could be advantageous for applications such as electrocatalysis, optoelectronics, bioimaging and energy storage due to expected faster heterogeneous electron transfer than its pristine counterpart. Accordingly, there are reports exemplifying p- or n-type heteroatom doping in graphene quantum dots effected with nitrogen, fluorine, boron, sulfur, etc. [5–7]. However, there has been limited research on heteroatom doped phosphorene except a few theoretical studies that discuss the implicit changes in atomic and electronic structure upon doping and their potential applications in Li-air batteries [8, 9].
While there are no experimental reports on heteroatom doped PQDs, we recently demonstrated a room-temperature electrochemical approach to obtain nitrogen doped PQDs (NPQDs) [10]. An electrochemical in situ pathway to achieve heteroatom doping in phosphorene has all beneficial effects such as room temperature doping retaining all morphological features, precise regulation of amount to be doped, possibility of co-doping and compatibility with a variety of solvents. Moreover, electrochemical techniques offer several advantages such as size-tunability, especially in a potentiostatic mode and flexibility in choosing solvents and supporting electrolytes according to the desired product [11]. Since the transformation is realized at room temperature, morphological damages could be minimized. However, one limitation of this approach is poor yield, which can be overcome by employing large area electrode, increasing the reaction time etc. Accordingly, we reported a cathodic exfoliation of BP in a non-aqueous medium as a promising approach for pristine PQDs and NPQDs synthesis [10, 12]. Oxidation induced edge state functionalization by P = O, P–O–P functional groups can be minimized by a reductive cleavage of P-P bonds (bond energy 200 kJ mol−1), enabling a rapid reconstruction of the edge states using solvation energy. Pristine PQDs has been electrosynthesized using a non-aqueous medium such as propylene carbonate where we noticed the evidences of unsaturated P edges upon electrochemical exfoliation of BP. Subsequently, we customized the electrolyte as acetonitrile containing tetraethylammonium tetrafluoroborate to realize simultaneous exfoliation and nitrogen doping to obtain NPQDs from BP. Interestingly, the nitrogen content could be tuned by varying the choice of electrolyte and the supporting electrolyte. Nonetheless, a thorough fundamental understanding on the effects of nitrogen doping on the physicochemical properties of phosphorene is a sine qua non to predict the tangible benefits for several applications like electrocatalysis and energy storage as suggested by theoretical studies. It is therefore worthwhile to compare and contrast the physicochemical properties of PQDs and NPQDs in the absence of any such efforts till date. In the light of all these observations, we present the comparative analysis of PQDs and NPQDs based on the results from a series of characterization techniques to account on the effect of nitrogen doping.
2. Methods
2.1. Electrosynthesis of PQDs and NPQDs
PQDs and NPQDs were synthesized from BP according to our previously reported single step electrochemical method as schematically represented in figure 1 [10, 12]. Briefly, 50 μl of 2.0 mg ml−1 dispersion of BP (ACS materials) in deaerated ethanol was drop-dried on a 3 mm glassy carbon working electrode (GCE). The electrochemical exfoliation was carried out in a three-electrode cell where the BP coated GCE was the working electrode, Pt wire as the quasi-reference electrode and Pt mesh as the counter electrode. To obtain PQDs, lithium perchlorate (LiClO4, 0.1 wt %) in Argon-saturated propylene carbonate was used as the electrolyte, while for NPQDs tetraethylammonium tetrafluoroborate (0.1 wt %) in acetonitrile was used. An electric field of strength 5.2 × 10⁸ V m−1 was applied to BP. The product was then separated from the electrolyte by centrifugation. The nitrogen content in NPQDs were analysed using X-ray Photoelectron Spectroscopy which is 3.8 at% [10]. A systematic approach to vary the nitrogen content by controlling the electric field and time was not very successful to yield effective composition modulation with similar lateral sizes or number of layers.
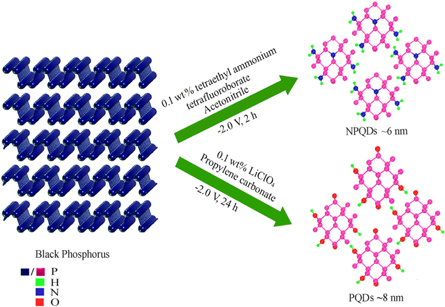
Figure 1. Schematic representation of electrosynthesis of PQDs and NPQDs from BP.
Download figure:
Standard image High-resolution image3. Results and discussion
3.1. Effect of nitrogen doping on crystal structure
Figure 2 illustrates a comparison of the transmission electron micrographs (TEM) of electrosynthesized PQDs and NPQDs. The average diameter of PQDs is 8 nm (figure 2(a)) and they are crystalline (figure 2(b)) as evident from the High-Resolution Transmission Electron Micrograph (HR-TEM) showing lattice fringes with a spacing of 0.23 nm which can be assigned to (041) plane of orthorhombic BP as per the refined powder diffraction data of BP [13]. The PQDs also exhibit a fair particle size distribution as represented by the particle size histogram (inset of figure 2(a)). A slightly smaller average size is noticed for NPQDs (figure 2(c)) which is ∼6 nm. NPQDs also exhibit a fair distribution (inset of figure 2(c)) and crystallinity with an ordered lattice fringes corresponding to the orthogonally symmetric structure of BP as observed from the HR-TEM (figure 2(d)). From the aerial view, a P-P distances of 0.16 and 0.23 nm are calculated from x and z directions, respectively. In principle, the inter planar distances calculated from the lattice fringes observed in HR-TEM of a phosphorene lattice should be 0.17 nm and 0.22 nm for x and z direction, respectively. However, we noticed a slight increment along the z direction confirming the atomic reconstruction underwent by phosphorene lattice during transformation to NPQDs.

Figure 2. Comparative TEM of electrosynthesized PQDs and NPQDs.(a) PQDs (inset: particle size distribution histogram) (b) HR-TEM of PQDs showing lattice fringes (c) NPQDs (inset: particle size distribution histogram) (d) HR-TEM of NPQDs showing lattice fringes.
Download figure:
Standard image High-resolution imageFurther the crystal structure of PQDs and NPQDs were compared by X-Ray Diffraction (XRD) analysis. Accordingly, figure 3 shows the comparative XRD patterns of PQDs and NPQDs. Many of the diffraction pattern intensities are significantly diminished for both PQDs and NPQDs due to reduced layer thickness and hence van der Waals interactions. For PQDs, a remarkable increase in the in-plane lattice spacing from 0.26 nm (for BP) to 0.28 nm corresponding to (040) facet is observed presumably stemming from the atomic reconstructions in PQDs to maintain stability. On the contrary, for NPQDs, an increase in interlayer distance from 0.53 nm (for BP) to 0.63 nm is noticed corresponding to the shift of reflection from this (020) plane possibly due to the incorporation of functional moieties such as P-NH2. Moreover a slight lattice contraction is also noticed by the shift of reflection from (040) to a slightly higher 2θ value. This can be attributed the electronegativity effect of nitrogen atoms.

Figure 3. Comparative XRD patterns of PQDs and NPQDs showing variations in the in-plane and interlayer distances upon nitrogen doping.
Download figure:
Standard image High-resolution imageEffect of nitrogen doping on the crystal structure of phosphorene is further analysed by Raman spectroscopy. Accordingly, figure 4 shows comparative Raman spectra of PQDs and NPQDs obtained using a 514 nm excitation laser. Three characteristic A1g, B2g, and A2g vibrational modes are observed for BP at wavenumbers of ∼361.8, ∼437.98, and ∼465.19 cm−1 respectively. These can be correspondingly assigned to out-of-plane and in-plane vibration (B2g, and A2g) of P atoms respectively. As evident from the spectra, the first order Raman mode A1g shows a blue shift of 17 cm−1, while the intensity of B2g and A2g diminished tremendously. The morphological transformation affects the vibrations of P atoms apart from the reduced van der Waals interactions. Moreover peak broadening is also observed which can be attributed to the size effects. On the other hand, upon nitrogen doping, A1g, B2g, and A2g vibrational modes exhibit a red-shift of 9 cm−1, 18 cm−1 and 8.3 cm−1 respectively featuring a phonon softening [14]. It is also important to recall that Raman spectroscopic analysis not only involves one phonon process known as first-order Raman scattering but also higher-order processes. For example, an electron-phonon interaction driven by an impurity, a localized defect, or an edge can generate phonon-defect modes known as D modes. Thanks to these D modes which are helpful in interpreting carrier mobility, level of doping, defects and phonon dispersion [15]. Accordingly, two such phonon-defect modes D1 and D2 are identified in the A1g and A2g regions, respectively for NPQDs. These modes evolve as red shifted peaks with decrease in sample thickness. Moreover, earlier studies on phonon dispersion and momentum histogram of BP suggest that the origin of red-shifted characteristics relative to the central peaks is from contributions in the zigzag direction, while the blue shifted characteristics evolve from the armchair direction [15]. This observation is essentially due to the in-plane anisotropy of BP. Therefore NPQDs are more likely to be dominated by zigzag edges while the blue shift observed for PQDs are presumably due to armchair edges. The D peaks also give clues about degradation dynamics. For example, the D2 mode appears as a result of exposure to light and humidity [15]. All these observations suggest a phonon-defect scattering which is essentially due to the effect of applied electric field and doping. However, an in-depth understanding of origin of D modes can be only obtained from samples deliberately exposed to degradation inducing conditions.

Figure 4. Raman Spectra of PQDs and NPQDs in comparison with BP. A significant blue shift in the A1g mode of PQDs suggests a considerable decrease in number of layers while NPQDs exhibit a red shift with the emergence of phonon-defect modes.
Download figure:
Standard image High-resolution imageThe AFM topographic images along with their height profiles. PQDs show ∼3–4 layers based on an interlayer distance of 0.53 while lesser number of layers are noticed for NPQDs (∼1–2 layers). This however, does not seem to have any special significance with respect to doping as it could be due to the size differences related to the preparation procedure.
3.2. Effect of nitrogen doping on optical properties
The optical properties of PQDs and NPQDs were probed by UV-Visible and Photoluminescence (PL) spectroscopy and Time-Correlated Single Photon Counting (TCSPS) measurements. Consequently, figure 5(a) shows superimposed UV-Visible spectra of PQDs and NPQDs. Both PQDs and NPQDs exhibit broad UV absorption between 300–400 nm corresponding to optical transition (direct band gap) between the valence band and conduction band which is a characteristic of luminophores. This absorbance is responsible for the blue luminescence of PQDs and NPQDs. A slight red shift is noticed in the absorption of NPQDs. The absorption in the UV spectra is further corroborated with PL measurements. Accordingly figure 5(b) shows the superimposed PL emission spectra of PQDs and NPQDs. As evident from the spectra, three peaks at 406, 429 and 457 nm are exhibited by PQDs (Excitation wavelength = 350 nm). The three emission peaks in the PL spectrum can be assigned to the Highest Occupied Molecular Orbital (HOMO) - Lowest Unoccupied Molecular Orbital (LUMO) electronic transitions among the energy levels of these luminophores (functional groups) on PQDs. The strongest emission is observed at 429 nm corresponding to blue luminescence. A stoke shift of 79 nm is calculated for this transition. This stoke shift is attributed to the non-radiative decay processes occurring at the various energy levels of excited state. Notably, a similar energy difference is noticed between the peaks.
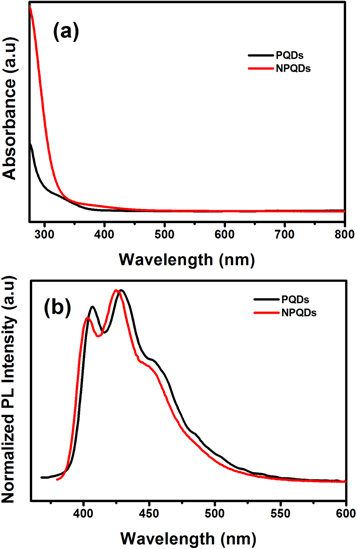
Figure 5. Optical properties of PQDs and NPQDs. (a) UV-Visible Spectra (b) PL Spectra recorded at 350 (PQDs) and 370 nm (NPQDs) excitation wavelengths.
Download figure:
Standard image High-resolution imagePL spectrum of NPQDs also exhibits three peaks corresponding to the wavelength of blue region of the electromagnetic spectrum. The strongest PL emission is observed at 424 nm for an excitation wavelength of 360 nm. A shorter Stokes shift is noticed (64 nm) upon doping. More significantly, this spectrum exhibits a higher quantum efficiency of 88.7% (using quinine sulfate as reference) which is greater than that observed for pristine PQDs ( 83%). To account for this higher quantum efficiency of NPQDs, we carried out TCSPS measurement at 360 nm excitation wavelength, monitoring the emission at 420 nm. The comparative fluorescence decay profile is shown in figure 6. As evident from the decay profile, NPQDs shows a single exponential decay unlike that for pristine PQDs which exhibits a bi-exponential decay. Accordingly, the average lifetime (τav), radiative and non-radiative decay constants (kr and knr) are calculated. The average lifetime of NPQDs is 874 ps which is lesser than that of pristine PQDs (956 ps). The kr and knr are 10 × 108 and 1.3 × 10⁸ s−1, respectively, showing a significant enhancement in the radiative recombination rate and decrease in the non-radiative recombination rate after nitrogen doping. The higher rate of radiative recombination suggests less trap states. The recombination in the trap states will be non-radiative by nature (probability of electron-hole recombination without emitting photons is high in trap states) and hence a decreased non-radiative decay constant underscores decreased defects upon nitrogen doping in PQDs.

Figure 6. Comparative fluorescence decay profiles of PQDs and NPQDs recorded at an excitation wavelength of 360 nm.
Download figure:
Standard image High-resolution imageThe luminophores present in PQDs and NPQDs are distinguished by Fourier Transform Infrared Spectroscopy (FT-IR). Accordingly, figure 7 shows the comparative FT-IR spectra of PQDs and NPQDs. Both PQDs and NPQDs contain P = O and P-OH functional groups. Notably, P-NH2 stretching and P-NH bending vibrational modes around 3400 and 1600 cm−1 are noticed for NPQDs. A peak corresponding is P-N stretching vibration also appears at lower wavenumber region of the spectrum, which could be specially relevant to compare PQDs of various surface functionalization.

Figure 7. Comparative FT-IR spectroscopic analysis of electrosynthesized PQDs and NPQDs where NPQDs are characterised by nitrogen containing functional groups.
Download figure:
Standard image High-resolution image3.3. Effect of nitrogen doping on electrochemical properties.
The effect of nitrogen doping on PQDs is probed by the changes in the cyclic voltammograms (CV) of PQDs and NPQDs. Accordingly, figure 8 represents the superimposed solution CVs of PQDs and NPQDs obtained at 100 mVs−1 on a glassy carbon electrode. A comparison of CVs of PQDs in a wide potential window of −2.5 V to +2.5 V in de-aerated propylene carbonate containing 0.1 wt % of LiClO4 as the supporting electrolyte reveals several subtle differences. Apparently, two distinct redox couple could be identified for NPQDs although the extent of reversibility is very weak for PQDs with strong reduction peaks at −0.80 V and −2.0 V respectively. The electrode reactions of elemental phosphorus could be either reversible or irreversible in polar aprotic solvents [16]. The chemistry of BP can be looked at as continuous layers of P4 molecules in which every P atom forms three bonds with its neighbouring P atoms [17]. Upon electroreduction, P-P bond cleaves and a reversible radical phosphido anion [P4]·− is likely to be generated via a one electron transfer (peak at −2.0 V). A broad anodic peak around −0.2 V is also noticed for PQDs. Interestingly this peak became prominent as a function of cycle number which indicates some surface reactions such as polymerisation possible at the electrode. The solution CV of NPQDs in a potential range of −3.0 to +3.0 V in acetonitrile containing 0.1 wt% tetraethylammonium tetrafluoroborate also follow the peak features of PQDs but with more kinetic reversibility. Interestingly an improved current density is also noticed which may be attributed to the increased conductivity up on doping. More studies using are in progress to obtain a clear understanding of the intermediates for electrochemical reduction and mechanism using in situ Electron Paramagnetic Resonance (EPR) Spectroscopy measurements. A comparison of the main properties of both PQDs and NPQDS is given in table 1.

Figure 8. Comparative Cyclic Voltammograms of PQDs and NPQDs at 100 mV s−1 on a glassy carbon electrode.
Download figure:
Standard image High-resolution image
Table 1. A comparison of the main attributes of PQDs and NPQDs obtained from (although several experiments were carried out more stringent size control could not be accomplished).
| Properties | PQDs | NPQDs |
|---|---|---|
| Interlayer distance | 0.53 nm | 0.63 nm |
| Number of layers | ∼3–4 | ∼1–2 |
| In-plane P-P nond length | Slightly elongated | Slightly contracted |
| Raman spectral features | Blue shift from BP | Red shift with emergence of D modes |
| PL Quantum Efficiency | 83% | 88% |
| PL life time | 956 ps | 875 ps |
| Radiative decay constant | 8.6 × 10⁸ s−1 | 10 × 108 s−1 |
| Non-radiative decay contant | 1.77 × 10⁸ s−1 | 1.0 × 10⁸ s−1 |
4. Conculsion
In conclusion, pristine and nitrogen doped phosphorene quantum dots were prepared at room temperature to investigate the effect of nitrogen doping on the structural,optical and electrochemical properties of the electrosynthesized PQDs. The method of doping while preparing at room temeprature is generic for many two-dimensional materials and hence the results of these investigations could be useful to open up new opportunities for making interesting van der Waals heterostructutres.
Acknowledgments
MOV, SA and VKP thank Prof.Amitava Patra IACS Kolkata for the life time measurements. MOV acknowledges CSIR for Senior Research Fellowship and VKP acknowleges Indo-US Science and Technology Forum for JC-071/2017 'LITE UP 2D' project.