
Abstract
Zn1−xCrxAl2O4 (x = 0, 0.01, 0.03, 0.05 and 0.07) nanoparticles were synthesized by hydrothermal method and heat treatment technology, and the effects of Chromium doping ratios on the microstructure, morphology, element distribution, binding energy and optical property of the samples were characterized by x-ray diffraction (XRD), scanning electron microscopy (SEM), high-resolution transmission electron microscopy (HRTEM), x-ray energy dispersive spectroscopy (XEDS), x-ray photoemission spectroscopy (XPS), ultraviolet-visible (UV–vis) spectroscopy, photoluminescence spectra (PL) and fourier transform infrared spectroscopy (FT-IR). The experimental results show that Zn1−xCrxAl2O4 nanoparticles possess cubic spinel structure without other impurity phases. The average crystallite size decrease and the lattice parameter increase with the increase of Cr doping concentration. The morphology of the samples exhibits irregular spherical or ellipsoid particles with uniform particle size. XEDS spectra display Cr3+ successfully used as doping agent replaced Zn2+ and entered ZnAl2O4 matrix. XPS spectra demonstrate that the doped Cr ions mainly occupy the tetrahedral sites in Zn0.95Cr0.05Al2O4 sample. UV–vis spectra indicate the band gap of the doped sample decrease and exhibit red shift with the increase of Cr ion concentration. The intensity of FT-IR spectra for Zn1−xCrxAl2O4 samples decreases slowly and occurs red shift. PL spectra show the intensity decrease and occur luminescence quenching phenomenon for Cr doped sample.
Export citation and abstract BibTeX RIS

Original content from this work may be used under the terms of the Creative Commons Attribution 4.0 licence. Any further distribution of this work must maintain attribution to the author(s) and the title of the work, journal citation and DOI.
1. Introduction
Spinel structure metal-oxide (AB2O4) is a kind of important functional semiconductor materials, which have attracted extensive attention due to its unique crystal structure, special properties and broad application prospect in the fields, such as catalysts, catalytic carriers, high-temperature ceramics, optical materials, sensors and dielectric materials [1–7], etc. In the formula AB2O4, A represents the tetrahedral position occupied by bivalent metal cations, and the tetrahedral gap formed by four oxygen ions, while B position represents the octahedral position occupied by the trivalent metal cations, and the octahedral void formed by six oxygen ions [8–10]. According to the metal cation distribution, the general chemical formula of spinel structure can be written as (A1−xBx)[AxB2-x]O4, where ()represents tetrahedral position, [] represents octahedral position, and x is the inversion coefficient. When x = 0, AB2O4 is orthospinel structure; x = 1, AB2O4 is anti-spinel structure, while 0 < x < 1, AB2O4 is the mixed spinel structure [11–13].
Among the spinel structure metal-oxide, ZnAl2O4 belonging to Fd3m space group with cubic structure and wide band gap energy (3.8 eV), ZnAl2O4 have attracted much attention due to their high temperature stability, high mechanical strength, low surface acidity, good cationic dispersion, excellent optical and dielectric properties [14–16]. The crystal structure and band structure of metal oxide semiconductors can be adjusted by modification of precious metals, composite with metal oxide semiconductor or carbon materials, metal ion doping and metal ion doping and synthesis of nano semiconductor materials [17–20]. As the acceptor or donor, the hole or electron is used to regulate the carrier type and concentration of the carrier, thus effectively controlling the electrical, magnetic and optical properties of new semiconductor materials [21–24]. In recent years, ZnAl2O4 was selected as the semiconductor matrix, and its physical properties were adjusted through transition metal ion doping to improve the added value of spinel structure nanometer semiconductor materials [25, 26]. For instance, Zhu et al prepared Ag-ZnAl2O4 nanorods photocatalyst by hydrothermal method, Because the rod-like structure with porous and has a high specific surface area, found that the photocatalytic activity of ag-supported ZnAl2O4 to gas-phase toluene was higher than that of other prepared samples and commercial P25 [27]. Qin et al reported Er3+ doped ZnO-ZnAl2O4 polyphase oxide prepared by co-precipitation method, compared with undoped ZnO-ZnAl2O4, the ultraviolet catalytic degradation activity of methyl orange was enhanced [28]. Wu, etc synthesized spinel structure Zn1−xNixAl2O4 nanocrystalline by sol-gel method, found the band gap decreases of the samples with the increase of Ni concentration due to the introduction of impurity level between the conduction band and valence band, and occurs sparked the photoluminescence quenching phenomenon [29]. Anand et al found that Ni doped ZnAl2O4 nanoparticles possess superparamagnetic, while undoped ZnAl2O4 possess diamagnetism [30]. Wu, etc reported the average crystallite size of Co-doped ZnAl2O4 nanoparticles decrease with the increase of Co doping concentration, and the PL spectra exhibit red-shift [31].
The crystal structure and band structure of semiconductor have been studied by controlling the preparation process, changing the doped elements and doping amount, and the physical properties of spinel structure metal-oxide are closely related to the synthesis route, annealing temperature and impurity content [32–34]. Compared with other traditional methods, hydrothermal method possesses more advantages due to its low expensive, the interaction of solvent and reactants at the molecular level, and generates new substances in the aqueous solution under high temperature and high-pressure condition, in addition, the products synthesized by hydrothermal method exhibit single morphology, uniform particle size and good dispersion [9, 24]. Many studies have been made on the properties of transition metal-doped spinel structure metal oxides, however, The purity of ZnAl2O4 nanoparticles prepared by hydrothermal method is not high, and the intermediate product needs further heat treatment, to our knowledge, few studies have been performed on the structural properties of Cr doped ZnAl2O4 nanoparticles and its correlation with optical properties.
In this paper, Zn1−xCrxAl2O4 (x = 0, 0.01, 0.03, 0.05 and 0.07) were synthesized by hydrothermal method and heat treatment technology, and the effects of Cr-doping content on the crystal structure and optical properties of the samples were characterized by x-ray diffraction (XRD), high-resolution transmission electron microscopy (HRTEM), energy dispersive x-ray spectroscopy (EDX), fourier transform infrared spectroscopy (FTIR), x-ray photoemission spectroscopy (XPS), ultraviolet-visible (UV–vis) spectroscopy and photoluminescence spectra (PL), respectively.
2. Experimental
2.1. Preparation of Zn1−xCrxAl2O4 nanoparticles
All chemicals used in this work were of analytical grade and were used without any further purification. Zn1−xCrxAl2O4 nanopowders were prepared via hydrothermal method, as shown in figure 1. In a typical procedure, according to the chemical formula Zn1−xCrxAl2O4 (x = 0, 0.01, 0.03, 0.05 and 0.07) and the molar ratio of metal cations Zn:Cr:Al = (1−x):x:2, weighed stoichiometric amounts of Zn(NO3)2·6H2O, Al(NO3)3·9H2O and CrCl3·6H2O used as raw materials, dissolved in distilled water to obtain mixed metal salt solution, and evenly dispersed by magnetic stirring at room temperature. Meanwhile, dropped NaOH solution into the above solution to adjust the pH value of the mixed solution to be 12, subsequently a certain amount of CTAB slowly added to the above mixed solution, all the above processes are carried out under constant magnetic stirring. Then the resultant mixture was transferred to and sealed a 100 ml Teflon-lined stainless-steel autoclave and kept at 200 °C for 24 h. After the reaction was completed, the autoclave was naturally cooled down to room temperature. Thereafter, the resulting precipitate was separated centrifugally and washed several times with distilled water and absolute alcohol to remove excess surfactants and impurities, respectively, the precipitate was dried in a vacuum drying oven at 60 °C for 12 h to obtain the precursors. Finally, the Zn1−xCrxAl2O4 sample can be obtained by heat treatment the precursors at sintering temperature of 700 °C for 6 h.
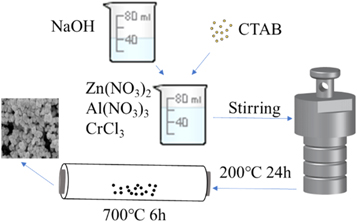
Figure 1. Schematic illustration of preparing Zn1−xCrxAl2O4 nanoparticles.
Download figure:
Standard image High-resolution image2.2. Characterization
The crystal phases of the samples were identified by x-ray powder diffraction (Rigaku corporation, Japan, D/Max-2400) using Cu Kα radiation (λ = 0.15406 nm) operating at 40 kV and 30 mA in the diffraction angle range of 20–80°with scanning rate 0.005 ° s−1 and step size 0.02°. The morphology and microstructure were characterized by scanning electron microscope (SEM, JEOL JSM-6701F) and high-resolution transmission electron microscopy (HRTEM, JEM-2010). The chemical composition analysis of the products was measured by x-ray energy dispersive spectroscopy (XEDS). The optical absorption and bandgap energy of the samples were characterized by ultraviolet-visible (UV–vis) spectrophotometer (PERSEE TU-1901) using BaSO4 as reference. Fourier transform infrared spectroscopy (FT-IR) analysis were performed by Nexus 670 FT-IR spectrophotometer in the range of 4000–500 cm−1 using KBr powder. The composition and chemical states of elements were studied by x-ray photoelectron spectroscopy (XPS) measurement was carried out on a PHI-5702 multi-functional x-ray photoelectron spectrometer. The photoluminescence (PL) spectra were recorded by PerkinElmer spectrophotometer (LS-55) with an excitation wavelength of 320 nm.
3. Results and discussion
3.1. Structural characterization
Figure 2 show the XRD patterns of Zn1−xCrxAl2O4 (x = 0, 0.01, 0.03, 0.05 and 0.07) samples. It is clearly observed from figure 2 that the diffraction peaks of pure ZnAl2O4 at 2θ = 31.5°, 36.8°, 44.9°, 47.3°, 56.2°, 58.1°, 65.3°, 73.6° and 77.3° are well indexed to (220), (311), (400), (331), (422), (511), (440), (620) and (533) crystal planes of single-phase ZnAl2O4 cubic spinel structure with lattice parameters a = b = c = 0.8048 nm, which is in accordance with that of the standard spectrum (JCPDS Card No. 05-0669). In addition, there is no extra diffraction peaks of other impurities such as Cr clusters or Cr oxides are detected within the detection limit of XRD, ZnAl2O4 is the only phase detected in all the heated samples. which indicating that all Cr ions are successfully incorporated into Zn2+ ions sites without changing the parent ZnAl2O4 structure, and the purity of the product is relatively high.

Figure 2. XRD patterns of Zn1−xCrxAl2O4 samples.
Download figure:
Standard image High-resolution imageThe crystallite size of the samples is calculated using the most intense diffraction peak (311) by means of Scherrer formula:  where D is the crystallite size, K = 0.9 is the Scherrer constant, λ = 1.54056 Å is the x-ray wavelength, B is the corrected full width at maximum and θ is the diffraction angle. The average crystallite size of the samples was summarized in table 1. It is clear that that the crystallite size gradually decreases with the increase of Cr doping concentration, indicating that Cr doping have a regulating effect on the crystallite size.
Table 1. XRD results of Zn1−xCrxAl2O4 samples.
| Sample | 2θ(°) | dhkl/nm | a = b = c(nm) | D/nm |
|---|---|---|---|---|
| x = 0 | 36.88 | 0.2435 | 0.8076 | 24 |
| x = 0.01 | 36.89 | 0.2434 | 0.8074 | 22 |
| x = 0.03 | 36.85 | 0.2437 | 0.8082 | 21 |
| x = 0.05 | 36.81 | 0.2439 | 0.8091 | 20 |
| x = 0.07 | 36.79 | 0.2440 | 0.8095 | 21 |
The interplanar crystal spacing and the lattice constants of the sample can be obtained according to the crystalographic calculation formula and the Bragg formula, the diffraction angle, lattice parameters, interplanar crystal spacing and crystallite size of (311) peak for Zn1−xCrxAl2O4 samples as shown in table 1. It is obviously that the diffraction angle of the (311) peak for doped samples is slightly shifted towards lower angle with the increase of Cr doping content, the lattice parameters and interplanar crystal spacing of doped samples decrease with Cr doped content increase. The lattice constant is distorted, and exhibit lattice expansion. which may be attributed to the incorporation of Cr ions are doped into ZnAl2O4 host lattice, and ionic radius of Cr3+ (0.63 Å) smaller than Zn2+ (0.74 Å), which eventually led to the lattice distortion. These results show that the lattice parameters and particle size of the sample can be controlled by doping, and then the microstructure and physical properties of the sample can be controlled and adjusted.
3.2. Morphological studies
The typical SEM images of pure ZnAl2O4 and Zn0.95Cr0.05Al2O4 sample as shown in figure 3. It is obviously that the morphology of pure ZnAl2O4 is mainly irregular spherical or ellipsoid particles with average particle size below 50 nm. Due to the existence of van der Waals force, coulomb force or chemical bond cooperation between nanoparticles, there is a certain degree of agglomeration phenomenon. compared with pure samples, the morphologies of pure ZnAl2O4 and doped ZnAl2O4 samples are basically the same, but Cr doped sample show a tendency to possess smaller particle size and more uniform size distribution, and the doped ions do not have significant effect on the morphology of the products.

Figure 3. SEM images of (a)pure ZnAl2O4 and (b)Zn0.95Cr0.05Al2O4 sample.
Download figure:
Standard image High-resolution imageThe microstructure and morphology of the as-prepared samples were performed by HRTEM, figure 4(a) shows a representative HRTEM images of Zn0.95Cr0.05Al2O4, it can be seen that the morphology of Zn0.95Cr0.05Al2O4 sample is mainly irregular ellipsoid particles with rough surface and irregular edges. Figure 4(b) represents the local magnification of Zn0.95Cr0.05Al2O4 sample, it clearly find the orderly and flawless crystal plane stripes, and the interplanar spacing about 0.284 nm, which corresponds to the (311) crystal planes of cubic spinel structure ZnAl2O4, indicating that Zn0.95Cr0.05Al2O4 are well-crystallized and grew selectively along the (311) crystal planes, which is consistent with the XRD results.

Figure 4. (a)–(b) HRTEM images; (c) SAED pattern and (d) the corresponding particle size distribution of Zn0.95Cr0.05Al2O4.
Download figure:
Standard image High-resolution imageThe selected area electron diffraction (SAED) pattern of Zn0.95Cr0.05Al2O4 as shown in figure 4(c), the SAED pattern of the samples consists of a series of regular concentric rings with different clear and obvious radius due to the sample possess polycrystalline structure. The polycrystalline diffraction rings from inside to outside correspond to the crystal plane of ZnAl2O4 (220), (311), (400), (331), (422), (511) and(440) , respectively. The results of SAED and HRTEM further indicated that the obtained samples with spinel structure, which further indicating that all Cr3+ entered ZnAl2O4 lattice and replaced Zn2+, which is consistent with the XRD analysis results.
Figure 4(d) is the particle size distribution diagram of Zn0.95Cr0.05Al2O4 nanoparticles, it can be seen from the figure that the particle size distribution is relatively uniform, mainly distributed in the range of 10–50 nm, and the average particle size is about 25 nm.
Figure 5 show the XEDS spectra of pure ZnAl2O4 and Zn0.95Cr0.05Al2O4 sample. From the XEDS spectra, it is observed that pure ZnAl2O4 samples mainly exhibit characteristic peaks corresponding to Zn, Al and O elements (figure 5(a)), and the atomic percentage (At %) of Zn/Al/O is found to be 14.27 /25.51/ 60.22%, respectively, as shown in inset of figure 5(a). Figure 5(b) confirms the existence of Cr elements in addition to Zn, Al and O element for Zn0.95Cr0.05Al2O4 sample, while no Cr element was found in the spectrum of pure ZnAl2O4. The quantitative atoms and weight percentages of the associated elements for Zn0.95Cr0.05Al2O4 sample from XEDS results as shown in inset of figure 5(b), reveals Zn/Cr/Al/O atomic percentage is 9.24/3.83/25.74/61.23%, respectively. The Atomic% and Weight of the constituent elements are found to be almost close to the nominal stoichiometry within the range of experimental error. Which also confirmed the presence of Zn, Al, O and Cr elements only and shows the purity of the synthesized materials. XEDS results further verified the conclusion of XRD, indicating that Cr-doped spinel ZnAl2O4 nanocrystalline were successfully prepared by hydrothermal method, and Cr3+ successfully used as doping agent replaced Zn2+ and entered ZnAl2O4 matrix.
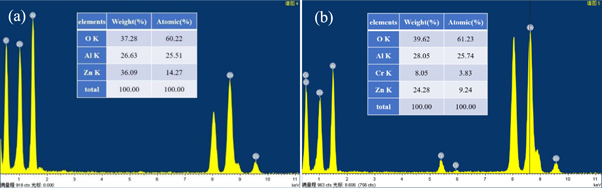
Figure 5. XEDS pattern of ZnAl2O4 and Zn0.95Cr0.05Al2O4 sample.
Download figure:
Standard image High-resolution image3.3. XPS analysis
In order to further determine the composition and element chemical states of Zn1−xCrxAl2O4 samples, the sample was analyzed by x-ray photoelectron spectroscopy (XPS). Figure 6(a) shows the full XPS spectra, revealing the existence of Zn, Al, Cr, O, and C elements in Zn0.95Cr0.05Al2O4 sample. Figures 6(b)–(f) shows illustrates the high resolution XPS spectra of Zn 2p, Al 2p, O 1s, Cr 2p and C 1s, respectively. As seen from figure 6(b), the Zn 2p XPS spectrum shows two sharp peaks at 1022 and 1045 eV correspond to Zn 2p3/2 and Zn 2p1/2, respectively, which indicates that Zn exists in the combination state of +2 valence. The Al 2p peak of the sample appearing around 74.5 eV in figure 6(c). The C 1s XPS spectrum (figure 6(f)) presents the peak at 284.8 eV is attributed to the hydrothermal reaction process without washing clean organic carbon. The O 1s peak about 532 eV shown in figure 6(d) can be fitted into three peaks at about 531.1, 532.5 and 533.7 eV respectively. The main peaks centered at 531.1eV are attributed to the contribution of oxygen in the crystal lattice, which is the energy spectrum of Zn-O and Al-O bonds in ZnAl2O4 lattice. The peak at 532.5 eV is related to the oxygen defect in ZnAl2O4 crystal. which indicates that there are some oxygen vacancies in the sample. While the peak at 533.7 eV is caused by free oxygen on the surface of the sample or oxygen molecules in the pollutant surface of the hydrated oxide (such as adsorbed pollutants, chemical adsorbents and –CO3, H2O and O2, etc) [35]. Figure 6(e) is Cr 2p3/2 XPS spectra, there are two main peaks appeared around 577.1 and 588.5ev, which correspond to the binding energy between Cr 2p3/2 and satellite peaks, respectively. The Cr 2p3/2 XPS spectra can be fitted into three peaks at 576.9, 577.3 and 588.5 eV respectively. Therefore, the peak at 576.9 eV corresponds to the Cr ion of the octahedron, and the peak at 577.3 eV corresponds to the Cr ion of the tetrahedron. The Cr2p XPS results clearly show that the Cr ions mainly occupied the tetrahedral site, while only a small number of Cr ions occupy the octahedral position in Zn0.95Cr0.05Al2O4 sample.
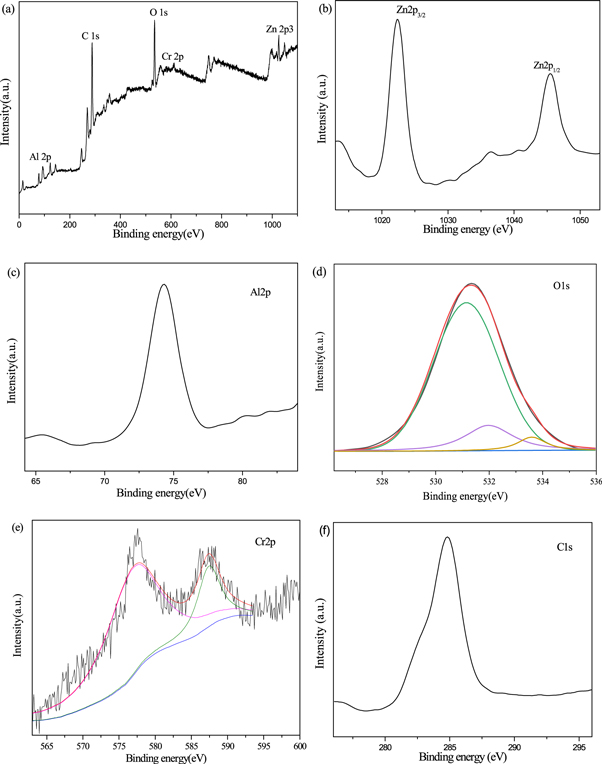
Figure 6. XPS spectrogram of Zn0.95Cu0.05Al2O4: (a) survey spectrum, (b) Zn 2p, (c) Al 2p, (d) O 1s, (e) Cr 2p and (f) C 1s.
Download figure:
Standard image High-resolution image3.4. UV–vis analysis
The UV–vis absorption spectra of Zn1−xCrxAl2O4 samples recorded in range 250–850 nm as depicted in figure 7(a). pure ZnAl2O4 exhibit the absorption peak in the wavelength range of 300–400 nm. Compared to pure ZnAl2O4, doped Zn1−xCrxAl2O4 samples exhibit a broad absorption peak near 500 nm, which is the characteristic peak of Cr3+ in the tetrahedral sites [36], this peak corresponds to the transition from 4A2(F) to 2A1(G) of 3d electron of Cr ion in the field of tetragonal crystal, and this peak causes the sample to appear green-blue [37]. With the increase of Cr concentration, the intensity of the absorption peak gradually increased. The UV–vis absorption spectra are consistent with the fitting results of Cr 2p in XPS, at low concentration, the proportion of Cr ion concentration at the tetrahedral position is relatively low. With the increase of Cr ion concentration, more Cr ions replace Zn ions at the tetrahedral position. Therefore, this will lead to further increase of characteristic peak strength of Cr ion at the tetrahedral position.
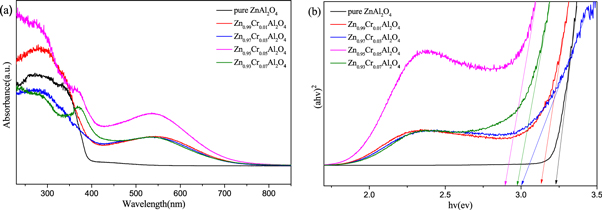
Figure 7. (a) UV–vis absorption spectra and (b) the(αhν)2 versus hν curves of Zn1−xCoxAl2O4 samples.
Download figure:
Standard image High-resolution imageThe band gap Eg of Zn1−xCrxAl2O4 (x = 0, 0.01, 0.03, 0.05 and 0.07) samples can be calculated according to Tauc formula [38]:  The relationship curve between (αhν)2 and hν as shown in figure 7(b) The band gap Eg of Zn1−xCrxAl2O4 (x = 0, 0.01, 0.03, 0.05 and 0.07) samples are 3.13 eV, 2.99 eV, 2.89 eV and 2.97 eV, respectively. The band gap of pure ZnAl2O4 (3.23 ev) is smaller than that of corresponding block ZnAl2O4 (3.8 eV) due to the quantum limiting effect. In addition, with the increase of Cr ion concentration, the band gap of the doped sample decrease and exhibit red shift. The phenomenon of redshift is mainly due to the sp-d interaction between the electrons in the band and the local electrons in the d-shell of the substituted cation, which makes the conduction band potential decrease and the valence band potential increase, thus leading to the decrease of the band gap. Furthermore, the radius of Cr ion (0.063 nm) is less than that of Zn ion (0.074 nm), the band gap of Zn1−xCrxAl2O4 samples from 0 to 7% gradually decreases with the increase of Cr ion concentration.
3.5. FT-IR analysis
FT-IR spectra of Zn1−xCrxAl2O4 (x = 0, 0.01, 0.03, 0.05 and 0.07) samples recorded in the range of 400–4000 cm−1 as shown in figure 8, It can be seen that two obvious absorption peaks appear near 3448 and1635 cm−1 for all samples, FT-IR spectra of pure and doped ZnAl2O4 samples are basically the same. The wide absorption band near 3448.3 cm−1 corresponds to the stretching vibration of O-H group, and the band at 1635 cm−1 can be assigned to the bending vibration of H-O-H group, both of which are related to water molecules on the surface of the sample [26]. In addition, there are three sharp absorption peaks appear near 490 cm−1, 553 and 689 cm−1, which belong to the characteristic peaks of spinel structure ZnAl2O4. Among them, the peak at 553 cm−1 are corresponds to the Zn–O bond asymmetric stretching vibration mode of the tetrahedron positions, while the peak at 490 and 689 cm−1 are attributed to the Al-O bond asymmetric stretching vibration and the bending vibration mode of the octahedron positions, respectively [25]. In addition, with the increase of Cr concentration, the intensity of FT-IR spectra for Zn1−xCrxAl2O4 samples decreases slowly in the range of 400–700 cm−1 region, and the peaks moving toward long wavelength direction and occurs red shift. This is mainly due to the cation distribution in ZnAl2O4 nanocrystals changes significantly when Cr ions entered ZnAl2O4 lattice and replaced Zn ions and the particle size reaches the nanoscale scale, some Al3+ enters the A position of tetrahedron, and Cr3+ enters the B position of octahedron, which leads to the generation of ion logarithm of super exchange between A and B [10], and introduce new interstitial structural defects in spinel structure, the new introduced structural defects will lead to redshift of the spectra, which is consistent with the UV–vis analysis results.
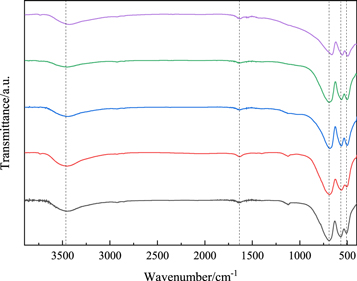
Figure 8. FT-IR spectra of Zn1−xCrxAl2O4 samples.
Download figure:
Standard image High-resolution image3.6. PL analysis
Figure 9 shows PL spectra of Zn1−xCrxAl2O4 (x = 0, 0.01, 0.03, 0.05 and 0.07) samples with excitation wavelength of 300 nm at room temperature. It was observed that Zn1−xCrxAl2O4samples exhibited three emission spectra at 406, 465, and 576 nm, respectively. Pure ZnAl2O4 exhibit a broad blue emission band centered at 406 nm (3.05 eV), which can be attributed to excitonic NBE emission, and the emission energy is close to the band gap of ZnAl2O4 (3.08 eV), indicating the sample possesses better crystallization. the blue emission peak centered at 465 nm for the samples is associated with oxygen vacancy. Compared with pure ZnAl2O4, the blue peak of doped sample moves in the direction of long wave and occurs red shift, which may be due to the substitution of Zn2+ ions by Cr3+ ions in ZnAl2O4 lattice will introduce new impurity levels mainly between O vacancy level and valence band, leading to slight lattice distortion, resulting in energy change during energy level transition. In addition, the photoluminescence peak is attributed to the recombination of electron-hole related to intrinsic defects, the PL intensity of the doped sample decrease sharply and occur quenching phenomenon with the increase of Cr ion concentration. This is mainly due to the decrease of zinc gap and the increase of Cr3+ concentration after the replacement of Zn2+ by Cr3+, the octahedral and tetrahedral gap formed by O atom accumulation are occupied by metal ions respectively, forming a compact structure, which is likely to form Zn, Al, O and other interstitial structural defects in spinel structure, photoelectron preferentially occupies the trap center caused by Cr3+, leading to luminescence annihilation.
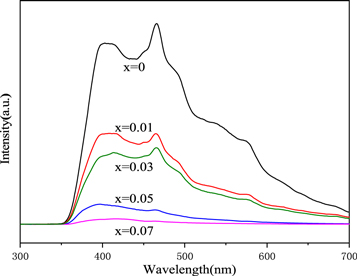
Figure 9. PL spectra of Zn1−xCrxAl2O4 samples.
Download figure:
Standard image High-resolution image3.7. CIE analysis
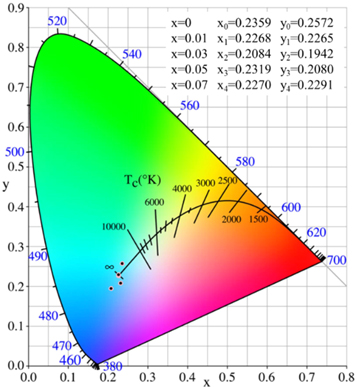
Figure 10 shows the Commission International DeI'Eclairage (CIE) chromaticity diagram of Zn1−xCrxAl2O4 samples, which are calculated via fluorescence spectra under the excitation wave of 320 nm. The CIE coordinates values of Zn1−xCrxAl2O4 (x = 0, 0.01, 0.03, 0.05 and 0.07) nanoparticle are shown inset of figure 7, which are located in green-blue region. It can be seen from the chromaticity diagram, the chromaticity distribution of the sample can be controlled by controlling the doping concentration of the sample, and the peak decreases regularly with the increase of the doping concentration, demonstrating Zn1−xCrxAl2O4 nanoparticle exhibit excellent light-emitting ability.
Figure 10. CIE color coordinate diagram of Zn1−xCrxAl2O4 samples.
Download figure:
Standard image High-resolution image
4. Conclusion
Zn1−xCrxAl2O4 nanoparticles with different doping ratios were successfully synthesized by hydrothermal method and heat treatment technology. The samples prepared by this method possess single phase cubic spinel structure, no other impurity phases were observed. The average crystallite size decrease and the lattice parameters increase with the increase of Cr doping concentration. The morphology of the samples exhibits irregular spherical or ellipsoid particles with uniform particle size. XEDS spectra display Cr3+ successfully used as doping agent replaced Zn2+ and entered ZnAl2O4 matrix. XPS spectra demonstrate that the doped Cr ions mainly occupy the tetrahedral sites in Zn0.95Cr0.05Al2O4 sample. UV–vis spectra indicate with the increase of Cr ion concentration, the band gap of the doped sample decrease and exhibit red shift. The intensity of FT-IR spectra for Zn1−xCrxAl2O4 samples decreases slowly in the range of 400–700 cm−1 and occurs red shift. PL spectra show the intensity decrease and occur quenching phenomenon for Cr doped sample. CIE indicate that the luminescent color can be adjusted by controlling Cr doping concentration.
Acknowledgments
This work was supported by the National Natural Science Foundation of China (51261015), Natural Science Foundation of Gansu Province, China (1308RJZA238) and HongLiu First-Class Disciplines Development Program of Lanzhou University of Technology.