
Abstract
Highly Crystalline pure and Ag-doped ZnO nanoparticles were prepared using the inexpensive sol-gel synthesis method with the stimulation of transition metal ion surfactant. The prepared pure and Ag-doped (Silver doped) ZnO nanoparticles were characterised by various sophisticated techniques like x-ray Diffraction (XRD), Scanning Electron Microscope (SEM), Dynamic Light scattering (DLS), Fourier Transform Infrared Spectroscopy (FTIR), UV–visible absorption, Photoluminescence (PL) and Zeta potential. The result indicates that the average grain size of the prepared nanoparticles was found to be a minuscule 24 nm with a commendable bandgap of 3.21 eV and 1.73 eV respectively. The hexagonal wurzite structures of pure and Ag-doped ZnO at room temperature confirmed the luminescence characteristics of the nanoparticles.
Export citation and abstract BibTeX RIS

Original content from this work may be used under the terms of the Creative Commons Attribution 3.0 licence. Any further distribution of this work must maintain attribution to the author(s) and the title of the work, journal citation and DOI.
1. Introduction
Zinc oxide (ZnO) nanoparticles, which are a potential photo luminescence material, with powerful oxidation capability, non-toxicity, chemical stability and phenomenally low at cost, have drawn extensive interest in the global scientific researches and industries. Previous study reports that the doping element will influence the luminescence properties of ZnO nanoparticles constantly at prime blue shift or red shift in its Near Band Edge (NBE) emission and sustainable changer in their visible emission [1]. Due to its unique optoelectronic characteristics several theoretical and experimental studies are carried out in different morphologies such as nanoparticles, nanowires and nanostructure thin films. The material is widely applied in piezoelectric transducers, optoelectronic devices, space detectors, sensor, solar cell windows, etc. ZnO nanoparticles have a II–VI compound semiconducting material and wide bandgap (3.36 eV at room temperature) with substantial Excitonic binding energy (60Ev) [2]. The luminescence properties of these nanostructures also depend on their morphology, growth technique, synthesis method, synthesis conditions and imperfections.
Ag-doped ZnO nanoparticles have a distinguishing photocatalytic effect on the semiconductor nanostructures. Beyond this, Ag-doped ZnO nanoparticles are biocompatible, bio-safe and phototoxic intracellular material [3]. At room temperature Ag-doped ZnO nanoparticles metal ions are used for various applications; especially for the n-type doped nanolaser and the p-type doping as ferromagnetic semiconductor materials. The transition metals emphasize the optical absorption with lower Fermi energy level, which stimulates the interfacial electron transfer process. This paper investigates the Ag-doped ZnO by inexpensive sol-gel route synthesis at the room temperature approach, which is easy to carry the entire work to find the luminescence properties. Sol-gel synthesis route allows the control of the final product characterized by varying parameters, such as size, structure, morphology [4]. Further, in this research the structural and morphological development of the pure and Ag-doped ZnO nanoparticles with reduced size are investigated.
2. Experimental procedure
2.1. Materials
The analytical reagent grade Deionized distilled water and Ethanol were used for the synthesis of nanoparticles obtained from Merck (Tamil Nadu, India). For the preparation of pure ZnO nanoparticles, Zinc Acetate Dihydrate [Zn (CH3COO)2.2H2O] and Sodium Hydroxide (NaOH) were used. For the preparation of dopant, Zinc Acetate Dehydrate [Zn (CH3COO)2.2H2O] with 95% purity was used as precursor and Citric Acid [C2H2O2] was used as a reagent. They were combined in a molar ratio of 1:1 with Silver nitrate [AgNO3] of 2% concentration.
2.2. Preparation method of pure ZnO NPs and Ag-doped ZnO NPs: sol-gel synthesis
Pure ZnO and Ag-doped nanoparticles were synthesized in the form of nanopowder by low-cost sol-gel method as recommended in the reference [5, 6]. The synthesis process for the preparation of nanoparticles was carried out at the room temperature under ambient condition. In brief, pure ZnO was synthesized by using Deionized water and ethanol, which were taken in equal proportions as solvent for mixing the precursor materials Zinc acetate dihydrate [Zn (CH3COO)2.2H2O] and Sodium Hydroxide (NaOH). The solution was stirred continuously for 2 h at 60 °C forming a milky white precipitate with pH 6–7. To prepare Ag-doped ZnO, 25 ml of Citric acid [C2H2O2] aqueous solution and 25 ml of aqueous 20 mM Zinc acetate dihydrate [Zn (CH3COO)2.2H2O] were used for synthesizing the white solution with pH 6–7. Citric acid [C2H2O2] was used as a precipitating agent to maintain the pH (6–7) level of the sol. Finally, the precipitate ZnO sol was added to Citric acid using magnetic stirring at 60 °C for 2 h, which gives white milky precipitates. Both solutions were centrifuged and washed with deionized water several times and then dried at 100 °C. The dried Ag-doped ZnO was calcinated at 550 °C and finally ground for one hour to obtain ZnO nanoparticles.
2.3. Characterization
The structural properties of the prepared nanoparticles were analyzed with the PANalyticalX'Pert powder XRD System diffraction spectrometer with Cu Kα line at 1.540 60[A°] and Ni filter for an angle range of 2θ = 20°–80°. The compositions of Ag-doped ZnO were authenticated by measuring the FTIR spectra of ZnO and Ag-doped ZnO nanomaterials. With respect to investigations of optical properties, absorbance measurements of the prepared samples were assessed by employing JASCO V-760 high-resolution UV-Visible spectrometer enclosing the range of 300–900 nm. Photoluminescence [PL] measurements were carried out for the synthesized sample at room temperature using JY Fluorolog-3–11 spectrofluorometer UV with a visible range of 180 to 850 nm, in the furnished source of Xenon Lamp 450 W Carl Zeiss MA15/EVO 18. Scanning Electron Microscope [SEM] measurements were also used to analyze the morphology of the sample with an accelerating voltage of 20 kV. For measuring the particle size Dynamic Light Scattering analyzer [ZEN3600 He—Ne laser (633 nm), size range—0.3 nm to 10 μm, Conductivity range: 0 to 200] was used. The Zeta potential was identified with HORIBA SZ-100 for Windows [Z Type] Ver 2.10 to find the surface charges of the nanoparticles.
3. Result and discussion
3.1. Structural properties
The figure shows the classic profile of XRD patterns of ZnO and Ag-doped ZnO powder, synthesized by sol-gel method respectively. The XRD patterns of the acquired forms of ZnO have no impurity peaks which indicates that, hydroxyl free ZnO doped Ag was prepared by sol-gel method.
The analysis from the table 1 shows that the synthesized Ag-doped ZnO sample in sol-gel method dominates a high crystallinity, with the consideration of very sharp intensity peaks. Absolutely all the diffraction peaks can be successfully catalogued to the hexagonal phase with a wurtzite structure (hexagonal phase, space group P63 mc [186]) having lattice parameters a = b = 3.253 A° and c = 5.213 A° as reported in JCPDS card (no 89.1397). The c/a ratio and u parameter converts have slightly broader range, from 1.593 to 1.6035 and 0.383 to 0.3856 respectively. Ten peaks appeared at 2θ = 31.8°, 34.5°, 36.3°, 47.5°, 56.8°, 63.0°, 67.9°, 69.1°, 72.3°, 77.0° with similar hkl plane values of (100), (002), (101), (102), (110), (103), (112), (201), (202) and (203) respectively.
Table 1. XRD values of Pure ZnO and Ag-doped Zno Nanoparticles.
| Lattice parameters | |||||||||
|---|---|---|---|---|---|---|---|---|---|
| Sl. No | 2θ Values Imax | Peak positions(°) | XRD crystalline size(nm) | a(A°) | c(A°) | c/a | d-Spacing | Unit cell Volume(nm) | Space group |
| 1 | 36.3(18.15) | 101(ZnO) | 27 | 3.25 | 5.21 | 1.603 | 2.601 | 47.85 | P63mc(NO:186) |
| 2 | 36.42(18.21) | 101(Ag-doped ZnO) | 27 | 3.25 | 5.21 | 1.603 | 2.603 | 48.01 | P63mc(NO:186) |
| 3 | 39.49(19.74) | 111(AgO) | 24 | 3.25 | 5.21 | 1.603 | 2.603 | 48.01 | P63mc(NO:186) |
| 4 | 44.85(22.42) | 032(AgO) | 21 | 3.25 | 5.21 | 1.603 | 2.603 | 48.01 | P63mc(NO:186) |
For the Low proportion of silver (Ag) addition (0.3 at%), the XRD patterns show low-intensity diffraction peaks at 2θ values of 39.496° and 44.754°, in Agreement with JCPDS card no:84.1261. In our work, the (101) plane is the most intense plane, which favours the growth pattern of the ZnO nanoparticles. As mentioned in figure 1, the (101) diffraction peak that had appeared can be attributed to both pure ZnO and Ag-doped ZnO which is also similar to previous report [7]. According to the literature review, Ag can integrate into ZnO conformity, which is a substituent for Zn2+ or as an intermediate space atom. The Ag dopant as a substitute for Zn2+ aids in achieving a closer peak shift in the XRD. Further, no more shifts in the peak positions were observed in any of the prepared samples [8]. According to this indication, segregation of Ag particles in the grain boundaries of ZnO crystallites rather than going to the lattice of ZnO. The peak clearly shows that the addition of Ag dopant influences a significant reduction in crystallite size. Using Scherrer's formula the average grain size of the Ag-doped ZnO from the prominent peak in the XRD is verified.

Where βhkl is the Full Width of Maximum (FWHM) of diffracting peak, K is the constant value of 0.9, λ is the x-ray wavelength used in XRD instrument, i.e. λ = 0.1540 nm, D is the crystalline size and θ is the Bragg's angle. The average crystalline size recorded is infinitesimal value of 24 nm.
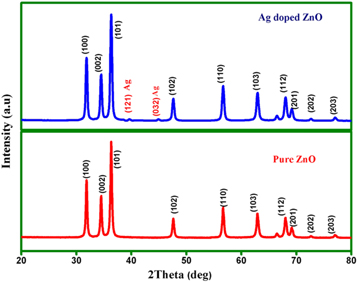
Figure 1. XRD pattern of Pure ZnO and Ag-doped Zno Nanoparticles.
Download figure:
Standard image High-resolution imageTo acquire more detailed structural investigations, the lattice parameters of pure ZnO and Ag-doped ZnO were calculated towards Rietveld rectifications. The rectification was accomplished using the space group P63 mc (186) with (1/3, 2/3, 1) the atomic position of Zn and (1/3, 2/3, 0.3839) atomic position of O and fm-3m space group with (0, 0, 0) atomic position of Ag. The lattice parameters (a and c axes) and their ratio c/a were extracted from Rietveld refinement, validates the wurtzite hexagonal crystal structure for ZnO nanoparticles in this experiment. The change in the ratio between c/a for pure ZnO and Ag-doped ZnO is shown in table 2. The XRD graph confirms the presence of Ag dominated biphase (Ag+AgO). Furthermore, the diffraction peaks are more extensive and narrower, which signifies a good crystalline nature of Ag-doped ZnO nanoparticles on par to the earlier studies [9–11].
Table 2. Crystallographic structure.
| Chemical formula | Zn(CH3COO)2.2H2O) |
| Cell parameters | a = b = 3.253 A°, c = 5.213 A° |
| Volume(CD) | 47.77 |
| Molecular weight | 81.38 |
| System | Hexagonal, Wurtzite |
| Chemical formula | AgNO3 |
| Cell parameters | a = 5.859, b = 3.484, c = 5.499 |
| Volume(CD) | 107.07 |
| Molecular weight | 123.87 |
| System | Monoclinic |
3.2. Scanning electron microscope (SEM)
The scanning electron microscope used for evaluating the morphology of the pure ZnO and Ag-doped ZnO samples are shown in the figure 2 with reference to Jayabarthy et al [12]. Pure ZnO shows the clusters of tiny particles and the 2% Ag-doped ZnO occurs like hexagonal wurtzite structures and moreover spherical in shape. These resulting structures recorded are acknowledged with the X-rd results. This denotes that the XRD powder data may contain some favoured inclination effects, especially for the measurement taken by the bracket sample holder. Although the particle size is larger due to the aggregation of the crystallites, the crystallite size is phenomenally mere 2 μm. The micrograph shows that a network origination of the ZnO nanoparticles has taken place as reported in earlier works [13, 14]. It distinctly specifies that agglomeration has occurred and also established that, the morphology of Ag-doped ZnO and pure ZnO nanoparticles are closely similar. This similitude is caused due to the distributions of the dopant silver on the surface of ZnO nanoparticles, which are not uniformly doped species having an asymmetrically shaped particles with aggregations of the tiny crystals. A greyish-white patch was formed on the top of the sample thereby indicating that the metal ions were diffused on the surface of the ZnO nanoparticles. From the SEM, as emphasized by Alam et al the server aggregated particle size was found and the results were closer to X-rd analysis [15]. The significant SEM particles dimension is higher than the corresponding crystallite size i.e. 24 nm. This inconsistency is due to the appearance of aggregates in SEM grain which involves several crystallite or poor crystallinity.

Figure 2. SEM image of pure ZnO and Ag-doped ZnO nanoparticles.
Download figure:
Standard image High-resolution image3.3. Dynamics light scattering
The nanocomposites were investigated through the Dynamic light scattering (DLS) and Zeta potential was measured by pure ZnO and Ag-doped ZnO. The initial measurement of DLS (Hydrodynamic diameter and polydispersity) was carried out with intensity-weighted particle with the defined size distribution [16]. The DLS should characterize the hydrodynamic diameter distribution in the range of hundreds of nm. This particular result was significant on the colloidal agglomeration. The figure 3 shows the average particle sizes of pure ZnO and Ag-doped ZnO as 18 nm and 19 nm respectively. The identical result is conformed in the XRD pattern [17–19]. Thus a good correlation is found among the results of XRD, SEM, DLS techniques is found in the experiment based on the similarity in size of nanoparticles, which ranges within 18 nm to 24 nm.
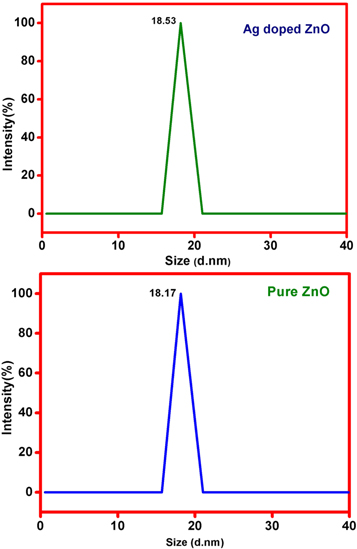
Figure 3. Particle size distribution of pure ZnO and Ag-doped ZnO nanoparticles.
Download figure:
Standard image High-resolution image3.4. Chemical structure identification using FTIR
FTIR interpretation analysis technique was employed to acknowledge the materials chemical bonding. It identifies the elemental unit of materials [20]. The characteristic peaks manifested by FTIR spectrums of both pure ZnO and Ag-doped ZnO are shown in figure 4.

Figure 4. FTIR spectra of pure ZnO and Ag-doped ZnO nanoparticles.
Download figure:
Standard image High-resolution imageThe FTIR spectra of ZnO and Ag-doped ZnO nanoparticles were recorded in the range from 500 cm−1 to 4000 cm−1. The predictable characteristic stretching mode of Zn-O and Ag-O bonds are appropriate with broad peaks, which ranges from 3782.78 cm−1 to 581.73 cm−1 for pure ZnO and 3718.43 cm−1 to 680.79 cm−1 for Ag-doped ZnO. In this case of Ag-doped ZnO nanoparticles, the intensity of the peak is reduced due to the origination of Ag nanoparticles on the surface of ZnO nanoparticles. The IR spectrum of ZnO manifests the characteristic absorption band with 581 cm−1, due to one transverse optical stretching mode of ZnO. The peaks ranging from 1567.40 cm−1 to 1399.51 cm−1 were found due to the symmetric and asymmetric stretching vibration of the C=O group of acetate, which encourages the occurrence of acetate anionic moieties at ZnO surface. The peak at 1002.30 cm−1 establishes the aromatic C=C stretching mode. The weak broad peak around 3423.65 cm−1 is due to the O-H stretching vibration. In the FTIR spectrum of ZnO, the strong peaks agreement to carbonyl acetate was absent. The peak is located at 2354.03 cm−1 due to the atmospheric presence of CO2 in the equipment. The stretching mode of C–C and C=O were observed at 1399.51 cm−1 and 1002.30 cm−1 respectively. The band at 581.73 cm−1 is related to metal oxide (ZnO). On Ag doping, the wider and strong band were observed in the region ∼864.71 cm−1. Thus, it is validated from the FTIR data, that the Zn–O vibrational mode is prominent with stronger doping characteristics between pure ZnO and Ag-doped ZnO nanomaterials [21–23].
3.5. Optical properties
The bandgap of pure ZnO and Ag-doped ZnO nanoparticles were investigated with the UV–vis spectra in the range of 200–800 nm. Pure ZnO nanoparticles were found to be having a direct bandgap, which has been calculated from the plot of Absorbance Vs Wavelength (λ) as shown in the figure 5 [24–26]. The determined values of the bandgap energy of pure ZnO and Ag-doped ZnO nanoparticles are listed in table 3 indicates that the bandgap reduces the exciton absorptions from 3.1 eV and 1.6 eV by the addition of silver content in the ZnO nanoparticles.
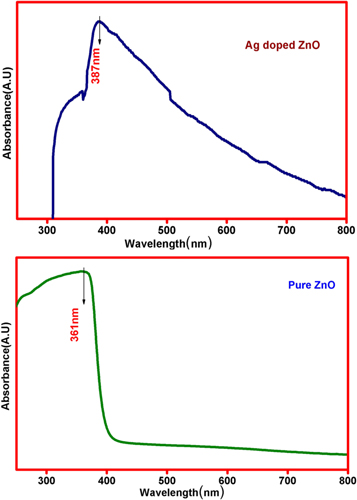
Figure 5. UV-Visible absorption spectra of pure ZnO and Ag-doped ZnO nanoparticles.
Download figure:
Standard image High-resolution imageTable 3. UV-Visible absorption spectra values for pure ZnO and Ag-doped ZnO nanoparticles.
| Sl. No | Sample | Wavelength(nm) | Energy bandgap E = h.c./λ = 1240/λ (eV) |
|---|---|---|---|
| 1 | ZnO | 361 | 3.1 |
| 2 | Ag-doped ZnO | 387 | 1.62 |
The observed absorption spectra confirm that there is a significant shift to larger wavelength (a redshift) by adding silver dopant, which is due to the strong interaction between oxides of Zinc and silver. The results of pure ZnO and Ag-doped ZnO show that, there is a noticeable redshift occurring at UV absorption. This redshift in UV absorption is the consequence of obtaining n-type ZnO nanoparticles, where the stretch of the bandgap is specifically observed for ZnO doped with donors and reduction of the bandgap is observed for Ag-doped with the acceptor. The UV peak of the optical measurements of Ag-doped ZnO nanostructures illustrates a strong red shift. A parallel redshift is recorded due to the strong interaction between d-element of Ag-ion and s- and p- electron of the host Zinc oxide. With respect to the pure ZnO, interchange of sp-d, band electrons of ZnO and localized d-electrons of Ag+ induce the renormalization effect. The feasible interchange of interaction (s-d and p-d) in nanomaterials has lead to correction in valance bandgap and conduction band edges to allow final shrunk bandgap. The surface Plasmon resonance (SPR) peak around 400 to 800 nm was not observed due to the strong interfacial coupling between Ag and ZnO. The shift of 1.73 eV less than that of ZnO nanoparticles was observed. The significant variation in the bandgap is noticed due to the inclusion of Ag dopant in the ZnO nanoparticles. The decrease in the bandgap energy is due to the formation of intermediate donor levels below the conduction band, with the electron requiring less energy to move from valance to conduction band
Divergent parameters interconnected to optical properties (optical bandgap and absorption coefficient) of ZnO and Ag-doped ZnO nanoparticles, can be estimated using Tauc's equations,

Where α is the absorption coefficient, hv is the photon energy, A is a constant and Eopt represents the optical bandgap. The figure 6 shows the plot of αhv2 versus the hv. The past studies in various literatures enunciate that, the redshift of bandgap energy is due to agglomeration of the nanocrystallites into larger crystallites. The results justify this decrease in Eopt, which is mainly due to the existence of oxygen vacancies that further leads to an easy transport of electron band structure of ZnO nanoparticles. The enhancement in the absorption of nanoparticles due to the incorporation of Ag doping has very high contribution in worldwide industrial applications [27–30].
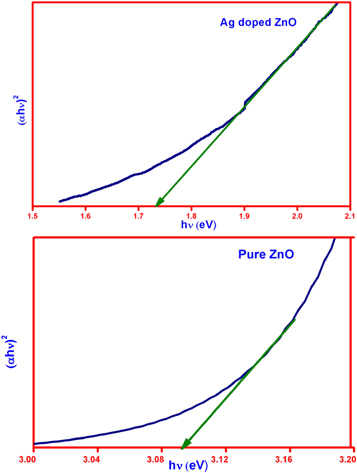
Figure 6. Tauc plot for pure ZnO and Ag-doped ZnO nanoparticles.
Download figure:
Standard image High-resolution image3.6. Photoluminescence spectroscopy
Photoluminescence spectroscopy is used for the essential interpretation of chemical compositions, structure, impurities, energy transfer, photoelectric activity and electronic structure of nanoparticles. In this study of pure ZnO and Ag-doped ZnO nanoparticles, the obtained PL emission intensity decreased and these results are in good agreement with the stern-Volmer quenching [31]. Further a highly significant charge carrier separation efficiency was recorded and also some controversial defect emission in ZnO. In specific, the PL spectra of ZnO nanoparticles usually have two emission bands. The first is in the UV region, which is assigned to the near-band-edge emission between exciton-exciton collision processes. The second is in the visible region, due to electron-hole recombination originating by intrinsic point defect and surface defect (e.g. Oxygen vacancies, zinc interstitials, and incorporation of hydroxyl groups) in the crystal lattice during the solution growth. The PL emission spectrum of pure ZnO and Ag-doped ZnO nanoparticles were recorded at room temperature with an excitonic wavelength of 398 nm, which is near band edge emission with the peak value of 406 nm, originated due to defect states as shown in figure 7. The emission peak at 427 nm was an analog with an electron transition from facile Donor Level (DL) of the neutral zinc interstitial to the top level of the valance band. The emission at 449 nm and 486 nm is a credit due to the surface defect of ZnO. The green emission at 512 nm could be determined by Oxygen vacancies. The peaks were centred at 398 nm, 427 nm (violet emission) and 491 nm DL with sub-peaks at 467 nm (blue emission) and 512 nm (green emission) at Acceptor Level (AL sub-peaks) [32–34]. The asymmetric spectra are due to the native defect states of ZnO. This prospective presence of these defect state increases the luminescence characteristics when ZnO was resized to the nano dimension. According to this study, size, morphology, surface roughness and external doping of ZnO should control these defect emissions. Consequently, the defects due to native Oxygen vacancies were responsible for the visible emissions in ZnO sample.

Figure 7. Photoluminescence spectra of pure ZnO and Ag-doped ZnO nanoparticles.
Download figure:
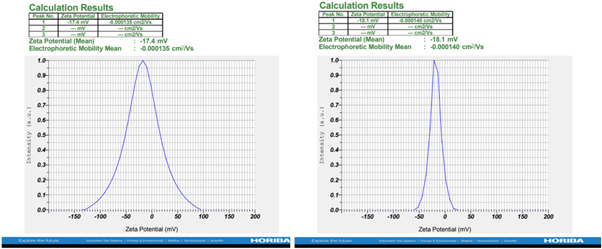
Standard image High-resolution image3.7. Zeta potential studies (ς-potential)
Zeta potential was used to find the surface charge and potential stability of ZnO nanoparticles in colloidal suspension [35]. The ς-potential investigation for the surface charge of ZnO and Ag-doped ZnO is −17.4 mV and −18.1 mV as shown in the figure 8. The small crystalline size obtained from the results of XRD, SEM, and DLS techniques lead to negative ς-potential values in the investigation. The resultant particle size has a significantly smaller Zeta potential value, which leads to repulsion between the particles. There was no aggregation found in the particles. The small particle size confirms the potential stability of the nanoparticles, i.e., the solution will resist the aggregation. The low ς-potential leads to repulsion rather than attraction and thus the dispersion will break and flocculate as demonstrated in references [17, 36].
Figure 8. Zeta potential distributions of pure ZnO and Ag-doped ZnO nanoparticles.
Download figure:
Standard image High-resolution image
4. Conclusion
Synthesis of metal oxide nanoparticles is an environmental friendly low cost and easy handling process used worldwide. This paper demonstrated an elaborate structural investigation of pure ZnO and Ag-doped ZnO, synthesised using sol-gel method at room temperature. The structure, morphology and luminescence properties of the resultant characterization were evaluated using XRD, SEM, DLS, FTIR, UV-vis, PL Spectroscopy and Zeta potential tools. The results from the XRD pattern enunciated that the pure ZnO and Ag-doped ZnO have hexagonal wurtzite structures with secondary phase in FCC structures. A striking peak value of 101 in pure ZnO and two peaks at 121 and 032 for Ag-doped ZnO were recorded from the evaluation with the average crystalline size of 24 nm. The SEM images of the particle surface morphology have been aggregated in nature. The shape of the surface morphology was strongly influenced by the doped Ag material and it looked like a spherical and cauliflower shape in SEM. The DLS data confirmed that the particle size of both the ZnO samples decreased with the mean size of 18.17 nm and 18.53 nm respectively. The crystalline size, morphology and particle size results from XRD, SEM and DLS strongly supports the physical interactions of the ZnO nanoparticles. The FTIR confirmed the functional group of ZnO and Ag-doped ZnO with FTIR spectra broad band value ranging from 4000 cm−1 to 500 cm−1 at Zn-O stretching mode. The UV absorbance was excellent for pure and Ag-doped ZnO with the peak values of 361 nm and 387 nm. The bandgap was calculated using Tauc plot with record values of 3.1 ev and 1.73 ev. Thus, this research is highly imperative to confirm that, the ZnO and Ag-doped ZnO nanoparticles have a clear hexagonal wurzite face with high luminance properties.