
Abstract
The rising awareness of the need for a healthy environment for living systems has led to an increasing demand for suitable catalyst materials for wastewater treatment. In this connection, in the present work, the catalyst materials Hydroxyapatite and Hydroxyapatite/Tantalum (HAp/Ta) core–shell nanostructured particles were prepared through a facile nanoprecipitation method without a surfactant, chelating agents and/or ligands. The prepared nanostructured particles were characterised with the help of several analytical techniques namely XRD, FESEM, TEM, EDS, FTIR, Raman, XPS and BET. The calculated average crystallite size of HAp was found to be 26 nm and the core–shell nanorod morphology was corroborated through FESEM and TEM technique. The average length and width were found to be 44 and 16 nm respectively. The specific surface area (SSA), microporous nature and pore volume were investigated through the N2 adsorption isotherm method. The photocatalytic activity of the prepared HAp and HAp/Ta core–shell nanostructured particles was investigated on frequently used dyeing industrial dyes Turq blue GL under UV irradiation. The recorded results evince that the HAp/Ta core–shell nanorods have more catalytic activity than pure HAp and can be used as a nanophotocatalyst for industrial waste water treatment process to curb water pollution and to protect the environment.
Export citation and abstract BibTeX RIS

Original content from this work may be used under the terms of the Creative Commons Attribution 3.0 licence. Any further distribution of this work must maintain attribution to the author(s) and the title of the work, journal citation and DOI.
1. Introduction
The need to develop a suitable catalyst/photocatalyst that is in the nanoscale and with nanostructure has increased owing to the promising applications of nanomaterials in the field of industrial manufacturing processes [1–3], water splitting for environmental protection such as wastewater treatment [4, 5], and bio diesel production to fulfil the requirement for alternate fuels [6]. Different types of catalysts have been used in the aforementioned processes and fields to produce suitable materials and to ensure environmental safety. Among the different types of catalysts such as homogeneous catalysts, heterogeneous catalysts, enzymatic catalysts and lipid enzymatic catalysts [7, 8], the heterogeneous catalysts have attracted much attention [9–12] for application in the degradation of polluting dyes. For example, metal oxides like PdO [13, 14], Ta2O5 [4, 15], TiO2 [16], SnO2 [17, 18], CeO2 [19], ZnO [20], MgO [21], α-Fe2O3 [22], and Pd/HAp/Fe3O4 [23], HAp-Pt [24], carbon nano tubes (CNT) [25] and graphene [26, 27] are used as photocatalysts for degrading dyes. Further, sustainable wastewater treatment is an important process to protect the environment from the effects of industrial activities. In this connection, earlier investigators have reported epigallocatechin-3-gallate (EGCG) based protein separation from soy whey wastewater, continuous adsorptive (recycle) wastewater treatment processes for sustainable membrane fabrication, an eco-friendly concept to prepare anti-oxidant biobased polymer films from olive mill wastewater and development of superhydrophilic—superoleophobic materials for separation of various oil-water mixtures and removal of water soluble organic dyes from industrial wastewater [28–31]. Hence, the search for environmental benign catalysts /biocatalysts (sustainable catalytic approaches) has also gained momentum in the recent years [32–34]. In this context, HAp, Ta2O5 and Ta have acquired great attention due to their excellent biocompatibility, biological activity, catalytic activity and non-toxicity to the environment [7, 15, 22, 35–39]. Zhou et al have reported that hierarchical hollow HAp microspheres have a unique adsorbing ability for removing heavy metals in polluted water [36]. Shariffuddin et al prepared hydroxyapatite through a greener route from waste mussel shells for degrading azo dyes [5]. Tantalum has been used as a dopant for increasing the photoactivity of hematite (α-Fe2O3) [22]. More recently, Shkir et al [40] developed HAp and KI doped HAp NRs and investigated their photocatalytic activity against methylene blue (MB) dye when combined with stenotrophomonas maltophilia bacteria. They reported that 83% of decolorization was observed at 48 h by using dead cells with 1 w% KI-HAp and 5 w% KI-HAp. Xu et al used polyoxometalate-tantalum pentoxide composite as a catalyst for transesterification process [6]. Also, tantalum oxide was used as a catalyst in CVD processes for preparing SWCNT and MWCNT; Au/Ta2O5 was used as a catalyst for hydrogen evolution processes [1, 2].
Nano Hydroxyapatite (Ca10(PO4)6(OH)2) has a wide band gap and it has been used as a catalyst in various environmental and industrial processes like water purification, degradation of pollutants and fertilizer production [3]. This is attributed to the excellent sorption property of HAp. However, the photocatalytic activity of pure HAp is significantly low [41]. The transition series element Tantalum (Ta) is widely used as a catalyst in various industrial processes such as the photodegradation of pollutants [4, 15]. Combination of materials like HAp and Ta can degrade organic and inorganic pollutants (dyes) and can be used for environmental waste purification and also for the photocatalytic decomposition of biomaterials like proteins and lipids.
Several studies have concentrated on the use of surfactants and chelating agents to prepare nanostructured materials. In the present work, pristine nano HAp and HAp/Ta core–shell nanostructured particles have been prepared successfully through a template / surfactant free nanoprecipitation method. The synthesised nanoparticles were systematically characterized and the degradation of an industrial dye (pollutant) investigated using these HAp and HAp/Ta nanostructured particles under UV irradiation. The model dye (Turq blue GL) has been collected directly from a textile dying factory in Karur district, Tamilnadu, India. The selected dye is frequently used for colouring cottons in textile dyeing factories.
2. Experiment
2.1. Reaction materials
Analytical reagent grade (A.R.) of Diammonium hydrogen phosphate ((NH4)2HPO4) and Calcium chloride dihydrate (CaCl2.2H2O) were purchased from Himedia Laboratories Pvt. Ltd India. Tantalum chloride (TaCl5) of 99.99% purity was purchased from Alfa Aiser. Absolute ethanol (99.9% purity) and liquor Ammonia (25% purity) purchased from SD-Fine Chem Ltd, India, were used to adjust the pH. All the reagents and chemicals are AR grade and used without further purification. The model dye (Turq blue GL) was collected from an actively working dyeing factory in Karur district, Tamilnadu, India.
2.2. Synthesis of pristine HAp and HAp/Ta nanostructured particles
Calcium chloride and diammonium hydrogen phosphate were mixed separately with 20 ml of double distilled water in the molar ratio of 1:0.6 to maintain a stoichiometric ratio of 1.67 for hydroxyapatite. The pH of the phosphate solution was raised to 10.5 by adding ammonia (25%) solution. Both solutions were stirred continuously at moderate speed (40 rpm) at room temperature for 30 min. The calcium containing solution was then added to the phosphate solution. The obtained mixture was stirred for 48 h at room temperature and the resultant precipitate was washed with aqueous solution and dried at 100 °C in a hot air oven for 24 h.
The prepared HAp nanoparticles (10 mM) were dispersed into 10 ml ethanol and stirred well (70 rpm) for 30 min at room temperature. A calculated amount (1 mM) of Ta precursor salt (TaCl5) was next added and argon gas was purged into the reaction mixture for 30 min. The reaction mixture was then stirred well (70 rpm) for 30 min at room temperature and the obtained precipitate washed with ethanol several times and dried in a vacuum oven (0.08 MPa) at 80 °C for 12 h. The schematic diagram (figure 1) below illustrates the whole synthesis and experimental procedure used in the present work.

Figure 1. Schematic diagram for synthesis of HAp and HAp/Ta nanostructured particles.
Download figure:
Standard image High-resolution image2.3. Characterization techniques
The morphological features were recorded using field emission scanning electron microscope (FEI Quanta-250 FESEM) combined with EDX spectroscopy and transmission electron microscope (FEI Tecnai G2 20 S-TWIN). XRD patterns were recorded by X'Pert Explorer PANalytical diffractometer equipped with Cu Kα radiation. FT-IR spectra were recorded using Bruker Tensor 27 FTIR spectrometer and the UV–vis spectra were taken from JOSCO V-650 spectrometer. Raman analysis was performed in Micro Raman spectrometer −800 (LabRAM HR, Horiba Jobin Yvon) with 514 nm. XPS (SPECS using Mg Ka; PHOIBOS 100MCD energy analyser) survey scans were recorded at ultra-high vacuum and the data analysed using CASA XPS software. Pore structure and specific surface area (SSA) were investigated through BET-BJH (AUTOSORB IQ-1; Quantachrome).
2.4. Photocatalytic experiment
25 mg of the catalyst (nanomaterial) was dispersed into 100 ml of aqueous solution of (15 mg L−1) Turq blue GL. The solution was stirred well (70 rpm) in darkness to establish adsorption/desorption equilibrium between the catalyst and dye molecules. The solution was then irradiated by UV light (λmax = 365 nm) to induce photochemical reactions. The samples were collected at regular time intervals (30 min) for most of the reactions and some of them were collected at 5 min intervals. The degradation of the dye solution was examined by using the UV–vis spectrophotometer.
3. Results and discussion
3.1. Structural and morphological analysis
The x-ray diffraction method is used to study the crystallographic structure, crystallite size, and preferred orientation in polycrystalline or powder solid samples. It is a preferred method to characterize the unknown crystalline materials by comparing the diffraction patterns with pre-existing database of known materials. X-ray diffraction pattern of pristine HAp and HAp/Ta are shown in figures 2(a) and (b). Figure 2(a) evinces well broadened peaks with high intensity which represents the higher crystalline nature, smaller crystallite size, and hexagonal symmetry of hydroxyapatite (HAp). The obtained pattern is in good agreement with standard JCPDS # 09-0432. The Scherrer's formula was used to calculate the average crystallite size of HAp which was found to be 26 nm. Figure 2(b) shows the x-ray diffraction pattern of HAp/Ta. HAp peaks are observed to be greatly suppressed and some peaks disappear due to the surface coating of tantalum (Ta) on HAp. Similar effects have been observed by earlier investigators [42–44]. Ta has smaller atomic (2.09 Å) and ionic (0.64 Å (Ta5+)) radii than Ca which has an atomic radius of 2.23 Å and ionic radius of 1.00 Å [45]. Therefore the tantalum ions enter into the lattice of HAp and occupy the Ca2+ sites. This causes the reduction in intensity of major peaks and disappearance of some peaks that correspond to HAp. This also leads to the decreased crystallinity of HAp/Ta. A Similar effect has been observed in silica, Fe3O4 coated HAp core–shell nanoparticles [42, 43]. In addition, the preparation of HAp/Ta by using a non-aqueous solvent in an inert atmosphere (Ar atmosphere) helps in the formation of metallic Ta around the HAp core. This is because, as reported in literature [4, 46], the addition of a small amount of water molecules leads to the formation of the oxide layer of Ta (Ta2O5). In the present work, a non-aqueous solvent and inert atmosphere were used for preparing HAp/Ta and water was not used. Hence the Ta coating on HAp is found to be metallic in nature.

Figure 2. XRD patterns of (a) pristine HAp and (b) Ta coated HAp nanostructures.
Download figure:
Standard image High-resolution imageThe existing functional groups were confirmed through FTIR analysis. Figure 3(a) shows the FTIR spectrum of pristine HAp nanoparticles. In the spectrum, all the peaks are present at standard positions [47]. The structural hydroxyl groups (OH−) peaks are exhibited at 3570 and 633 cm−1. The peaks at 472, 566, 603, 960 and 1035–1092 cm−1 are attributed to tetrahedral phosphate (PO43−) groups of HAp. The peak at 960 cm−1 is attributed to phosphate (ν1) and that at 472 cm−1 is also due to phosphate (ν2, PO43−). PO43− (ν3) peaks are observed at 1092 and 1035 cm−1. Phosphate (PO43− (ν4)) peaks are also observed at 566 and 603 cm−1. The broad peak observed at 1403 cm−1 confirms that the prepared HAp contains a carbonate group which is due to the interaction of atmospheric carbon dioxide with the reaction medium [48]. In addition, two small peaks are observed at 1413 and 874 cm−1. This confirms the B-type carbonate substitution in HAp [48]. The FTIR spectrum of tantalum coated HAp nanoparticles is given in figure 3(b). In the spectrum, the intensities of the characteristic stretching and vibrational mode peaks are decreased and slightly shifted, which is due to the presence of metal (Ta) nanostructure on the surface of HAp and Ta incorporation within HAp [20]. This result is consistent with an earlier report [35]. The sharpness of the peaks at 565 and 602 cm−1 is reduced, which reveals the lower crystallinity of HAp/Ta. This is attributed to tantalum [49]. The broad peaks at 3420 and 1637 cm−1 are attributed to adsorbed water molecules. The intensity of carbonate peaks is observed to be decreased in the spectrum, which is due to the presence of the dense Ta shell on their structure as well as the inert preparation conditions.

Figure 3. FTIR and Raman spectra of (a), (c) pure HAp, and (b), (d) HAp/Ta nanostructures.
Download figure:
Standard image High-resolution imageBoth FTIR and Raman analysis are complementary techniques. The Raman spectra of pristine HAp and Ta coated HAp are shown in figures 3(c) and (d). The Raman spectrum of pristine HAp is given in figure 3(c). The characteristic tetragonal PO43− (ν1) group peak is observed at 961 cm−1, which confirms the symmetric stretching of P–O bonds and the peak position reveals the crystalline nature of HAp [47, 50]. The PO43− (ν2) vibrational modes appearing at 429 and 444 cm−1 reveal the O-P-O bending modes. The band at 1045 cm−1 is attributed to the asymmetric stretching of P–O (ν3). The peaks at 579, 591 and 609 cm−1 arise from PO43− (ν4). The peak at 1077 cm−1 depicts the existence of B-type carbonate (ν1) [47]. The Raman spectrum of HAp/Ta in figure 3(d) shows similar peaks, but the intensities of all the peaks are greatly suppressed and the peaks are slightly shifted. This is due to the presence of a dense Ta layer around the HAp and the incorporation of Ta into the HAp.
The morphologies of the prepared HAp and HAp/Ta nanoparticles were investigated by FESEM and TEM techniques. Figures 4(a) and (b) show the corn like nanostructures of pristine HAp which contain spherical nanoparticles. The average length and width of these corn like structures are found to be 100 and 50 nm respectively. Further, uniform size distribution (less than 15 nm) of the spherical particles is observed. The as-prepared sample was kept for self-annealing for one day at room temperature. The spherical particles are observed to combine together to form corn structures which is attributed to Ostwald ripening. The shape of particles is granular which depends on the time of stirring and the precursor materials. Moreover, the mode of addition of precursor materials is taken into consideration in order to obtain the desired morphology with higher crystallinity. It is observed that fast mixing of precursor materials leads to the formation of spherical particles [44]. In most of the precipitation and sol-gel methods reported earlier, chelating ligands, surfactants and templates were used to control the particle size and morphology of the HAp with a view to minimize their higher agglomeration tendency [44]. In contrast, in the present work the particle size and morphology are controlled by only tweaking the reaction stirring time and precursor materials. The aforementioned agents are not used in this work. Figure 4(c) depicts a rod like structure for HAp/Ta. According to Gibbs-Thomson equation and Fick's first law, the chemical potential of particles increases with decreasing particle size [36]. The equilibrium solute concentration near a small particle is higher than that near a large one. The resultant gradients could lead to molecular diffusion in the solution acting as the driving force for the formation of larger particles from smaller ones. The corn like nanostructures of pristine HAp consist of spherical nanoparticles with higher surface energy. Diffusion into the outer shell occurs by dissolution-recrystallization processes and finally larger rod like crystals are formed.

Figure 4. FESEM images of (a), (b) pristine HAp, (c) HAp/Ta and TEM images of (d) HAp/Ta, (e) EDS spectrum of HAp/Ta, (f) the higher magnification TEM image of HAp/Ta.
Download figure:
Standard image High-resolution imageTo confirm the structure and size, TEM is employed. The obtained TEM image of HAp/Ta in figure 4(d) shows core–shell nanorods. The higher magnification image at the bottom of figure 4(f) clearly reveals that the addition of Ta leads to the distribution/destabilization of the corn like pristine HAp nanostructures. As the tantalum is a highly dense material, it enters into the lattice of HAp, induces crystal growth and produces rod morphology and is referred to as core. Hence, the change of lattice parameters is observed in the XRD. Similar results in which the dopant Ta induced nucleation of the core material to form crystals along the axis have been reported earlier [20, 22]. In addition, a thin layer of tantalum is observed on the surface of the HAp nanorods (figure 4(f)), which is referred to as shell. This explains the intensity reduction observed in the XRD pattern of HAp/Ta. The average length and width of core–shell NRs are found to be 44 and 16 nm respectively and the shell thickness was found to be ∼ 1–2 nm. Figure 4(e) shows the corresponding EDS spectrum of the prepared HAp/Ta core–shell NRs. This spectrum confirms the presence of Ca, P, O and Ta. There are no other elements in the sample.
3.2. XPS analysis
The electron structure of the prepared nanomaterials was analyzed by x-ray photoelectron spectroscopy. Figure 5 shows the x-ray photoelectron spectra of HAp/Ta core–shell NRs. The major peaks corresponding to Ca, P and O are observed and are consistent with earlier literature [51]. The major Ca 2p3/2 and Ca 2p1/2 peaks are observed at 346 and 350 eV respectively and P 2p peaks at 131.9 and 132.7 eV. Moreover, at binding energy levels of 530 and 531 eV, two O1s peaks are observed which reveal the phosphate oxygen in the PO43− group and in the adsorbed water molecules [51]. The binding energy (Eb) level of Ta 4 f metal is found to be 21.87 eV as shown in figure 5(d), and it matches well with that of bulk Ta [52]. The major Ta 4f7/2 (26.2 eV) and Ta 4f5/2 (28.3 eV) peaks (for Ta2O5) do not appear which confirms that the existing Ta has pure metallic nature. This is confirmed by the presence of Ta4f peaks at 21.87 eV in figure 5(d). Due to the lower concentration of Ta, and inert preparation conditions, the Ta4f peaks (for Ta2O5) are not formed. The prepared sample shows Ta4d peaks such as Ta4d5/2 at 230.33 and 227.97 eV and Ta4d3/2 at 241.95 and 240.36 eV. The Ta4d5/2 peak at 227.97 eV confirms the metallic nature of Ta and the Ta4d5/2 at 230.33 eV reveals the existence of a small amount of the oxide form such as Ta2O5 at the surface of the Ta layer [37, 53]. Furthermore, the O1s at 530.3 eV peak reveals the presence of Ta-O bond in the sample [38]. This is because of the natural passivation character of tantalum and also the contact with atmospheric air [37]. The presence of Ta4d5/2 and Ta4d3/2 peaks indicates the presence of the metallic rich tantalum layer existing at the bottom of the tantalum oxide layer [37].

Figure 5. XPS spectra of (a) calcium, (b) phosphorous, (c) oxygen, and (d,e) tantalum of HAp/Ta core–shell nanorods.
Download figure:
Standard image High-resolution imageThe HAp/Ta nanostructures also show lower energy level peaks such as Ca3p, O2s at 27.32 and 24.57 eV respectively. These are the inter valence molecular orbital (IVMO) structure peaks of HAp/Ta core–shell nanorods [54]. It is formed due to the absence of intense Ta4f peaks in the XPS spectrum of HAp/Ta. The Ta4f has a more intense peak for the familiar Ta2O5 phase. However, in the present work there is no high intensity peak (it is absent). With a background of higher binding energy and low calcium and oxygen concentrations, the Ca3p and O2s peaks are observed in the spectrum [55]. This confirms the presence of the phosphate (P-O) bond in the HAp [56]. As this study reveals only qualitative elemental analysis, separate atomic peaks are not observed. Due to the surface sensitivity of XPS, the presence of Ta4d5/2 is observed which confirms that tantalum is incorporated at the HAp surface. The results of the XPS analysis lead to the conclusion that the prepared HAp/Ta has core–shell nanostructure and that the shell tantalum has a rich metallic nature beneath the tantalum oxide layer.
3.3. BET-BJH analysis
The determination of specific surface area and pore size distribution of different solid materials have been done based on gas (nitrogen) adsorption measurements. The determination of specific surface area (SSA) by using BET theory has been elaborated by Brunauer-Emmet-Teller based on the phenomenon of physical adsorption of gases on the external and internal surfaces of porous material. The amount of adsorbed gases is dependent on the relative vapour pressure and proportional to the total external and internal surface areas of the corresponding materials. The relationship between relative vapour pressure and amount of adsorbed gas at constant temperature is called Adsorption isotherm. This is necessary for quantization study and interpretation of adsorption properties.
The N2 sorption analysis was performed to obtain the BET specific surface area (SSA) and BJH pore size of the HAp and HAp/Ta nanostructures. The pristine HAp spherical nanoparticles show the type IV adsorption isotherm with H3-type loop at a high relative pressure as shown in figure 6(a) [57, 58]. The calculated SSA and average pore diameter are found to be 41.97 m2 g−1 and 19.78 nm respectively. Hence it is confirmed that the pristine HAp has a mesoporous nature. Figure 6(b) shows type IV adsorption isotherm with H3-type hysteresis loop for HAp/Ta core–shell NRs also. Also, the SSA value for HAp/Ta is obtained as 42.41 m2 g−1 and the average pore diameter as 16.8 nm. This means that the HAp/Ta also has a mesoporous nature. The specific surface area of HAp/Ta is not significantly affected by the addition of Ta. However it shows a small increment in SSA, which is due to the addition of Ta and morphology change. Generally the surface to volume ratio of nanorods is higher than that of spherical particles. This plays an important role in increasing the SSA. But in the present work, the SSA does not show a considerable increase. Tantalum is generally known as a dense material and its presence on the surface of HAp may be the reason for the small increment in SSA. This result is corroborated with XRD results. The inset of figure 6 evinces the corresponding pore size distribution of HAp and HAp/Ta. Here, a small pore size reduction is observed, due to the formation of a dense Ta layer around the HAp core.
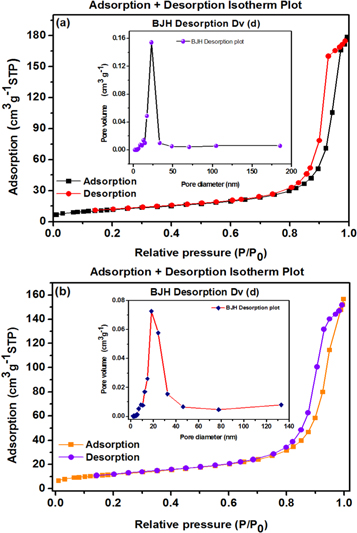
Figure 6. BET and BJH graph of (a) pure HAp and (b) HAp/Ta core–shell nanostructure. Inset: corresponding pore size distribution.
Download figure:
Standard image High-resolution image3.4. Photocatalytic activity of pristine HAp and HAp/Ta nanostructures on industrial dye
HAp is a stable biomaterial which can act as a heterogeneous catalyst for photodegradation of dyes. The photocatalytic activity of pristine HAp and HAp/Ta core–shell NRs have been investigated under UV light irradiation using Turq blue GL complex dye which is frequently used in the textile industry for adding colour to cottons. This dye affects the environment by causing water pollution. The time dependent UV–vis absorption spectra of pristine HAp and HAp/Ta nanostructures are given in figures 7(a) and (b). The pure dye has several absorption peaks in the UV–vis region. These peaks are observed at 217, 336, 623 and 664 nm which correspond to the existence of benzene ring, C=N bonds and the chromophore part in the molecular structure. The bands corresponding to the different molecular constituents of the dye (Turq blue GL) are observed to decrease with respect to time. The addition of catalysts such as HAp nanospheres into the dye solution at 0 h shows 49% of dye degradation. On increasing the time up to 9 h, 90% degradation is observed (figure 7(a)). The degradation percentage (D%) is calculated using equation (1) [59–61].

Where C0 is the initial concentration of the dye and Ct is the final concentration at time 't'.

Figure 7. Photocatalytic activity of pristine HAp and HAp/Ta core–shell nanostructures.
Download figure:
Standard image High-resolution imageFigure 7(b) shows the time dependent absorption spectra of HAp/Ta core–shell NRs. The spectra have been recorded at 30 min intervals up to 5 h and after that for every 1 h with HAp and HAp/Ta as the catalyst. The peak corresponding to aromatic benzene ring at 217 nm is overlapped initially and hence ignored. The absorption peak at 664 nm has been used to calculate the degradation percentage of the dye. The percentage of degradation of the dye is observed to increase with increase of irradiation time to 8 h (figure 7(c)). HAp/Ta core–shell NRs show 64.51% of degradation at 0 h and on increasing the time to 8 h, the degradation is observed to increase to 98.63%.
HAp/Ta core–shell NRs cause greater photodegradation than pure HAp, which is due to the morphology changes from spherical particles to nanorods and higher surface to volume ratio of the HAp/Ta. Generally nanorods showed higher photocatalytic activity, because of their higher surface to volume ratio which gives more active sites for the degradation of pollutants. The reaction followed pseudo-first order kinetics. The rate constant of the reactions has been calculated using equation (2).

Where C0 and Ct are the resultant absorptions measured at different time intervals, k is the rate of the reaction and 't' is the irradiation time. Figure 7(d) shows the graph of -ln C0/Ct against irradiation time. The calculated rate constants from the slope are 0.3664 and 1.1590 h−1 for HAp and HAp/Ta respectively. All the data points were fitted with a single first order expression rather than multiple step-first order reactions [5]. The proposed degradation mechanism is given as follows.
The dye molecules adsorbed on the surface of the HAp and HAp/Ta nanostructures (catalyst) might be excited by UV–vis irradiation. The electrons from the excited state of the adsorbed dye move to the conduction band of HAp and HAp/Ta. After this, the photogenerated electrons and holes migrate to the oxide surface and react with chemisorbed super oxide anions (O2−) and form hydroxyl (OH·) radicals, which attack the dye molecules resulting in photodegradation.
The electronic state of the surface PO43− group is changed and the generation of trapped electrons creates oxygen vacancies in HAp under UV irradiation. This confirms that the phosphate group could be dissolved during the photocatalytic reaction because HAp is sparingly soluble at the pH of 6.5–7.5 [5]. The lattice oxygen also participates in the redox reactions that lead to the degradation of the dye. This means that the dissolved oxygen should be able to scavenge an electron at the surface of the catalyst (HAp), which results in the separation of photogenerated charges and reduces the recombination of generated electron-hole pairs, which leads to the formation of less P-OH radicals and super oxide (O2−) radicals [5]. These P-OH radicals may be the reason for the small decrease in the photodegradation rate of pristine HAp [5]. The generated super-oxide radicals oxidise the dye molecules and react with the water molecules and OH− ions and produce hydrogen peroxide. This further splits and produces .OH radicals which oxidise the pollutant molecules adsorbed onto the HAp as well as those present in the suspension [41].
HAp/Ta core–shell NRs exhibit higher photocatalytic activity than pristine HAp nanoparticles at all time intervals. Pure HAp shows 90% degradation at 9 h while HAp/Ta shows 98.83% degradation at 8 h. The irradiation times are nearly equal, but the observed degradation percentages are significantly different. This is due to the morphology change and SSA of HAp/Ta nanostructures. The metallic nature of Ta and the higher SSA of the prepared HAp/Ta are the main reasons for this significant difference. The higher metallic nature of Ta is confirmed from XPS analysis. A surface oxide layer is observed on the Ta shell, which plays a significant role in enhancing the catalytic activity. This is attributed to the catalytic nature of Tantalum; Ta is generally known as a catalyst which is used for several organic and inorganic reactions in the form of Ta2O5 [1, 2, 4, 6, 15]. Hence the prepared HAp/Ta shows a noticeably higher catalytic activity than pure HAp. The schematic representation of the possible reaction mechanism is given in figure 8. The photodegradation abilities of different forms of HAp are given in table 1.

Figure 8. Schematic diagram of degradation mechanism of irradiated (a) HAp, (b) HAp/Ta nanostructures by photo-chemical and photo-physical processes.
Download figure:
Standard image High-resolution image
Table 1. Comparison of photodegradation abilities of different forms of HAp.
| Dye | Degradation | |||||||
|---|---|---|---|---|---|---|---|---|
| S. No | Different types of HAp (catalyst) | Catalyst amount | Name | Concentration | Irradiation source (λ) nm | Initial time | Max. time | References |
| 1. | Bulk HAp (from waste mussel shells) | 2.0 g l−1 | Methylene blue | 5 mg l−1 | UV (254) | 54% (6 h) | 62% (24 h) | [5] |
| 2. | Pd/HAp/Fe3O4 | 0.25 g l−1 | Methyl red | 3, 5, 7 mg l−1 | UV 350–700 | — | 90% (various time & sample) | [23] |
| 0.75 " | Methyl orange | " | " | |||||
| 1.25 " | Methyl yellow | " | " | |||||
| 2.5 " | ||||||||
| 3. | HAp/Pt-H2PtCl4 | 13 mg | Methylene blue | 10 mg l−1 | UV 3.5 W; 300–400 | k = 0.00392 min−1 | k = 0.00282 min−1 | [24] |
| HAp/Pt-C10H14O4Pt | " | " | " | " | k = 0.00432 min−1 | k = 0.00405 min−1 | ||
| 4. | HAp/TiO2 nanocomposite | 2 g | Methyl orange | 0.1 mM | UV | Slow | >90% after 40 min | [41] |
| 5. | HAp/α-Fe2O3 nanocomposite | 10 mg | Methyl violet | 20 ppm | UV (365) | — | 90% (75 min) | [62] |
| 6. | HAp nest bundles | 0.025 g | Methyl violet | 2 ppm | UV (365) | — | 91.40% (210 min) | [63] |
| Methyl blue | " | " | — | 77.05% (210 min) | ||||
| Rhodamine B | " | " | — | 81.40% (210 min) | ||||
| 7. | Corn like nanostructured HAp (contains spherical HAp nano particles) | 25 mg | Turq blue GL | 15 ppm | UV (365) | 49% | 90% (9 h) | Present work |
| 8. | HAp/Ta core-shell nanorods | 25 mg | Turq blue GL | 15 ppm | UV (365) | 65% | 99% (8 h) | Present work |
As Ta exists in the metallic form with a surface oxide layer, it takes (HAp/Ta) more time, nearly equal to that taken by pristine HAp, to degrade the pollutants (dyes). However, the degradation is more than that caused by pristine HAp. During this long time reaction in aqueous system, the Ta in HAp may convert into some oxide form. The converted form shows higher degradation activity than pristine HAp at all time intervals. At the end of the experiment, the catalyst material was recovered by decanting the supernatant solution, washing with ethanol and drying at 100 °C in a hot air vacuum oven for 24 h. The reusability of the recovered catalyst was checked, and showed almost equal percentage of degradation up to 3 cycles. However, the change in experimental parameters such as catalyst amount, concentration of the dye solution, pH of the dye solution and use of sources of different UV wavelengths may cause a significant impact on the degradation of the dye.
4. Conclusion
In summary, pristine HAp and HAp/Ta core–shell nanorods were prepared successfully by a facile nanoprecipitation method without surfactants, ligands or chelating agents. The prepared nanomaterials were characterized systematically with the help of several precious analytical techniques. Electron microscopic (FESEM, TEM) analysis depicted a corn nanostructure consisting of spherical particles of size less than 15 nm for HAp, and a core–shell nanorod morphology with average length of 44 nm and width of 16 nm for HAp/Ta. The existing Ta in HAp/Ta is richly metallic and contains the oxide form on the surface of Ta layer. Both materials have mesoporous nature with pore sizes of 19.78 and 16.8 nm respectively for the HAp and HAp/Ta nanoparticles, which was confirmed by the BET-BJH sorption technique. In order to find the photodegradation activity of pure HAp and HAp/Ta for wastewater treatment to protect the environment, photocatalytic studies were performed, choosing the industrial dye -Turq blue GL as the model pollutant. At 0 h, the pristine HAp showed 49% of degradation and HAp/Ta core–shell nanorods showed 65% of degradation. On increasing the irradiation time, pristine HAp showed 90% degradation at 9 h and HAp/Ta core–shell nanorods showed 99% of degradation within 8 h. From the observed results, it is concluded that the HAp/Ta core–shell nanorods have a higher photodegradation capability on the dye than pristine HAp in the presence of UV light. HAp/Ta core–shell nanorods hence have the potential for use as nano photocatalytic materials for industrial wastewater treatment.
Acknowledgments
The authors would like to thank Postdoctoral Research Foundation of Jiangsu University of Science and Technology, Bharathiar University Research Fellowship (URF) and DST-PURSE, Govt. of India for providing FESEM and financial assistant.