

Abstract
Respiratory viral infections are considered a major public health threat, and breath metabolomics can provide new ways to detect and understand how specific viruses affect the human pulmonary system. In this pilot study, we characterized the metabolic composition of human breath for an early diagnosis and differentiation of influenza viral infection, as well as other types of upper respiratory viral infections. We first studied the non-specific effects of planned seasonal influenza vaccines on breath metabolites in healthy subjects after receiving the immunization. We then investigated changes in breath content from hospitalized patients with flu-like symptoms and confirmed upper respiratory viral infection. The exhaled breath was sampled using a custom-made breath condenser, and exhaled breath condensate (EBC) samples were analysed using liquid chromatography coupled to quadruplole-time-of-flight mass spectrometer (LC-qTOF). All metabolomic data was analysed using both targeted and untargeted approaches to detect specific known biomarkers from inflammatory and oxidative stress biomarkers, as well as new molecules associated with specific infections. We were able to find clear differences between breath samples collected before and after flu vaccine administration, together with potential biomarkers that are related to inflammatory processes and oxidative stress. Moreover, we were also able to discriminate samples from patients with flu-related symptoms that were diagnosed with confirmatory respiratory viral panels (RVPs). RVP positive and negative differences were identified, as well as differences between specific viruses defined. These results provide very promising information for the further study of the effect of influenza A and other viruses in human systems by using a simple and non-invasive specimen like breath.
Export citation and abstract BibTeX RIS
1. Introduction
Research on breath metabolomics is receiving increasing interest due to the recent COVID-19 pandemic [1]. Now more than ever, viruses can be considered a major societal-level threat, and current virology testing has become an important topic for researchers around the world. Understanding different testing approaches, virus transmission and host response to infection are crucial, as well as global immunization effects [2]. Numerous viruses can infect the human airway and cause common mild respiratory symptoms from the upper respiratory tract like fever, fatigue, sore throat, or runny nose. Sometimes symptoms are more severe, such as pneumonia or secondary bacterial infection of the lower respiratory tract. Common examples of these viruses are seasonal influenza (flu), human metapneumovirus (HMPV), rhinovirus (HRV) and enterovirus (ENT).
Influenza is caused by an RNA virus from the Orthomyxoviridae family and can be differentiated into three types: A, B, and C. Influenza A virus has numerous subtypes and a broad host range, being of particular concern as this virus has historically caused several pandemics [3, 4]. It is responsible for many hundreds of thousands of deaths every year, causing between 20 000 and 60 000 deaths in the US alone [4]. Flu virus is a highly contagious pathogen that causes respiratory infections requiring hospitalization, which can lead to life-threatening complications, deteriorated health status and frailty, especially for elderly people and immunocompromised patients [5]. Annual influenza outbreaks are mainly caused by subtypes of Flu A (H1N1 and H3N2) and influenza B virus, and the lack of pre-existing immunity in humans is often associated with the severity of the infection and increased mortality [6]. Annual immunization with trivalent or quadrivalent inactivated, recombinant, or live attenuated vaccines is the standard protection against influenza infection. These vaccines are minimally invasive and an inexpensive protective measure that creates antibodies, providing a protection against disease for approximately 40%–60% of vaccinated people [5, 7, 8]. The variable efficacy of the seasonal influenza vaccine is linked to several factors, such as antigenic changes over time (strain specific match is required each year), relatively slow manufacturing, short protection time, strain egg-adapted changes, and low immunogenicity in certain populations [9, 10].
An early and accurate diagnosis of influenza infection, ideally prior to the onset of symptomatic disease, could result in improved medical care by decreasing the inappropriate use of antibiotics and encouraging specific antiviral therapy when appropriate [11]. Since many viruses can cause respiratory tract infection, it is important to develop easy and reliable diagnostic platforms to detect specific viruses. The gold standard laboratory tests are viral culture, serologies, and reverse transcription polymerase chain reaction (RT-PCR) [12]. RT-PCR is highly sensitive, quick, and easily to incorporate into multiplex assays for several viruses. Serology tests are easier to perform but may be limited by the fact that blood antibodies appear later during the disease course. Additionally, point-of-care (POC) diagnosis are commonly required for a rapid evaluation. These are rapid antigen tests that can be run in a physician's office, with lower costs, but also low and variable sensitivity, although improved POC digital immunoassays have shown improved sensitivity in detecting influenza A and B virus infections [13]. In any case, reliable results depend on the quality of the specimen.
Viruses rely on the host metabolic processes to propagate, which is different than bacteria that have their own metabolism pathways. Thus, detecting viral infections often requires direct evidence of the virus in a bodily fluid sample [2]. Virus infected specimens from the respiratory tract can be sampled in several ways. Oropharyngeal and nasopharyngeal swabs or washings/aspirates are preferable for upper respiratory infection, whereas expectorated sputum and bronchoalveolar lavage (BAL) are used to get lower respiratory tract samples. Some of these sampling techniques may be uncomfortable (e.g. nasopharyngeal swabs often provoke sneezing or coughing) and can be somewhat invasive (e.g. blood or BAL) [14]. The use of alternative collection techniques and specimens is of great interest. Influenza is primarily transmitted via exhaled breath aerosols and droplets, and exhaled breath condensate (EBC) is a promising candidate for a safe and efficient diagnosis of a disease. Breath is sampled from the end tidal volume deep in the lungs, potentially including metabolites representing both upper and lower tract viral infection information [12, 14–16]. Various breath sampling devices have been used to collect biomarker compounds that represent the host response to infection—and not the virus itself. Instruments are specific to either the gas phase volatile organic compound (VOC) breath samplers (e.g. Tedlar bags, bottles and Tenax cartridges) or to EBC condensers (e.g. RTube, TurboDECCS, and EcoScreen) [17].
Human exhaled breath basically consists of VOCs, non-volatiles, and aerosols. Some of those compounds can only be detected when produced by the infected host cells or as a result of immunologic defense mechanisms [3]. In recent years, numerous studies have used exhaled breath to detect different pathological condition showing changes in the volatile fraction. For example, infected cells with influenza and other viruses showed changes in the VOC profiles that were emitted by subjects [18] and in vitro [2, 19–23], or VOCs related to oxidative stress were evidence of early diagnosis of viral infections from subjects before-and-after receiving live attenuated influenza vaccine [11, 24]. However, VOCs are not the only breath fraction to play an important role in the diagnosis of viral infections. Both EBC and breath aerosols contain semi- and non-volatile metabolites that can be exploited for non-invasive diagnostics, such as a wide range of larger molecules, proteins, metabolites, smaller polar compounds, cellular fractions, fatty acids, cytokines, bacteria, and viruses that cannot be detected on the gas-phase breath [25, 26].
EBC allows the detection of the above biomarkers that originate from both the lower airways due to surfactant disruption and the upper airways by turbulence [26]. These metabolites represent a wide spectrum of larger biomolecules, and subsets of the biomarkers have correlated with various chronic airway diseases, such as cystic fibrosis, asthma and chronic obstructive pulmonary disease (COPD) [27]. It is possible that these potential prognostic biomarkers can play a role in a differential diagnosis that could be key to predict disease outcome. Also, understanding the breath metabolomic profile could detect changes that distinguish specific infections in the respiratory tract, like the one caused by influenza virus [28, 29]. These microbiome alterations are likely to cause metabolite changes that could be detectable in EBC, either caused by the same pathogens during infection, presumably through host immune responses [12, 30]. For instance, some studies have showed the release of pro-inflammatory cytokines [31] or elevated levels in oxidative stress biomarkers [24] from patients post-infection by influenza. Other metabolomic studies have showed that many viruses like influenza A require fatty acid synthesis for replication or the production of infectious virus particles [32, 33]. However, little information is available on the response of these breath biomarkers to influenza vaccination [8], and influenza immunization can induce some degree of systemic inflammation as part of the immune response, showing influenza-like symptoms that develop early and resolve quickly [31, 34]. Moreover, the overlapping symptoms and heterogeneity of influenza-like viral infections require new methods for discovery and validation of novel microbial metabolites that are generated during airway microbiota shifts [35].
In this pilot study, we characterize this metabolic composition from human EBC for an early diagnosis and differentiation of an influenza viral infection. For that, we first studied the effects of planned seasonal influenza vaccines on EBC from healthy subjects after receiving the immunization. Then, we investigated changes in breath content from hospitalized patients with flu-like symptoms and confirmed upper respiratory viral infection. In both studies, breath samples were collected using a custom-made breath condenser [17], and EBC samples were analysed using liquid chromatography coupled to quadruplole-time-of-flight mass spectrometer (LC-qTOF). Metabolomic information was collected and treated using simultaneous targeted and untargeted strategies to cover specific known inflammatory and oxidative stress biomarkers, as well as a large number of unknown metabolites.
2. Material and methods
2.1. Clinical study
This research followed clinical practices and protocols approved by the University of California, Davis Institutional Review Board (IRB Protocol #637013-15). For this, informed consent was signed by all the participants in the study.
2.1.1. Effects from the influenza vaccine
Each subject was defined as his/her own control to minimize confounding biologic variables. Breath metabolites were measured and compared just before and after the vaccination: on day 0 prior to the flu-shot, and then on the days 1, 2 and 3 after the immunization. EBC samples were collected during two flu seasons from a total of 12 healthy human subjects (five subjects in 2018, seven subjects in 2019). Subjects were adults (over 18 years old), non-smokers with no recent history of viral infection or lung disease. The mean age from all subjects was 34 years (SD = 7.8) with an even number of male/females (6/6). All subjects were treated with a single dose of a quadrivalent inactivated flu liquid vaccine injected intramuscularly. No adverse effects were reported by any of the subjects, either of influenza vaccination or the breath collection procedure.
2.1.2. Patients with respiratory infection
The patients included as eligible in this study were adults that were admitted into the hospital after physician's determination of upper respiratory infection symptoms. Information about race, ethnicity, tobacco and food/beverage consumption, asthma diagnosis and any medication consumed was collected. Patients had to avoid eating, drinking and smoking at least 1 h before the sample collection. In some of the cases, a preliminary POC flu test was previously used for a rapid evaluation of the patient. But, according to hospital policies, a nasopharyngeal swab was used after all the patient's admission to perform a respiratory viral panel (RVP; GenMarkDx®). RVP consisted of a PCR-analysis of nasal swab (BD Universal Viral Transport, Beckton, Dickinson and Co, Sparks, MD or Miraclean Technology Co, Ltd, Shenzhen, China) samples collected and transported by Universal Transport Media (BD Universal Transport Medium, Beckton, Dickinson and Co, Sparks, MD, or remel MicroTest™ M4RT® Transport, ThermoFisher Scientific Inc.) for specific viruses including influenza A, HMPV, and HRV/ENT. HRV/ENT were not distinguishable by the used RVP. All patients were asked to participate in the study and responded to a short questionnaire regarding asthma pre-diagnosis, other diseases, or medications, as well as recent food/drink consumptions.
A total of 15 subjects (4 males and 11 females) with respiratory infection symptoms admitted to the hospital and one control sample (female with no symptoms) were included in the study. The subjects' average age was 41 years old (SD = 19). Information is summarized in table 1.
Table 1. Clinical data from patients included in the respiratory infection study.
| Variable | Total | Age (SD) |
|---|---|---|
| Patients | 15 + 1 a | 39.7 (20) |
| POC flu test | 4 | 52 (15) |
| RVP positive | 7 | |
| Flu A | 2 | 48 (11) |
| HMPV | 2 | 48 (41) |
| HRV/ENT | 3 | 40 (19) |
| Asthmatic | 9 | 31 (14) |
| EBC samples | 16 | |
| Ethanol rinse samples | 14 |
a Control subject with no respiratory infection symptoms.SD: standard deviation; POC: point-of-care flu test.RVP: Respiratory viral panel; FluA: Influenza A; HMPV: Human Metapneumovirus; HRV/ENT: Rhinovirus/Enterovirus.
From the 15 admitted subjects, only five were tested with POC flu test, resulting in four positives. All patients went through RVP and only seven were positive, being two of them characterized by Influenza A virus, two with HMPV and three HRV/ENT. Two of the patients with confirmed POC flu positive resulted negative in virus infection for RVP tests (more accurate). Nine of the subjects had diagnosed asthma and were nonsmokers, except for two patients.
2.2. Infection virus analysis—RVP
POC consisted of a test utilizing a nasal swab (BD Universal Viral Transport, Beckton, Dickinson and Co, Sparks, MD or Miraclean Technology Co, Ltd, Shenzhen, China) placed in a transport solution (BD Universal Transport Medium, Beckton, Dickinson and Co, Sparks, MD, or remel MicroTest™ M4RT® Transport, ThermoFisher Scientific Inc.) and analyzed on a Cobas® Liat® (Roche Diagnostics) or GenMark Dx® (GenMark Dx®) molecular analyzers.
Samples were defined by RVP results. RVP consisted of a panel of analysis where the potential viral infection was tested by taking a deep nasopharyngeal swab applying and performing PCR-tests specific for Influenza-A, HMPV, and HRV/ENT. The negative predictive value of these tests is reported to be between 96.1% and 99.8% depending on virus prevalence in the community [36].
2.3. Breath sampling
In both studies, breath collection was achieved by using a custom EBC sampler previously used and described in several studies [17, 37, 38]. In summary, subjects breathed tidally for 15–20 min through a disposable valved mouthpiece (no nose clip) connected to a trap that separates saliva and larger contaminants. The trap is attached to a glass tube surrounded by dry ice at −80 °C, achieving temperatures that condensate the exhaled breath in the tube. When the collection is done, the EBC is retrieved from the tube and stored in a 10 ml vial at −80 °C until analysis.
In the study with respiratory infection subjects, an additional sample was collected once the EBC was removed from the device (ethanol rinse sample). The glass tube was rinsed with 2–3 ml of organic solvent (ethanol) and mixed during 1 min, providing two fractions (EBC and ethanol rinse) for each subject. EBC complementary information can be achieved with this fraction by cleaning the device obtaining sample richer on compounds with low polarity that stick to the glass sampling surface.
2.4. Sample preparation
EBC samples were thawed and 1 ml (or the maximum amount available, if less than 1 ml) was aliquoted in 2 ml glass amber vial. Same amount was used for the ethanol rinse fraction. Antioxidant solution and a mixture of internal standards (IS) were added to both solutions, EBC and ethanol rinse. Antioxidant solution consisted of butylated hydroxytoluene (BHT) and EDTA at 0.2 mg ml−1 each in a solution of methanol:water (1:1), and IS contained a mixture of deuterated oxylipins. Spiked EBC samples were mixed and frozen for 30–60 min at −80 °C. Frozen EBC samples were lyophilized and ethanol rinse samples were dried with nitrogen, both, until completely dry. Dried extracts were reconstituted with 60 µl of mobile phase (95% water in acetonitrile), vortexed, sonicated for 10 min at 4 °C and centrifuged at 13 000 rpm for 10 min at 4 °C. Supernatant was stored at −80 °C until LC-MS analysis.
Pooled quality controls (QCs) were also prepared with each batch of samples by mixing healthy matrices and spiking it with known concentrations of oxylipins standard mix (targeted compounds). QCs, and non-spiked samples (QC blank) were prepared following the preparation process for all samples. Targeted compounds used are reported elsewhere [38] with names, molecular formulae, exact masses, LC-MS retention times and preferred precursor ions used for MS/MS data. Mainly, we were interested in the compounds related to inflammation and oxidative stress, which are involved in cyclooxygenase (e.g. prostaglandins and thromboxanes), lipoxygenase (e.g. 5-, 12-, 15-HETE, leukotrienes, DiHETEs, HEPE, etc), and cytochrome P450 (e.g. HETEs, EETs, DiHOMEs, etc) pathways.
2.5. Instrumental analysis
All samples were analyzed with an Agilent 1290 series HPLC system coupled with an Agilent 6530 quadrupole-time of flight (qTOF) mass spectrometer (Agilent Technologies, Santa Clara, CA, USA). Twenty micro liters of sample were injected into the column using an autosampler at 5 °C. An InfinityLab Poroshell 120 EC-C18 column (3.0 mm × 50 mm, 2.7 µm) (Agilent Technologies, Palo Alto, CA, US) held at 35 °C was used to separate compounds at a flow rate of 600 μl min−1. Compound separation was achieved using gradient of solvent, with water (A) and acetonitrile (B), both with 0.1% formic acid during a total run time of 30 min.
An Agilent Jet Stream nebulizer was used as electrospray ionization (ESI) source. Samples ran twice, one in positive and one in negative ESI mode, with mass ranges of 60–1000 and 100–970 m z−1 for positive and negative, respectively. It was operated at 250 °C with ionization set at 3000(+)/4000(−) V and fragmentor voltage at 130 V. Nebulizer gas pressure, temperature and drying gas flow rate were set at 45 psi, 400 °C and 10 l min−1. Mass measurements were recalibrated using Agilent reference masses m/z 121.0508 and 922.0098 in positive mode, and m/z 119.0363 and 966.0007 in negative mode. In both cases, all ions MS/MS was performed at collision energies of 0 and 15 V. Mass spectra were acquired at a scan rate of 2 spectra/s.
2.6. Data analysis
The data analysis process was divided in two strategies: targeted and untargeted approaches. Targeted and untargeted information were acquired simultaneously in a single LC-MS run in negative mode. Positive mode only was treated for untargeted purposes. Preliminary raw data require an initial check for qualitative reasons with Agilent's Mass Hunter Qualitative Analysis B.06.00 software.
For targeted purposes, data was treated with Agilent's Mass Hunter Quantitative (qTOF) Analysis B.07.00 software, and compounds were identified, confirmed, and integrated using accurate mass, retention time and MS/MS information. All detected compounds were quantified using standard calibration curves and correcting their responses by corresponding surrogates. QCs were quantified to determine the validity of the calibrations.
For untargeted analysis, data were deconvoluted, aligned and integrated using Agilent's Mass Hunter Profinder B.08.00 software. Initial peaks were found using 30 ppm and 0.025 Da mass tolerance, and retention time window of 0.3 min. Generated data (.pfa) was imported to Agilent's Mass Profiler Professional (MPP, V13.0) software for re-alignment and initial identification. MPP generates datasets used for statistical purposes, with samples in columns and variables (called features) in rows, like targeted data, but containing peak areas instead of concentrations. To obtain reliable data, samples were randomly injected on the LC-MS, and QCs and IS signals were checked for a correct data analysis. Raw datasets were cleaned by removing features that: appear in blank samples with signals higher than 10 (peak sample/blank ratio), are missing in more than 50% of samples, have low repeatability (RSD >25% in the QC pooled samples), and have near-constant values (RSD <5% in all samples). Data were normalized to remove systematic bias between sample measurements using different approaches: by specific factor, such as sample volume, IS area, or combination of volume/IS, and by sum or median values of all features for each sample. All missing values were also replaced by the LOD/5 or by minimum positive value divided by 5, in targeted and untargeted data, respectively. Final datasets were log transformed to correct data heteroscedasticity [39]. Although, all data were initially studied separately from positive and negative mode perspective, results for untargeted approaches were considered using merged datasets from both ionization modes.
Targeted and untargeted datasets were analyzed using univariate and multivariate techniques using Excel, MATLAB R2017a and PLS Toolbox V8.6.2 software. First, descriptive univariate analyses were performed by comparative analyses of means to assess the significance of the changes using fold change (FC) and parametric/non-parametric tests like t-tests/Wilcoxon rank sum test, or ANOVA/One-way Kruskal–Wallis test. These tests allow to determine features that explain the groups aimed to differentiate by using Volcano Plots, where features with p-values less than 0.5 (FDR adjusted values Bonferroni correction) and FC values higher than 2 show statistical difference. An initial variable selection was applied on untargeted datasets using univariate methods. Then, multivariate models were used for comparative analyses. Principal component analysis (PCA) is initially used to obtain an overview of large datasets, visualize similarities and differences between observations, detect potential outliers and gain information about the metabolite features responsible for the observed patterns. PCA is a projection of maximum variance in the dataset based on the magnitudes of orthogonal variables. PCA is a linear additive model, where each principal component (PC) is an orthogonal variable that ranks the variance of each metabolite in the multivariate dataset, and accounts for a portion of the total variance. PCs data is used to reduce the dimensionality of the data set. Partial least-squares discriminant analysis (PLS-DA) is a classification method, where PLS models the correlation between the dataset of features and a matrix of responses that contains sample information and classes/groups. PLS models a maximum covariance between metabolomics datasets and the defined class membership, separating different groups of samples on the basis of their metabolite features [40, 41]. Sensitivity (probability of correctly detect a condition), specificity (ability to reject a condition) and area under the curve (AUC) values of the receiver operating characteristic (ROC) curves were defined as parameters to describe model results. AUC measures the classification problems at different thresholds, telling how much a model is capable to distinguish classes or groups [42]. Additionally, other chemometric methods were tested to enhance results, such as support vector machines (SVMs) that separates clusters using a hyperplane; and eXtreme Gradient Boosting (XGBoost), a form of gradient-boosted decision trees [43].
PLS-DA provides a list of potential markers related to condition and other relevant biological information, ranked by variable importance in projection (VIP) values, which summarize the contribution of each feature makes to the model. VIPs higher than 1 are considered relevant markers and, the next step, was to attempt an identification of these molecules. Identifications were performed searching through METLIN database and using accurate mass information to calculate a molecular formula and a compound name for each marker. Matching experimental and theoretical spectral pattern (scores) compounds were tentatively characterized when score values were higher than 70%.
3. Results and discussion
3.1. Effects from the influenza vaccine
3.1.1. Targeted analysis
Targeted analysis showed low concentrations of the compounds we were pursuing. Most of the compounds were detected closer to the limit of detection (LOD) defined by the method. Only 21 compounds out of 55 showed enough concentrations above LOD on more than 50% of the samples. 9(10)-EpOME and 12(13)-EpOME were found at higher concentrations, with an average amount of 0.18 and 0.25 ng ml−1, respectively. 9-HODE and 13-HODE followed with amounts around 0.1 ng ml−1. All detected compounds were corrected by IS and amount of EBC used in sample preparation step.
When data are compared by pre (day 0) and post (days 1, 2 and 3) flu shot days, we only found significant differences for 13-HODE (p < 0.05). Figure 1 show concentrations achieved each day of the study for this compound (figure 1(a)), where mean values show and increasing of 13-HODE the day after the vaccine, and then progressively decreasing until day 3. Boxplots explain differences pre vs. post, considering different days after flu shots. In general, there are differences between pre and post, when considered days 1–3 together, but no differences from prior concentrations (day 0) and days 1 and 2, individually. Day 3 show clear differences of 13-HODE decreasing compared to initial levels. 13-HODE is an intermediate product from linoleic acid lipoxygenation, and it prevents cell adhesion to endothelial cells and can inhibit cancer metastasis [44].
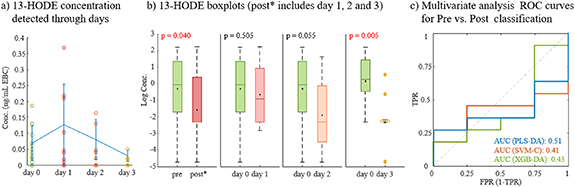
Figure 1. Targeted results from flu vaccination effects. (a) Concentration of 13-HODE detected through the days analyzed; (b) Boxplots comparing concentrations of 13-HODE at different days, considering pre (day 0), and post* (days 1, 2 and 3); and (c) ROC curves obtained from multivariate analysis using all targeted compounds detected. ROC curves compare AUC for different classification methods: PLS-DA, SVM-C and XDB-DA.
Download figure:
Standard image High-resolution imageSurprisingly when using a multivariate approach, good classifications were not possible. An initial PLS-DA show low discrimination between compounds detected in EBC before flu shot (pre) and after it (post). We considered classifications with three post days merges and individually, and AUC values lower than 0.6 and sensitivities and specificities around 50% (data not shown). Other classification methods were applied, such as SVM-C and XGB-DA, but AUC < 0.5 were achieved in both cases (figure 1(c)).
3.1.2. Untargeted analysis
Initial raw datasets contained 3875 and 6176 features for negative and positive modes, respectively. After data processing, the number of features was reduced around 50%, and samples were normalized by the volume of EBC used and responses of IS. Both ionization modes were then merged into a dataset with 5448 features. First, a PCA was applied to check and visualize data distribution (figure 2). It could be observed that main differences were clearly explained by sample flu season (figure 2(a)), which makes sense since as the components of the flu vaccine change each season. This seasonal variation was corrected by subtracting median values per each season. After season correction, PCA showed high reduction of seasonal differences (figure 2(b), (I)) and, when coloured by pre- and post-vaccination, it started showing a slight differentiation of some of the samples prior the shot (figure 2(b), (II)).

Figure 2. Scores plots from principal component analysis (PCA) of the untargeted data from flu vaccination effects. (a) non-corrected dataset; (b) dataset after correction by season of flu vaccine showing samples by season (I) and by pre and post flu shot (II).
Download figure:
Standard image High-resolution imageCorrected data were then filtered by an initial variable selection based on differences from prior flu shot (pre/day 0). For that, volcano plot was used and variables with p-values higher than 0.05 and FC < 2 were removed. Noise and unwanted features were reduced around 90%, and these new datasets were used to predict specified classes using PLS-DA. A second feature selection was applied by selecting variables with VIP values higher than 1. This new data were then used to build final PLS-DA models and find main differences between pre vaccination and the posterior days after the shot (table 2). To get accurate results, 25 PLS-DA iterations were run using random split data between calibration and validation sets (66% samples in calibration set). Model iterations got average and standard deviation values for AUC, sensitivity, and specificity, both for cross-validation (CV) and prediction (Pred).
Table 2. PLS-DA classification results presented as average and standard deviation (SD) of 25 random splits of calibration and prediction data.
| Classification | AUC | Sens (CV) | Spec (CV) | Sens (Pred) | Spec (Pre) |
|---|---|---|---|---|---|
| Pre vs. post (day 1, 2 and 3) | 0.94 (0.06) | 0.84 (0.08) | 0.90 (0.07) | 0.80 (0.15) | 0.89 (0.18) |
| day 0 vs. day 1 | 0.99 (0.03) | 0.89 (0.13) | 0.91 (0.08) | 0.93 (0.15) | 0.91 (0.16) |
| day 0 vs. day 2 | 0.94 (0.08) | 0.87 (0.11) | 0.95 (0.10) | 0.82 (0.21) | 0.89 (0.15) |
| day 0 vs. day 3 | 0.97 (0.12) | 0.80 (0.14) | 0.89 (0.10) | 0.82 (0.27) | 0.91 (0.21) |
AUC values were higher than 0.9 in all models, with low variability for models including all days or individual days for post vaccination samples. Sensitivities and specificities were also over 0.8 in all cases, with low standard deviations.
Figure 3 shows four PLS-DA models grouping of samples that have differences by injection day considering: all post vaccine days together (figure 3(a)), and individual-day differences between day 0 (before flu shot), and day 1 (figure 3(b)), day 2 (figure 3(c)), and day 3 (figure 3(d)). A clear separation was observed in all models, with samples before flu shot (figure 3, green dots) clustered and separated from samples collected after the flu shot (figure 3, reddish dots). These optimal models allowed a final identification of the features that explain these differences in EBC metabolomic profile between pre and post flu vaccines. A total of 220 features were determined as important (VIP > 1), being 98 compounds the ones for the pre vs. post model (model A), then, 58, 54 and 99 features were found relevant for the differentiation between day 0 and day 1 (model B), day 2 (model C), and 3 (model D), respectively. Table 3 summarize 25 these main biomarkers found in all the prediction models. It describes the ESI mode detected, molecular formula and compound tentative identification with a score value, that corresponds to a percentage of matching between experimental spectra and the one from METLIN database. Only formulas and IDs were listed with score values higher than 70%. Some characterizations gave high scores for multiple compounds. The regulation based on post vaccine effect is also described, as well as the model where these biomarkers were highlighted as remarkable for the differentiation.

Figure 3. Scores plots from PLS-DA of the untargeted data from flu vaccination effects. Classifications obtained between (a) pre (day 0) and post (day 1, 2, and 3); (b) day 0 and day 1; (c) day 0 and day 2; and (d) day 0 and day 3.
Download figure:
Standard image High-resolution imageTable 3. Chemical identification of main biomarkers that explain EBC differences between pre and post vaccine shot.
| Model | ||||||||||
|---|---|---|---|---|---|---|---|---|---|---|
| # | ESI | Molecular formula | Compound ID | Score (%) | Post-regulation | A | B | C | D | Family |
| 1 | + | C9 H15 N O2 | No ID | — | down | x | x | x | x | — |
| 2 | – | C13 H22 O2 | Tridecynoic acid/Tridecadienoic acid/Linalyl propionate | 85.1 | up | x | x | x | x | Fatty acyls |
| 3 | + | C14 H32 N7 | No ID | — | down | x | x | x | x | — |
| 4 | + | C18 H34 O4 | HpOME/9,10-DiHOME | 90.72 | down | x | x | x | x | Fatty acyls (oxylipins) |
| 5 | + | C11 H22 | Undecene/6-methyl-4E-decene/trimethyl Octene/dimethyl-2-propylcyclohexane/1-butyl-2-ethylcyclopentane | 86.87 | down | x | x | x | Hydrocarbons | |
| 6 | – | C10 H13 N O3 | Homotyrosine/L-Tyrosine methyl ester/Damascenine/Benzyl Serine/n-acetyldopamine | 87.16 | down | x | x | x | Amino acids | |
| 7 | – | C17 H25 N O2 | MGK 264/Magellanine/Lycoflexine/Meradimate | 88.58 | down | x | x | x | — | |
| 8 | + | C15 H18 O8 | p-Coumaroyl-D-glucose/trans-o-Coumaric acid 2-glucoside | 81.03 | down | x | x | x | Coumaric acid derivatives | |
| 9 | + | C21 H22 O4 | Licoagrocarpin/Gancaonin X/Archangelin/ 4'-Hydroxyisoderricin/2'-O-Methylglabridin | 81.98 | up | x | x | x | — | |
| 10 | + | C29 H60 N O7 P | LysoPE(24:0/0:0)/LysoPE(0:0/24:0) | 98.15 | down | x | x | x | Lysophospholipid | |
| 11 | – | C41 H76 N2 O15 | Roxithromycin | 91.61 | down | x | x | x | Macrolide antibiotic | |
| 12 | + | C12 H21 N | No ID | 97.72 | down | x | x | x | — | |
| 13 | + | C10 H12 N4 O5 S | No ID | — | up | x | x | x | — | |
| 14 | – | C18 H37 N O3 | (4OH,8Z,t18:1) sphingosine/6-hydroxysphingosine/Dehydrophytosphingosine | 98.05 | down | x | x | x | Sphingoid | |
| 15 | + | C25 H44 N8 O10 | Lys-Gln-Ala-Gly-Asp-Val | 71.1 | down | x | x | x | Peptide | |
| 16 | + | C10 H16 N2 O2 | 2-Isopropyl-3,5-dimethoxy-6-methylpyrazine / L-a-Amino-1H-pyrrole-1-hexanoate | 99.81 | down | x | x | x | Amino acids | |
| 17 | + | C15 H26 O3 | Lubiminol/8-Hydroxy-4(6)-lactarene-5,14-diol/7-Drimene-11,12,14-triol/Kessyl glycol/formyl 7-oxo-11E-tetradecenoate | 98.13 | down | x | x | x | — | |
| 18 | + | C17 H27 N O2 | (5R,E)-6-((8S,Z)-8-Hydroxy-8-methylhexahydroindolizin-6(5)-ylidene)-2,5-dimethylhex-2-enal/Padimate O/Terbucarb | 91.83 | down | x | x | x | — | |
| 19 | + | C17 H29 N O4 | No ID | — | down | x | x | x | — | |
| 20 | – | C34 H50 O9 | Avermectin B2a aglycone/Avermectin A2b aglycone | 75.73 | down | x | x | x | Lactone derivatives | |
| 21 | + | C18 H32 O4 | γ- 6,7-DiHODE/γ- 9,10-DiHODE/γ- 12,13-DiHODE/13-HpODE/9-HpODE/9-hydroxy-10-oxo-12-octadecenoic acid | 86.18 | down | x | x | Fatty acyls (oxylipins) | ||
| 22 | + | C16 H26 O5 | 13,14-Dihydro-15-keto-tetranor PGE2/13,14-dihydro-15-keto-tetranor PGD2/Tetranor-PGE1/Tetranor-PGD1 | 81 | up | x | x | Prostaglandins | ||
| 23 | + | C27 H42 F2 O4 | (6RS)-6,19-epidioxy-24,24-difluoro-25-hydroxy-6,19-dihydrovitamin D3 | 79.11 | down | x | x | Vitamin D3 derivative | ||
| 24 | – | C27 H45 O8 P | 2-deoxyecdysone 22-phosphate | 90.5 | down | x | x | Sterols | ||
| 25 | – | C18 H28 O6 | 2,3-Dinor-6,15-diketo-13,14-dihydro-PGF1a/2,3-Dinor-6-keto-PGF1a/11-dehydro-2,3-dinor-TXB2 | 91.18 | down | x | x | Prostaglandins and thromboxanes | ||
ESI mode positive (+) and negative (−).No MF: no molecular formula; No ID: No compound identification.Model A: pre vs post (including day 1, 2, and 3); B: day 0 vs. day 1; C: day 0 vs. day 2; and D: day 0 vs day 3.x: compound with VIP > 1 in that model; x: compound with VIP > 1 in that model and fold change values higher than 50.
Figure 4 shows up- and down-regulation profiles of some of the compounds from table 3. It presents the evolution of the compound abundances (after normalization) through each day after the vaccine (left graphs) and through all responses after vaccination together (right graph, pre/post). From all the 220 compounds, only 20% were up-regulated, meaning that their abundances increased after getting the vaccine (figure 4(a)). Some were identified as fatty acyls or prostaglandins (compounds 2 and 22), molecules commonly related to metabolomic processes associated to pro- and anti-inflammation and oxidative stress. However, most of the compounds were down-regulated, with signal reduction after the flu shot was administered (figure 4(b)). That was the case of known oxylipins, such as DiHOMEs or DiHODEs (compounds 4 and 21), associated to lipoxygenase and cytochrome P450 pathways. Amino acids (compounds 6 and 16) and other prostaglandins or thromoboxanes (compound 25) also showed decreasing in EBC content. Although most of these compounds showed same up or down-regulation for each of the three days after the shot, some compounds only showed significant differences just one of the days. For example, compound 25 showed VIPs > 1 and reduced signals for days 2 and 3, but and increasing signal (although non-significant with VIP < 1) on day 1, making it not remarkable for the general mode defining pre vs. post differences.
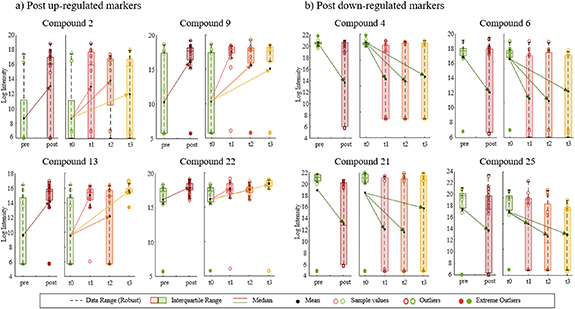
Figure 4. Examples of up- and down-regulations for some of the compounds that explain differences before and after flu vaccine. Post up-regulated markers (a) show an increase in EBC abundance once the flu shot was administered; and Post down-regulated markers (b) show a reduction of signal after the flu shot. Right graphs for each compound represent evolution of the abundances through the days; and left graphs represent a general difference between pre and post vaccine (including days 1, 2, and 3).
Download figure:
Standard image High-resolution image3.2. Patients with respiratory infection
3.2.1. Targeted analysis
In this study, only ten compounds showed concentrations detectable over the LOD of the method. From those compounds, lipoxin A4 (LXA4), prostaglandin J2 (PGJ2), 12(13)-EpOME and 9(10)-EpOME were detected at higher concentrations, around 2 ng ml−1 of EBC, in some of the samples. 14(15)-DiETE and 9(10)-DiHOME reached amounts over 1 ng ml−1. Compounds were studied by RVP results and type of virus detected in the viral panel (figure 5).

Figure 5. Targeted results from respiratory infections in patients. (a) Concentrations of detected compounds with significant differences by RVP positive/negative results (left), and by type of virus detected by RVP (right). (b) ROC curves obtained from multivariate analysis using all targeted compounds comparing AUC for different PLS-DA models: negative vs. positive RVP (–); and type of virus (−).
Download figure:
Standard image High-resolution imageSignificative differences between negative and positive viral panel results were only found for LXA4 amounts (p = 0.018) (figure 5(a), left) [45]. However, when these differences were studied by the type of virus defined in the positive samples, we could observe that influenza A virus showed main differences compared to control or negative samples. That also happened for three of the compounds: LXA4, PGJ2 and 9,10-DiHOME (figure 5(a), right), suggesting that positive differences were mainly explained by the samples characterized by FluA. When all compounds were studied in a multivariate way we could confirm that trend (figure 5(b)). PLS-DA models separating positive and negative RVP samples were not able to achieve discriminating abilities, with AUC around 0.5 and sensitivity and specificity lower than 0.6 (dashed line). However, models that classified virus types, although the overall model ability was not reliable (non-dashed lines), were able to discriminate Flu A from the rest of samples with AUC around 0.9, but not the rest of the viruses.
3.2.2. Untargeted analysis
Similar data pre-processing to pre/post vaccination was applied to untargeted data obtain from patients with respiratory infections. Almost half of the raw data were cleaned, and the merged dataset listed 8092 features, containing variables from positive and negative modes. In this case, the dataset was normalized just by the initial volume of matrix used for the analysis, including EBC and the ethanol rinse fractions in the same dataset. Variable selection was then applied based on the differences between RVP results, and between the specific virus detected in the clinical tests. P-values and fold change information was used to initially reduce features and remove noise from the datasets. RVP data (1723 features) was focused on differences between positive and negative results, and virus dataset (3029 features) was aimed on distinguishing influenza A, HMPV, rhinovirus/enterovirus, and non-virus. Relevant features were subsequently selected using VIP values from initial PLS-DA models. All PLS-DA iterations were built 50 times using random split between calibration and prediction datasets (table 4). Table 4 shows the increasing classification abilities, such as AUC, sensitivity and specificity values, once feature selection was applied using VIP scores.
Table 4. PLS-DA classification results before and after variable selection. Values presented as average and standard deviation (SD) of 25 random splits of calibration and prediction data.
| Virus | ||||||
|---|---|---|---|---|---|---|
| # features | RVP | FluA | HMPV | HRV/ENT | None | |
| AUC | 1723 | 0.86 (0.13) | 0.94 (0.14) | 0.64 (0.34) | 0.67 (0.35) | 0.81 (0.15) |
| 202 | 0.98 (0.50) | 1.00 (0.01) | 0.83 (0.14) | 0.96 (0.05) | 0.93 (0.07) | |
| Sens (CV) | 3029 | 0.83 (0.10) | 0.50 (0.41) | 0.23 (1.13) | 0.34 (0.75) | 0.69 (0.21) |
| 322 | 0.98 (0.03) | 0.82 (0.22) | 0.44 (0.70) | 0.61 (0.35) | 0.78 (0.15) | |
| Spec (CV) | 3029 | 0.78 (0.12) | 0.99 (0.03) | 0.83 (0.12) | 0.80 (0.14) | 0.68 (0.14) |
| 322 | 0.97 (0.04) | 0.99 (0.02) | 0.85 (0.11) | 0.89 (0.11) | 0.85 (0.08) | |
| Sens (Pred) | 3029 | 0.80 (0.19) | 0.73 (0.56) | 0.32 (0.99) | 0.42 (0.86) | 0.70 (0.27) |
| 322 | 0.96 (0.07) | 0.89 (0.31) | 0.63 (0.45) | 0.74 (0.39) | 0.80 (0.16) | |
| Spec (Pre) | 3029 | 0.74 (0.27) | 1.00 (0.02) | 0.85 (0.16) | 0.82 (0.18) | 0.73 (0.27) |
| 322 | 0.93 (0.14) | 0.99 (0.03) | 0.87 (0.12) | 0.93 (0.11) | 0.88 (0.13) | |
RVP classifications achieve AUC around 0.86 but raise to 0.98 when VIP > 1 variables are selected (table 4). Sensitivities and specificities raised from 0.74 to 0.83 to more than 0.9 with low standard deviations. Figure 6 showed optimal PLS-DA models built with the final selected features.
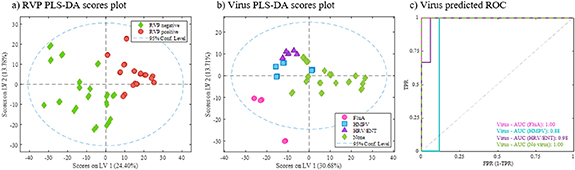
Figure 6. PLS-DA models for untargeted data from subjects with respiratory infections. Models built with final selection of variables. (a) Scores plot from RVP positive and negative classification, (b) scores plot from virus type classification, and (c) ROC curves for virus differentiation model.
Download figure:
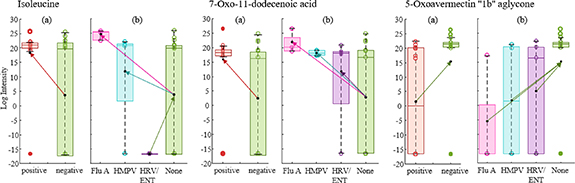
Standard image High-resolution imageClear differences were observed between RVP positive and negative samples (figure 6(a)). In that case, 90 features determined the classification (VIP > 1) with almost 50 of these with high score values for tentative identifications. Table S1 (available online at stacks.iop.org/JBR/15/046004/mmedia) (supplemental information) lists biomarkers identified for the RVP discrimination between positive and negative results. Each biomarker variation is defined by up-regulation depending on presenting significative higher intensities in RVP positive or negative. These differences are represented with some examples in figure 7(a), where most of the compounds were up-regulated by negative RVP, meaning that their abundances in breath were higher when negative test was obtained. Some of the identified molecules could be related to pro- and anti-inflammatory processes and oxidative stress, such as fatty acyls, phenols or sphingolipids. When we look at the variations between specific viruses (figures 6(b) and (c)) there is a clear difference between subjects diagnosed with influenza A and the others. Although the low number of samples for each positive virus type, these results direct promising expectations for future studies using a greater number of subjects. Also, the rest of the viruses were highly differentiated between them and negative results. A total of 146 features were defined as relevant for virus separation, being 75 of them tentatively identified. Table S2 (supplemental material) shows identified biomarkers for the virus type classification. In this case, each compound is up- or down-regulated considering the three viruses and non-virus class. Most of the compounds were up-regulated by virus presence, being characteristic markers of influenza A, HMPV and HRV/ENT present in higher intensities in 77%, 73% and 68% of the cases, respectively. Only 10% of the markers were up-regulated when no virus was detected. Similarly to the general RVP model, several fatty acyls were identified, as well as ceramides, sphingolipids and tripeptides (table S2). Some examples of specific biomarkers regulation are presented in figure 7(b). When we observe the specific markers, a total of 32 appear in both models, the one from general RVP response and from specific virus determination.
Figure 7. Examples of up- and down-regulations for some of the compounds that explain differences between RVP positive and negative (a), and between each type of virus detected (b).
Download figure:
Standard image High-resolution image
4. Conclusion
This study provides information about metabolomic markers that can be potentially related to the effect of viruses from two different approaches. First, we were able to determine the changes in the breath metabolomic profile when flu shot immunization is applied. In this case, clear differences were detected between day 0 (before shot) and after 1, 2 and 3 d. Several potential biomarkers were identified and related to inflammatory processes and oxidative stress. Moreover, we discriminate patients with flu-related symptoms that were diagnosed with positive or negative RVPs. These general differences were identified and are relevant for an initial screening for the presence of virus. Additionally, differences between specific viruses defined, such as influenza A, HMPV and HRV/ENT were also identified, providing important information to distinguish the type of virus affecting the subject.
Although this was a pilot study, with low numbers of subjects, we included differences by seasons (in both parts of the study) that allow higher variability of the limited data available. These promising results should be further studied as a diagnostic tool to be able to detect presence of influenza A and other viruses in human systems by using a simple and non-invasive specimen like exhaled breath.
Acknowledgments
This work was partially supported by Sandia National Laboratories' Laboratory-Directed Research & Development (LDRD) program, Award A20-3194 [CED, MS]; NIH-NHLBI K23HL127185 [MS]; NIH National Centre for Advancing Translational Sciences (NCATS) through award UL1 TR001860 [CED, NJK] and 1U18TR003795-01 [CED, NJK]; NIH award UG3-OD023365 [CED, NJK]; NIH award 1P30ES023513-01A1 [CED, NJK]; University of California CITRIS and the Banatao Institute award 19-0092 [CED, MS, NJK]; the Department of Veterans Affairs Award I01 BX004965-01A1 [CED, NJK, MS]; and the University of California Tobacco-Related Disease Research Program award T31IR1614 [CED, NJK]. The contents of this manuscript are solely the responsibility of the authors and do not necessarily represent the official views of the funding agencies. Sandia National Laboratories is a multimission laboratory managed and operated by National Technology & Engineering Solutions of Sandia, LLC, a wholly owned subsidiary of Honeywell International Inc., for the U.S. Department of Energy's National Nuclear Security Administration under contract DE-NA0003525. This paper describes objective technical results and analysis. Any subjective views or opinions that might be expressed in the paper do not necessarily represent the views of the U.S. Department of Energy or the United States Government.
Data availability statement
All data that support the findings of this study are included within the article (and any supplementary files).