
Abstract
A major challenge for breath research is the lack of standardization in sampling and analysis. To address this, a test that utilizes a standardized intervention and a defined study protocol has been proposed to explore disparities in breath research across different analytical platforms and to provide benchmark values for comparison. Specifically, the Peppermint Experiment involves the targeted analysis in exhaled breath of volatile constituents of peppermint oil after ingestion of the encapsulated oil. Data from the Peppermint Experiment performed by proton transfer reaction mass spectrometry (PTR-MS) and selected ion flow tube mass spectrometry (SIFT-MS) are presented and discussed herein, including the product ions associated with the key peppermint volatiles, namely limonene, α- and β-pinene, 1,8-cineole, menthol, menthone and menthofuran. The breath washout profiles of these compounds from 65 individuals were collected, comprising datasets from five PTR-MS and two SIFT-MS instruments. The washout profiles of these volatiles were evaluated by comparing the log-fold change over time of the product ion intensities associated with each volatile. Benchmark values were calculated from the lower 95% confidence interval of the linear time-to-washout regression analysis for all datasets combined. Benchmark washout values from PTR-MS analysis were 353 min for the sum of monoterpenes and 1,8-cineole (identical product ions), 173 min for menthol, 330 min for menthofuran, and 218 min for menthone; from SIFT-MS analysis values were 228 min for the sum of monoterpenes, 281 min for the sum of monoterpenes and 1,8-cineole, and 370 min for menthone plus 1,8-cineole. Large inter- and intra-dataset variations were observed, whereby the latter suggests that biological variability plays a key role in how the compounds are absorbed, metabolized and excreted from the body via breath. This variability seems large compared to the influence of sampling and analytical procedures, but further investigations are recommended to clarify the effects of these factors.
Export citation and abstract BibTeX RIS

Original content from this work may be used under the terms of the Creative Commons Attribution 4.0 license. Any further distribution of this work must maintain attribution to the author(s) and the title of the work, journal citation and DOI.
1. Introduction
The detection of volatile organic compounds (VOCs) in exhaled breath offers a non-invasive approach to screen for and monitor health-related biomarkers [1–3]. While studies exploring potential volatile biomarkers in breath generally have common goals, the tools and protocols used are highly varied. A wide range of sampling techniques for breath collection exist, ranging from direct sampling and immediate (on-line) analysis [4, 5] to sample collection and transfer for subsequent (off-line) analysis sometime later [6]. Similarly, there are various technologies for analysing exhaled breath, the most common being gas chromatography mass spectrometry (GC-MS), proton transfer reaction mass spectrometry (PTR-MS), selected ion flow tube mass spectrometry (SIFT-MS), ion mobility mass spectrometry (IMS) and laser-spectroscopy [1]. This diverse nature of both sampling and analysis of breath volatiles poses a major challenge in comparing results from independent research groups. To tackle this issue, a consortium was established within the Sampling and Standardization Focus Group of the International Association of Breath Research to develop a benchmarking study—the Peppermint Experiment—to enable a comparison of breath volatile data between independent research groups [7]. The experiment utilizes a standardized intervention in the form of encapsulated peppermint oil (a commercial health supplement) and monitors the release of selected constituent volatile compounds in breath over time after ingestion of the capsule. The goal of the Peppermint Experiment is to compile and compare datasets from a wide range of breath sampling and analysis approaches to explore variability and thereby establish benchmark values that allow individual methods to be compared and evaluated in relation to these [7]. Specifically, the proposed benchmarking study represents a straightforward tool for participating research institutions to compare multi-centre benchmark values against their own data to evaluate sampling and analysis proficiency. This is achieved by measuring the relative changes in the breath concentrations of the volatiles contained within the peppermint oil capsule over time via breath, i.e. the washout. Full details of the nature of this endeavour are given in the introductory protocol paper [7], which provides background information regarding the sampling and analysis protocol. The present technical note focuses on breath washout data of the Peppermint Experiment obtained by PTR-MS and SIFT-MS analyses using different sampling approaches. Technical papers on other techniques, including GC-MS, IMS, secondary electrospray ionization mass spectrometry and needle-trap micro-extraction with GC-MS analysis have been previously published [8–10] or are in the process of being published.
PTR-MS and SIFT-MS are soft chemical ionization mass spectrometry (SCIMS) techniques that detect gas-phase VOCs at trace concentrations, typically at levels of parts per billion down to parts per trillion by volume (ppbv to pptv). The term 'soft' refers to the low change in the free energy associated with the reaction ion chemistry. For exoergic proton transfer reactions involving H3O+ as the reagent ion, these changes in energies are often less than 1–2 eV (compared with electron ionization at 70 eV, as commonly used in GC-MS). Charge transfer reactions, as additionally utilized in SIFT-MS, also involve low energy processes, but the energy changes are often higher than proton transfer, with the reaction energy being equal to the difference in the recombination energy of the reagent ion and the ionization potential of the neutral. The low reaction energies involved in SCIMS limit the degree of fragmentation of a volatile upon ionization such that the target compound, M, is detectable as its protonated parent (MH+) or as the molecular ion (M+) [11–13].
Both PTR-MS and SIFT-MS techniques are particularly suited to breath analysis due to their on-line and sensitive detection of multiple compounds simultaneously over a broad dynamic range (typically six to seven orders of magnitude). Broadly speaking, PTR-MS and SIFT-MS both operate on the same principles but exhibit some differences, such as suprathermal (and variable) collisional energy in PTR-MS compared to thermal conditions in SIFT-MS. Each divergent feature represents either a benefit or shortcoming of one technique over the other; the distinguishing features between PTR-MS and SIFT-MS are discussed further in the literature [11–13].
The 'soft' ionization aspect of these SCIMS technologies represents both an advantage and a limitation. On the one hand, limited fragmentation leads to improved sensitivity of detection of a target compound. On the other hand, the identification of individual VOCs are based solely on the product ions detected (i.e. m/z of the product ions without additional parameters, such as retention time, as used in GC), which are not always unique. Hence, there can be ambiguity in assigning m/z signals to a single compound. Although compound selectivity is greater in other techniques, such as GC-MS, the advantage of SCIMS lies foremost in its real-time measurement capability and direct analysis that does not require sample workup prior to analysis. In the Peppermint Experiment, however, this detection ambiguity presents a problem for the key volatiles contained in the peppermint oil capsules, which comprise mainly terpenes that elicit mostly identical product ions upon ionization. As such, the unique identification of certain VOCs in the peppermint oil based solely on the m/z values is not possible [14].
In any targeted breath analysis study, it is important to quantify the compounds of interest, since the changes in concentrations of individual compounds might be of equal importance or relevance to the qualitative changes in breath composition. In the Peppermint Experiment, as well as providing benchmark values based on the temporal washout of the target constituents, information on the concentrations of these compounds over the course of washout provides researchers with quantitative reference values that allow for comparison and associated adjustments of instrument parameters, as necessary. Instrument operation at optimum settings ensures sufficient sensitivity and specificity to monitor washouts of individual compounds effectively.
This technical note reports on the execution of the Peppermint Experiment using PTR-MS and SIFT-MS instruments and focusses on three principle aspects, namely (a) the confirmation and identification of the primary product ions of the target volatiles in both systems, (b) an evaluation of the washout profiles of these key compounds, and (c) the calculation of benchmark values, defined as the log-log linear regression of the washout, for each compound (or sum of compounds) using all associated product ions.
2. Materials and methods
2.1. Peppermint experiment
A detailed description of the Peppermint Experiment, along with the rationale underpinning the experimental design, may be found in the introductory protocol paper [7], but a brief description is given here. The experiment monitors the change in the concentrations of selected VOCs in exhaled breath following the ingestion of encapsulated peppermint oil (Boots, London, UK). Each participant provided breath samples at six specified times over the course of a measurement session, one prior to and five after ingesting one peppermint oil capsule washed down with 150–200 ml water. The post-ingestion sampling times were at 60, 90, 165, 285 and 360 min; these times were chosen based on the washout curves of selected compounds from a pilot study, as outlined in the protocol paper [7]. In addition to the breath samples, at least one background air sample was collected per washout experiment, with the sampling time chosen at random but collected at the same time and in the same location as a breath sample. Participants were asked to refrain from consuming peppermint and associated products from their diet and personal care routine for 24 h prior to participating in the study and until completion of the experiment. Each participating research group used their own established breath sampling and analysis protocol to carry out the washout measurements, with the analysis of breath performed either with PTR-MS or with SIFT-MS.
Each contributing group obtained approval from their local ethical review board to participate in this study. Written informed consent was obtained from all volunteer participants. All study protocols complied with the Helsinki Declaration. More information regarding the ethics of the study is available on request. Anonymized datasets were uploaded by each research group to a secured cloud repository in accordance with the consortium agreement and prior to distribution for further analysis, as outlined in the protocol paper [7]. For the data evaluation, each group was assigned a dataset identification number prior to sharing. A summary of each dataset detailing the number of participants recruited, as well as the sampling and instrumental parameters, is presented in table 1.
Table 1. Summary of datasets, including number of participants recruited, sampling method and instrumental parameters. Detailed descriptions of the sampling and analysis methodology for each dataset is presented in the supplementary material (table S1).
| Dataset | No. participants recruited | Sampling | Instrument | Reagention | Flow (drift) tube pressure (mbar) | Flow (drift) tube temp (°C) | Drift tube voltage (V) | E/N (Td) | Inlet line material | Inlet line temp (°C) |
|---|---|---|---|---|---|---|---|---|---|---|
| 1 | 11 | Online | IONICON PTR-TOF 8000 | H3O+ | 2.3 | 75 | 606 | 138 | Silcosteel™ | 75 |
| 2 | 9 | Online | IONICON PTR-Qi-TOF | H3O+ | 3.8 | 62 | 1000 | 134 | PEEK | 60 |
| 3 | 10 | Online | SYFT VOICE 200 SIFT-MS | H3O+, O2 +, NO+ | 0.9 | 120 | N/A | N/A | Silcosteel™ | 110 |
| 4 | 10 | Offline | IONICON PTR-QMS 300 | H3O+ | 2.0 | 60 | 540 | 120 | PEEK | 60 |
| 5 | 7 | Online | IONICON PTR-TOF 8000 | H3O+ | 2.3 | 60 | 600 | 130 | PEEK | 70 |
| 6 | 10 | Online | Custom-built PTR-ToF-MS | H3O+ | 1.0 | 100 | 180 | 90 | PFA | 100 |
| 7 | 9 | Online | SYFT VOICE 200Ultra SIFT-MS | H3O+, O2 +, NO+ | 0.6 | 120 | N/A | N/A | Silcosteel™ | 120 |
PEEK: polyether ether ketone; PFA: perfluoroalkoxy
2.2. Identification of target compounds
In PTR-MS, H3O+ is the most commonly used reagent ion. Whilst it is possible to use different reagent ions, not all PTR-MS instruments used in this study exhibited this feature. Therefore, for consistency, and to have comparable results between all instruments, H3O+ was chosen as the reagent ion for all PTR-MS systems. This technical note reports on data collected from instruments equipped with either a quadrupole or a time-of-flight (ToF) mass spectrometer with differing mass resolution. For the sake of consistency, all m/z values are reported here to integer mass accuracy, as the minimum achieved by all instruments employed in this study. A preliminary study published by Malaskova et al reported on the key volatiles identified in the headspace of the peppermint oil capsules using GC-MS, with a corresponding determination of their associated product ions in PTR-ToF-MS [14]. At a reduced electric field of 130 Td, the ion signals at m/z 81 and m/z 137 were assigned to a combination of the monoterpenes (limonene, α- and β-pinene) and 1,8-cineole, m/z 155 was attributed predominantly to menthone, m/z 83 and m/z 139 were unique to menthol, and m/z 151 was assigned to menthofuran. These m/z assignments were used in the present study to evaluate the PTR-MS peppermint washout data.
The detection of monoterpenes by SIFT-MS has been previously demonstrated [15], but not in relation to the ion signals assignments for the peppermint target compounds. As such, preliminary SIFT-MS studies were undertaken using a gas standard (National Physical Laboratory, Teddington, UK). The 10 l cylinder mixture contained α-pinene, menthone, 1,8-cineole and R-limonene, as well as n-octane as an internal stability marker, each at approximately 500 nmol mol−1 in nitrogen 6.0, pressurized to 100 bar.
The SIFT-MS compound reference library was used to identify the relevant product ions for the peppermint compounds not contained within the gas mixture. Due to an extensive overlap in product ion signals in SIFT-MS analysis, no unique m/z could be attributed to any of the individual target compounds, thus these are reported as collective sums. A selection of the most suitable ions to report compound groups was made based on their ionization via different reagent ions (H3O+ or NO+). These were m/z 137 for the sum of monoterpenes and 1,8-cineole (proton transfer via H3O+), m/z 136 for the sum of the monoterpenes (charge transfer via NO+), and m/z 154 for menthone and 1,8-cineole (charge transfer via NO+). Although menthol and menthofuran should be detectable by SIFT-MS, the signals associated with these compounds in breath did not show clear washout profiles owing to their low concentrations. This meant that differences between the maximum intensities during the washout and the pre-ingestion baseline measurements were not discernible. Therefore, product ions associated with menthol and menthofuran were not monitored by SIFT-MS during the washout experiments.
A summary of the m/z assignments to the target compounds for PTR-MS and SIFT-MS analysis, as used subsequently and reported here, is given in table 2.
Table 2. Ions (m/z) assigned to the target compounds for the peppermint washout experiment by PTR-MS and SIFT-MS analysis.
| Ion assignment (m/z) | Compound(s) | Elemental composition | Reagent ion |
|---|---|---|---|
| PTR-MS | |||
| 81, 137 | Monoterpenes and 1,8-cineole | C6H9 +, C10H17 + | H3O+ |
| 83, 139 | Menthol | C6H11 +, C10H19 + | H3O+ |
| 151 | Menthofuran | C10H15O+ | H3O+ |
| 155 | Menthone | C10H19O+ | H3O+ |
| SIFT-MS | |||
| 137 | Monoterpenes and 1,8-cineole | C10H17 + | H3O+ |
| 136 | Monoterpenes | C10H16 + | NO+ |
| 154 | Menthone and 1,8-cineole | C10H18O+ | NO+ |
To determine absolute concentrations of the target analytes in the representative datasets, one PTR-MS instrument and one SIFT-MS instrument were calibrated using the aforementioned gas standard. For PTR-MS, a calibration series was performed via a dilution of the gas mixture with clean air (compressed air via a catalytic VOC scrubber) to establish concentrations of each target compound of approximately 0, 5, 10, 25 and 50 ppbv. For SIFT-MS, quantification was based on a one-point calibration at 100 ppbv. Despite an overlap in the product ions for different target compounds in SIFT-MS, an estimate of their individual concentrations in the gas mixture was achievable, as follows: the signal at m/z 136 (electron charge transfer to NO+) was assigned to the monoterpenes only, and the concentration was calculated directly using sensitivity factors derived from analyses using the reference compound mixture. In turn, this concentration was subtracted from the combined concentration of 1,8-cineole and the monoterpenes monitored at m/z 137 (proton transfer from H3O+) to estimate the concentration of 1,8-cineole only. Finally, in the same manner, the 1,8-cineole concentration was subtracted from m/z 154 (electron charge transfer to NO+) to obtain the menthone concentration. It should be noted that the gas mixture was required to make these calculations and the same approach could not be used to calculate the washouts of individual compounds as calibrations of the SIFT-MS instruments were not universally performed. These calculations are provided here to offer estimated concentration ranges of the peppermint compounds in breath.
2.3. Data analysis
All raw data were collected as signal intensity in counts per second (cps). These were normalized to the reagent ion signals (ncps), as is common in PTR-MS and SIFT-MS data processing, and the resulting data were uploaded to a secure cloud repository. These anonymized datasets were subsequently processed by one member of the consortium to determine the washout characteristics and describe linear regression models.
The increase and subsequent decrease in the product ion signal intensities (I) attributed to the target volatiles over time were used to characterize the washout profiles. The log-fold change in intensity in relation to the pre-ingestion intensity (I0), i.e. log (I/I0), was plotted over time. The washout profiles of the target compounds for each individual were assessed by comparing the ncps with the pre-ingestion intensity using a t-test. It should be noted that the first measurement will not be the maximum concentration owing to the intermittent nature of sampling, as observed in a previous study [16]. The t-test examined the significance of the concentration increases of the target compounds following ingestion of the peppermint oil capsule in order to establish whether there was a washout to observe or not.
The linear regression models were calculated as described in the protocol paper [7] and in a similar way as described above, albeit using log hours (rather than minutes) for each compound. These models were used to calculate the washout values for each dataset by taking the lower 95% confidence interval of the time for the respective signal to return to its pre-ingestion level, i.e. the x-axis intercept of the signal (as can be seen in figure 2). Benchmark values for each compound were calculated in the same way by combining all data from all of the datasets that met the inclusion criteria . The lower 95% confidence interval was chosen as the benchmark, because it provides an indication of the minimum period at which the individual peppermint compounds can be detected in breath at the end of the washout. The inclusion criteria for individual participants for the linear regression model was that their washout profile needed to contain at a minimum four reliable data points, i.e. the peak of the washout was at either t = 60 or t = 90 min. The reasons for an individual participant not meeting this criterion were a high pre-ingestion concentration that resulted in no discernible increase after ingestion and subsequent washout, or a late peak of the washout towards the end of the sampling series and a corresponding lack of sampling points beyond the set period of the protocol.
3. Results
3.1. Washout characteristics
The washout characteristics of each compound are presented as mean values per dataset (five PTR-MS datasets, two SIFT-MS datasets; comprising washout profiles from 65 volunteers) in figure 1. The plots in figure 1 contain all data and were used to compare datasets in order to identify washout curves that did not fulfil the inclusion criteria. The variations within each dataset were evaluated by calculating the relative standard deviations (RSDs) of the mean values per sampling point (supplementary tables S2 and S3 available online at stacks.iop.org/JBR/15/046005/mmedia). A characteristic washout profile would demonstrate a peak in the relative fold change at t = 60 or 90 min post ingestion, followed by a subsequent decrease over time. A one-sided t-test was applied to the peak intensity at 60 or 90 min in each dataset to examine significance from baseline intensity, thereby indicating whether a washout was observable or not (supplementary tables S4 and S5). For the PTR-MS datasets, the monoterpenes and 1,8-cineole, menthofuran and menthone showed characteristic washout profiles and were therefore deemed most suitable for monitoring the washout of peppermint oil capsules in breath with this technique. Menthol exhibited poor washout characteristics in all datasets. For SIFT-MS, all three product ions listed in table 2, representing combinations of the monoterpenes, 1,8-cineole and menthone, showed a characteristic washout profile. A large spread was present within the washout profiles recorded for each dataset, as indicated by the high RSDs in both PTR-MS and SIFT-MS results. In addition, some of the participants had a high baseline level, which resulted in negative values in the ensuing washout data. These negative values indicate that the post-ingestion signal was lower than the initial baseline concentration for some participants, meaning a washout could not be observed in these participants; such dataset were excluded from further processing.

Figure 1. Mean washout profiles per dataset (containing data from 7 to 10 participants; see table 1) for the individual target compounds or grouped compounds. The five PTR-MS datasets ((a)–(d)) comprised washout profiles from 47 individuals; the two SIFT-MS datasets ((e)–(g)) contain washout profiles from 19 individuals. Datasets are plotted with a slight offset for better visualization. Data are presented as log(I/I0), where I is the signal intensity at each sampling point and I0 is the pre-ingestion baseline signal intensity. Error bars represent the standard deviations of the mean values plotted.
Download figure:
Standard image High-resolution image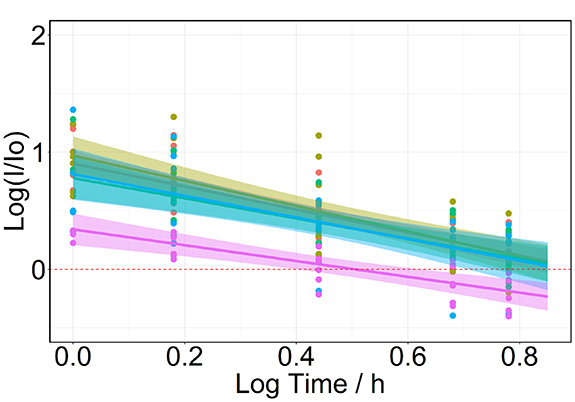
Figure 2. Representative linear regression, plotted for the mean sums of monoterpenes and 1,8-cineole (m/z 81 + m/z 137) from the five PTR-MS datasets (n = 47). The washout for each dataset is shown; the overall benchmarking value was calculated based on combining all datasets and calculating the lower 95% confidence interval at the intercept of the log(I/I0) axis.
Download figure:
Standard image High-resolution image
3.2. Dataset washout values
Washout values for each dataset were calculated based on the linear regression analysis described in section 2.3. A representative regression plot is shown in figure 2 for the PTR-MS datasets of the sum of monoterpenes and 1,8-cineole. Participants that failed to meet the inclusion criteria were excluded from the linear regression analysis. A complete overview of the number of participants excluded for both PTR-MS and SIFT-MS is given in the supplementary material tables S6 and S7. For the PTR-MS datasets, the least exclusions were for the monoterpenes and 1,8-cineole (10 exclusions from 47), whereas menthol and menthofuran had the highest exclusions (21 and 18 out of 47, respectively). There were only minimal exclusions for the SIFT-MS data. Table 3 summarizes the mean time to washout for each dataset.
Table 3. Summary of washout values for each dataset. The mean time in minutes to washout along with the upper and lower 95% confidence interval (represented by the values in italic) is reported.
| Compound | Mean washout (lower, upper 95% confidence interval) (min) | ||||
|---|---|---|---|---|---|
| PTR-MS | |||||
| No. 1 | No. 2 | No. 4 | No. 5 | No. 6 | |
| Monoterpenes and 1,8-cineole | 499 (379, 658) | 477 (330, 689) | 488 (308, 755) | 455 (268, 773) | 194 (151, 244) |
| Menthol | 228 (190, 281) | 147 (134 165) | 689 (203, 2334) | 370 (44, 3149) | 190 (131, 274) |
| Menthofuran | 511 (415, 643) | 370 (322, 415) | 396 (262, 614) | 455 (330, 643) | 362 (46, 2939) |
| Menthone | 281 (228, 345) | 250 (194, 322) | 223 (137, 370) | 294 (218, 396) | 151 (70, 322) |
| SIFT-MS | |||||
| No. 3 | No. 7 | — | — | — | |
| Monoterpenes | 244 (194, 308) | 301 (244, 370) | — | — | — |
| Monoterpenes and 1,8-cineole | 308 (228, 415) | 406 (308, 535) | — | — | — |
| Menthone and 1,8-cineole | 362 (244, 535) | 755 (532, 1117) | — | — | — |
3.3. Benchmark values
Washout times, in min, were used to represent the benchmark values. The overall benchmark value for each compound for either PTR-MS or SIFT-MS was calculated by combining all individual washouts from all datasets and performing the same linear regression analysis method as before. The benchmark values were then taken as the lower 95% confidence interval of the mean time to washout. The results are summarized in table 4.
Table 4. Mean time to washout, with the upper and lower 95% confidence intervals. The lower 95% confidence interval (highlighted in bold) is used as the benchmark value.
| Compound | Mean time to washout (min) |
|---|---|
| PTR-MS | |
| Monoterpenes and 1,8-cineole | 425 ( 353, 511) |
| Menthol | 194 ( 173 , 218) |
| Menthofuran | 425 ( 330 , 547) |
| Menthone | 250 ( 218 , 294) |
| SIFT-MS | |
| Monoterpenes | 268 ( 228 , 315) |
| Monoterpenes and 1,8-cineole | 353 ( 281 , 435) |
| Menthone and 1,8-cineole | 547 (370, 828) |
4. Discussion
4.1. Exhaled compounds from peppermint oil
No discernible washout was observed for menthol in the majority of the datasets; thus, it was excluded from consideration in the further data processing. The low levels of menthol in exhaled breath are perhaps unexpected, as a previous analysis of the headspace of the peppermint oil by GC-MS indicated that menthol accounts for 8.7 ± 1.5% of the total concentration of volatiles emitted from the oil [14]. However, breath menthol levels were also found to be low in the preliminary PTR-MS study [14]. A plausible explanation for this is that menthol is rapidly metabolized into menthol glucuronide in the liver and excreted from the body through urine, whereas 1,8-cineole is not metabolized efficiently and is predominantly removed from blood via gas exchange in the lungs; this, in part, would also explain the observed differences in the recorded washouts between these two compounds [14]. Menthone is thought to be metabolized to (+)-neomenthol and 7-hydroxymenthone by human liver microsomes [17] . For the monoterpenes, α-pinene is metabolized and transferred from blood to urine with a rapid renal elimination [18]. Limonene is metabolized in the liver by CYP2C9 and CYP2C19 enzymes [19]. Menthofuran is also metabolized in the liver by CYP450 enzymes [20]. This suggests that the signal attributed to the sum of monoterpenes and 1,8-cineole primarily consists of 1,8-cineole. All volatile compounds measured by SIFT-MS, apart from menthofuran, exhibited a characteristic washout, i.e. a significant increase from baseline concentration after capsule ingestion followed by a decrease in concentration, and are therefore considered appropriate for use in future SIFT-MS benchmarking studies of this nature.
4.2. Individual compound washouts and benchmark values
The washout values that met the inclusion criteria in each dataset were calculated for each compound, respectively for the PTR-MS and SIFT-MS analyses (tables 3 and 4). Large intra- and inter-dataset variability was observed, as is apparent from the high RSDs (supplementary tables S2 and S3). This indicates that the peppermint washout is affected by several factors, which are discussed below. A comparison of the lower 95% confidence interval from each of the PTR-MS datasets against the benchmark value for each compound revealed that less than half of the datasets for all the recorded compounds were above the benchmark. For SIFT-MS, only one of the two datasets exhibited washout times above the benchmark values.
The aim of this technical note is to provide an initial set of benchmark values that will allow breath researchers to compare data obtained with their own methods when carrying out the washout experiment. As only a relatively small number of datasets are included in the present study, each dataset can have a large effect on the overall benchmark values. Correspondingly, it is important to note that the initial benchmark values reported herein act as a basis for the future addition of datasets and a subsequent recalculation of the benchmarks, making them more robust over time. It should be further noted, however, that the large variations observed within the datasets strongly suggests that there are several factors that play a key role in the washout of the peppermint oil capsule via breath that need to be explored in greater detail; these include sampling methods, instrumental settings, and biological variation between participants, amongst other factors.
4.3. Effects of sampling methods
The observed differences in the exhaled concentrations of the peppermint compounds, especially for those at very low concentrations, could relate to the breath collection method, i.e. whether sampling was made on-line or off-line. All PTR-MS users, with one exception, used on-line sampling protocols; two datasets were collected using the buffered end-tidal (BET) breath sampler [21], one via direct exhalation, and another one employing an adapted respiration collector for in vitro analysis device [22]. Only one PTR-MS dataset reported on off-line breath collection in Tedlar® bags. Both SIFT-MS datasets were obtained via similar on-line sampling methods. The conditions of the sample inlet line to the instrument are important because some surface effects of the peppermint associated compounds are expected. The use of Silcosteel™ and high temperatures has been previously demonstrated to reduce retention of specific compounds in the inlet [23]. Therefore, suitable materials and temperatures should be carefully considered. Analogous to this, one of the drawbacks of using off-line sampling with Tedlar® bags is the risk of concentration dependent surface effects or losses for some compounds [14, 24–26], which may compromise the washout characteristics of those volatiles. The recorded washout value for menthofuran (m/z 151) for dataset 4, for example, was much lower compared to most of the other datasets, whereby half of the participants were excluded from the linear regression model analysis. This suggests that using a Tedlar® bag for sample collection and storage may affect the washout data of menthofuran. In addition, previous research has shown menthofuran to be not very stable when stored at 37 °C due to oxidation reactions [9, 27], which could explain the poor washouts observed in the off-line methods for this compound, although further data would be needed from this approach to investigate the degree of such trends. Bacterial filters were used by each dataset apart from those using the BET device, which employs a re-breathing stop valve rather than a filter. Filters are a commonly used safeguarding interface in breath sampling, and may affect the results due to the aforementioned surface effects. However, a more controlled study comparing different types of bacterial filters on the same instrument would be required in order to determine their influence on the recorded intensities of each of the peppermint associated compounds.
The washout values for the datasets collected via on-line sampling methods exhibited large variations. Datasets 2 and 5 were both collected using the BET sampling device, thus a direct comparison between these datasets can be made. Marked differences are apparent in the monoterpene washouts of these two datasets, with washouts of 330 min and 256 min for datasets 2 and 5, respectively. By comparison, both datasets returned similar washout values for menthofuran, at 322 min and 330 min for datasets 2 and 5, respectively. Examining the RSDs of each of the datasets, a higher RSD was calculated for the sum of monoterpene and 1,8-cineole washout in dataset 5 compared to dataset 2, with values of 60% and 30%, respectively, at t = 60 min. Similar differences were observed for the menthofuran data, with considerably higher values in dataset 5 compared to dataset 2, with RSDs of 109% and 45%, respectively, at t = 60 min. In comparison, the RSDs for the sum of monoterpenes and 1,8-cineole were much lower than those of menthofuran. This suggests that sampling methodology alone is not the only factor to consider when evaluating differences between washouts.
4.4. Instrumental settings
Although relative rather than absolute concentration changes were recorded and compared within and across datasets, the sensitivity of the analytical instrumentation to detect the product ions of the target compounds is an important factor in the data outcome. Specifically, in experiments such as these in which compounds are in very low abundance, higher sensitivities and lower limits of detection are of great benefit to improve detectability and data robustness. As described in the preliminary study by Malaskova et al [14], a direct comparison between different PTR-MS instruments is difficult without calibration of each system with a certified gas standard. This is due, in part, to the differences in the conditions of the sampling system, the reduced electric field (E/N) applied, instrumental-dependent transmission of the ions, detector efficiency, etc. This technical note aims to use the Peppermint Experiment for comparison between different instruments. As presented in table 1, however, several different types of instruments were used, and these were operated using different parameters, so variations in the detected signals are to be expected.
Both SIFT-MS datasets used the same instrument model, similar operating parameters, and identical data processing tools. As such, the large difference in the washouts for the sum of menthone and 1,8-cineole (m/z 154, NO+), with values of 244 and 523 min in datasets 3 and 7, respectively, is unexpected. This seems to suggest that biological variation in the digestion and metabolism of the peppermint oil capsule plays a significant role in the observed washout, in addition to instrumental variation.
4.5. Inter- and intra-participant variation
The inter-individual variability observed in the concentrations of the different compounds is likely due in part to pharmacokinetics of the supplement. Since the peppermint capsules are administered orally, their bioavailability [28] in combination with individual physiology may significantly influence the distribution in the body, metabolism and elimination of these compounds. In addition, for any breath study, the potential influence of a participant's physiology, i.e. height, weight, age, sex, feeding/fasting state, smoking habit and physical activity, etc, must be considered. These factors, along with the pharmacokinetic variability, will be addressed in detail in a planned synoptic paper of the Peppermint Experiment, whereby the data from all analytical techniques used within the consortium will be combined and compared. Nevertheless, some other factors that affect the measurements are addressed here. The first aspect relates to participant adherence to the sampling protocol, i.e. the instructions to not eat or drink any products containing peppermint-associated flavours for 24 h prior to the experiment. The baseline (capsule pre-ingestion) breath levels of some compounds from several participants were observed to be significantly higher than in subsequent measurements following capsule ingestion, suggesting that they had not conformed to the dietary restrictions. This scenario adversely affected the washout data. Although participants were requested to fill in a questionnaire in relation to food and drink intake, a number of participants with high baseline measurements did not report consuming any food or drink that would have affected the washout. Presuming their responses are correct, the high baseline levels might alternatively relate to environmental contaminations, although the peppermint oil associated compounds are not typically found in ambient conditions. One of the advantages of collecting real-time breath measurements is that ambient air samples are inherently recorded between the exhalations. Therefore, although the ambient air was explicitly sampled only once per participant according to the established study protocol [7], effectively it was continuously measured. Hence, the levels of peppermint compounds in ambient air could be examined and their effect on the breath concentrations was found to be negligible, except for dataset 3 which showed significantly higher concentrations in the room air at the start of the day compared to the end of the day. In addition, some participants disclosed having consumed peppermint flavours prior to analysis, which could be the reason for the large spread seen in dataset 3. Not all datasets were collected via real-time sampling, therefore for the case of the immediate environment, collection and analysis of ambient air samples prior to each breath sample would be useful to give confidence that the compounds detected in breath are physiological and not from the environment. On the other hand, such analyses cannot rule out prior exposure to any contaminants in a previous environment, for example, the participant may have consumed peppermint associated compounds from actions, such as brushing their teeth on the morning of the experiment with peppermint flavoured toothpaste. This can affect the breath concentrations of related compounds for several hours after brushing. Increased ambient air concentrations can similarly have an impact on the results, yet at this initial stage of the study, the Peppermint Experiment protocol dictates that environmental samples are collected at least once, at a random time point for each participant, and not necessarily before the collection of each sample.
4.6. Volatile concentrations
In both PTR-MS and SIFT-MS, the product ion signal intensities of analytes detected in a sample are linearly proportional to the volatile concentrations. Relative changes in signal intensities therefore represent equivalent changes in concentrations. Since the washout profiles characterized here represent only time-dependent changes in signal intensities, as do the benchmark values, absolute quantitation is not essential. Nevertheless, knowledge on the absolute concentrations of the target compounds in exhaled breath are of interest. An estimation of the typical concentrations of peppermint compounds in breath from the washout experiments was therefore made for representative datasets from one PTR-MS and one SIFT-MS instrument that had been calibrated using the aforementioned gas standard (see section 2.2). Although these results are limited by the small sample size, they provide a basic overview of the expected concentrations recorded from the washout experiment.
The PTR-MS dataset yielded average pre-ingestion concentrations in breath of 1.2 ± 0.8 ppbv for the sum of monoterpenes and 1,8 cineole and 1.4 ± 0.3 ppbv for menthone. In comparison, the average maximum measured concentrations for these compounds were 9.2 ± 2.5 and 5.1 ± 2.8 ppbv, respectively. For the SIFT-MS dataset, the average pre-ingestion and maximum concentrations were, respectively, 6.4 ± 3.5 and 15.1 ± 9.3 ppbv for the monoterpenes, 2.9 ± 1.5 and 8.8 ± 7.2 ppbv for 1,8-cineole, and 2.7 ± 2.5 and 13.5 ± 12.1 ppbv for menthone.
Instrument calibration is indispensable for quality assurance when absolute quantitation is required. In the present study, since the washout profiles—and correspondingly derived benchmark values—are based only on relative changes, absolute quantitation was not essential. Nevertheless, an interesting addition to the Peppermint Experiment would be to report on and compare peak concentrations of target volatiles between datasets. This would require calibration of each instrument on the compounds of interest using accurate reference standards, such as the gas mixture reported here. Calibrated data would allow a more robust evaluation of instrumental performance without the inherent biological variability observed in the washout experiment. Furthermore, use of a reference mixture can assist in method development, as was used in the present study, whereby one SIFT-MS user implemented this in the workflow for identifying precursor and selected product ions.
4.7. Limitations and suggestions
The main strength of the Peppermint Experiment is its collaborative nature, with several participating research institutions carrying out these washout tests and sharing the results. Presently, the efficacy of the Peppermint Experiment as a benchmarking concept needs further investigation and development, primarily due to the large inter- and intra-dataset variations observed. The peppermint oil capsules used for this benchmarking study are commercial health supplements, meaning ethical approval is more straightforward to obtain, as well as the low cost and easy distribution of capsules to participating research groups. As the peppermint oil capsule contains several compounds, biological variability from the metabolism of these compounds is expected, yet the degree of this variation is unknown. To reduce the complexity, future washout experiments could use a supplement containing only a single compound, such as 1,8-cineole, as has been demonstrated previously [16, 29] and as suggested by Malaskova et al [14].
Prospectively, a number of factors could be more stringently controlled in order to assist in assessing the suitability of this experiment as a benchmarking tool. A stricter recruitment criterion might be applied, for instance, whereby only participants of a certain age or sex could be recruited, or by enforcing a standardized diet 24–48 h prior to any measurements, and/or verifying the applied restrictions, e.g. in relation to prior food/beverage consumption, teeth brushing, etc. To evaluate the intra-individual variability, the washout experiment could be repeated multiple times by the same participant to assess reproducibility of the washout curves. The addition of sampling points, ideally at least one at 30 min and another between 90–165 min post-ingestion would be desirable; the addition of an earlier data point would increase the likelihood of being closer to the true peak of the washout, which would improve the reliability of the benchmark values. As mentioned previously, a number of high pre-ingestion baseline measurements were recorded, possibly indicating consumption of peppermint flavoured products prior to the washout experiment or through ambient air contamination or previous environmental exposure. The collection of an ambient air sample before the baseline breath sample is therefore highly recommended.
To summarize, both PTR-MS and SIFT-MS instruments present similar concentration ranges for the baseline and peak intensities of the compounds contained within the peppermint gas mixture. The typical concentrations to measure are in the range of 1–25 ppbv, with some outliers reaching 50 ppbv.
5. Conclusion
This technical note summarizes the data acquired by PTR-MS and SIFT-MS in the peppermint washout experiment. The paper reports on the main peppermint oil volatile compounds and their associated product ions, as detected from compounds in the exhaled breath samples after ingestion of encapsulated peppermint oil. The key compounds detected by the two techniques were the monoterpenes, 1,8-cineole, menthofuran and menthone in PTR-MS, and the monoterpenes, 1,8-cineole and menthone in SIFT-MS. Benchmark values, defined as the 95% lower confidence interval of the log-log washout profiles, were calculated for each of these volatiles based on the decrease in product ion signals from their peak values as a function of time.
The present data show that despite the use of similar sampling and analysis techniques for PTR-MS and SIFT-MS, large variations in the washout profiles of individual participants were observed. This suggests that pharmacokinetic variability plays a crucial role in how the peppermint oil capsule is absorbed and how its constituent volatiles are metabolized and excreted from the body via breath. The present results highlight the need for further investigations and developments in the use of peppermint oil capsules as a benchmarking tool. The data reported herein represent initial benchmark values for comparative use in future PTR-MS and SIFT-MS peppermint benchmarking studies.
Acknowledgments
The authors would like to acknowledge Paul Thomas for initiating the work and collaboration embodied in the Peppermint Initiative.
Financial support was provided to B H, M M and G P as early-stage researchers by the Marie Skłodowska-Curie Actions Innovative Training Network: Ion-Molecule Processes for Analytical Chemistry Technologies (IMPACT) (www.impact-h2020itn.com), which was supported through the European Commission's HORIZON 2020 Programme under Grant Agreement Number 674911. GS and GK thank SRA Instruments for making its SIFT-MS VOICE 200Ultra available for this study. The peppermint gas mixture referenced in this work is funded by the UK's National Physical Laboratory as part of the Directors' Science and Engineering Fund 2018.
Data availability statement
The data that support the findings of this study are available upon reasonable request from the authors.