
Abstract
The search for diagnostic biomarkers for pulmonary embolism (PE) has mainly been focused on blood samples. Exhaled breath condensate (EBC) is a possible source for biomarkers specific for chronic lung diseases and cancer, yet no previous studies have investigated the potential of EBC for diagnosis of PE. The protein content in the EBC is very low, and efficient condensing of the EBC is important in order to obtain high quality samples for protein analysis. We investigated if advanced proteomic techniques in a porcine model of acute intermediate-high-risk PE was feasible using two different condensing temperatures for EBC collection. Seven pigs were anaesthetized and intubated. EBC was collected one hour after intubation. Two autologous emboli were induced through the right external jugular vein. Two hours after the emboli were administered, EBC was collected again. Condensing temperature was either −21 °C or −80 °C. Nano liquid chromatography-tandem mass spectrometry (nLC-MS/MS) was used to identify and quantify proteins of the EBC. A condensing temperature of −80 °C significantly increased the EBC volume compared with −21 °C (1.78 ± 0.25 ml vs 0.71 ± 0.12 ml) while the protein concentration in the EBC was unaltered. The mean protein concentration in the EBCs was 5.85 ± 0.93 µg ml−1, unaltered after PE. In total, 254 proteins were identified in the EBCs. Identified proteins included proteins of the cytoplasm, nucleus, plasma membrane and extracellular region. The protein composition did not differ according to condensing temperature. The EBC from pigs with acute intermediate-high-risk PE contained sufficient amounts of protein for analysis by nLC-MS/MS. The proteins were from relevant cellular compartments, indicating that EBC is a possible source for biomarkers for acute PE.
Export citation and abstract BibTeX RIS

Original content from this work may be used under the terms of the Creative Commons Attribution 3.0 license. Any further distribution of this work must maintain attribution to the author(s) and the title of the work, journal citation and DOI.
Abbreviations
| PE | pulmonary embolism |
| CT | computed tomography |
| EBC | exhaled breath condensate |
| LFQ | label free quantification |
| nLC-MS/MS | nano liquid chromatography-tandem mass spectrometry |
| HR | heart rate |
| MRI | magnetic resonance imaging |
| F | French |
| TFA | trifluoroacetic acid |
| AGC | automatic gain control |
| CID | collision-induced dissociation |
| NTA | nanoparticle tracking analysis |
| PCA | principal component analysis |
1. Introduction
PE was estimated to account for more than 300 000 deaths among 454 million Europeans in 2004 [1]. This frequent and potentially fatal condition remains a diagnostic challenge. Initial symptoms vary from sudden death over classic clinical presentation with dyspnea, hemoptysis and pleuritic pain to vague symptoms as syncope, or even asymptomatic presentation of central PE [2, 3]. A low (negative) D-dimer can be used to rule out PE in patients with low pretest probability of PE, however in patients with high pretest probability of PE a low D-dimer is not sufficient to exclude PE [4, 5]. The D-dimer is often increased for other reasons in hospitalized patients and, consequently, the positive predictive value of a positive D-dimer is low [3]. The quality of CT angiography can lead to overdiagnosis of PE as well as false negative results, even in patients with high pretest probability of PE [6, 7]. Therefore, it is essential to search for novel biomarkers that can facilitate the diagnosis of PE, and a possibility could be to explore the potential of another sample material from the lungs, i.e. the expiratory air.
Over the past 30 years methods for non-invasive sampling of the lower respiratory tract lining fluid have developed. One of these methods accumulates the condensate of the expired air by instant cooling of the exhaled breath, i.e. EBC. The vast majority of EBC is condensed water vapor, while volatile and non-volatile molecules including proteins only comprise a minor fraction. Despite the low protein content in EBC, advances in mass spectrometry based proteomic techniques allow for identification and quantification of EBC proteins [8, 9]. The goal of proteomic studies is to identify and quantify the most conprehensive set of proteins in a given sample material. Proteins of the EBC may potentially serve as biomarkers for PE, but EBC has never been analyzed with proteomic techniques in PE.
The purpose of this study was to investigate if collection of EBC in a porcine model of acute intermediate-high-risk PE yielded amounts of protein sufficient for LFQ by nLC-MS/MS, and, furthermore, to see whether the amount of specific proteins in EBC changed after PE as potential diagnostic markers. We also investigated if extracellular vesicles were detectable in the EBC before and after PE. During this pilot-study we adapted the model system to improve the protein yield since we hypothesized that a lower initial EBC condensing temperature would increase the EBC protein yield without changes in the protein composition.
2. Methods
2.1. Animals
Seven female Danish Landrace pigs of 60 kg were included in this pilot-study which was a part of a recently published study where a new, autologous intermediate-high-risk PE porcine model was developed and characterized primarily in order to allow tests of novel therapeutic modalities [10]. Anesthesia, ventilation, monitoring and catheterizations of the pigs and embolus formation is comprehensively described in this paper [10]. The experimental pigs were bred at a local specific pathogen free farmer and transferred to the research animal facility at Aarhus University for quarantine at least 7 d before the day of the experiment. The study protocol was approved by the Danish Animal Experiment Inspectorate (license number: 2016-15-0201-00840), the experiments followed national and international guidelines concerning ethical care of experimental animals and Danish legislation on transport of livestock.
In short, anesthesia was induced with intravenous Etomidate (0.5 mg kg−1, Hypnomidate®Janssen Parmaceutical, Belgium) and maintained after intubation with continuous intravenous infusion of Propofol (2 mg kg−1 h−1, Propolipid, Fresenius Kabi, Germany) and Fentanyl (5 µg kg−1 h−1, Hamlen Pharma, Germany). Pressure controlled volume ventilation (Datex-Ohmeda S/5 Avance) with non-humidified air, tidal volume of 8 ml kg−1, respiratory rate of 16 breaths min−1 and no positive end-expiratory pressure was initiated. At the end of the experiment, the animals were euthanized by intravenous injection of an overdose of Phenobarbital (67 mg kg−1, Exagon®, vet, Richter Pharma, Austria).
2.2. Catheterizations and embolus formation
Intravascular catheters were placed guided by ultrasound in the left femoral artery and the left external jugular vein for continuous infusion of the anesthetics, drawing of blood for the emboli and blood samples and measurement of blood pressure and HR. In total 120 ml of autologous, venous blood was drawn for the emboli and distributed to 4.75'' uncoated extra corporal tubes and left for coagulation at room temperature for approximately three hours. Serum was discarded before the embolus was transferred to an uncoated tube containing isotonic saline, which was then connected to a 26 F Dry-Seal sheath placed in the right external jugular vein. Isotonic saline was used to gently flush the embolus through the 26 F Dry-Seal sheath to the right atrium, from where the embolus was transported to the pulmonary artery system by the circulation. Two emboli were administered for each pig. The exact position of the emboli was evaluated by MRI after each embolus. Cardiac output and dimensions of the right ventricle were obtained by MRI. Mean pulmonary artery blood pressure were measured at baseline and after induction of each embolus by a Swan-Ganz catheter introduced through the 26 F Dry-Seal sheath.
2.3. Collection and handling of exhaled breath condensate
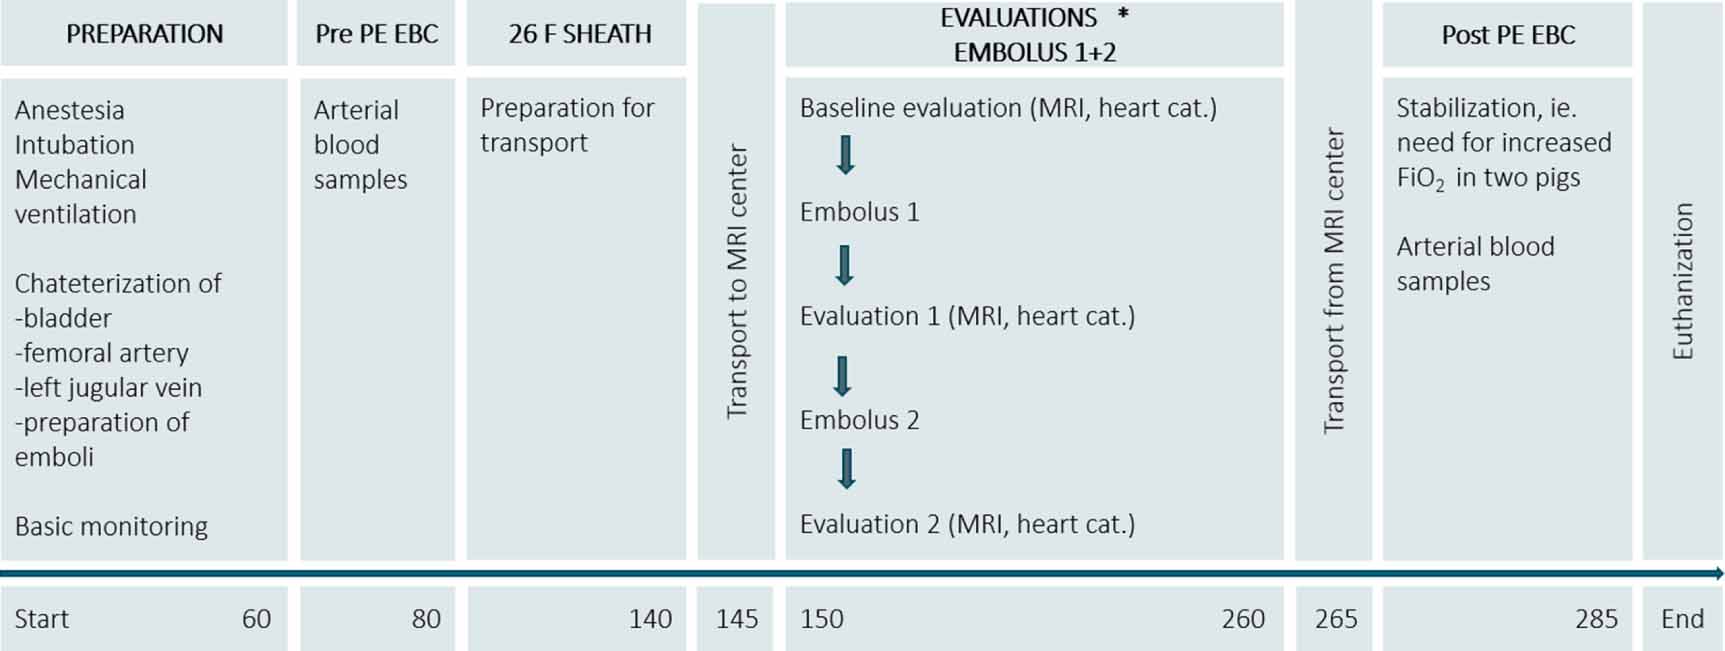
Two series of EBC collection were carried out in each pig; the first sample (Pre PE EBC) was collected after approximately 1 h of mechanical ventilation, after insertion of the catheters in the femoral artery and in the left external jugular vein, but before catheterization of the right external jugular vein. Second round of EBC collection (Post PE EBC) was initiated after administration of both emboli, which was approximately 2½ h after induction of the first pulmonary embolus (figure 1). For pig numbers 5, 6 and 7, two consecutive EBC samples were collected before PE (Pre PE EBC_a and Pre PE EBC_b) and two EBC samples were collected after PE (Post PE EBC_a and Post PE EBC_b).The experimental schedule is outlined in figure 1.
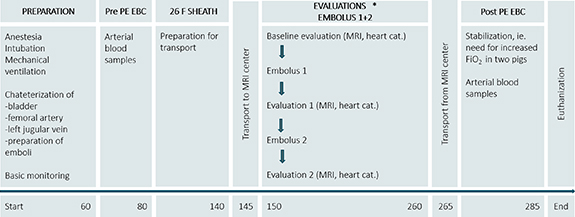
Figure 1. Study schedule. Time from study start is indicated in minutes. Abbreviations: PE, pulmonary embolism; EBC, exhaled breath condensate; MRI, magnetic resonance imaging; cat., catheterization.
Download figure:
Standard image High-resolution imageThe EBC was collected from the expiratory limb of the mechanical ventilator by insertion of a polypropylene collection tube (RTubeVent, Respiratory Research Inc., Austin, TX, USA) positioned inline just after the Y-connector (supplementary figure 1 which is available online at stacks.iop.org/JBR/15/026005/mmedia). An aluminum cooling sleeve surrounding the collection tube precooled to either −21 °C or −80 °C condensed the vapor of the exhaled breath. The condensing temperature was −21 °C in the first experimental animals as recommended by the manufacturer. Since we realized that this cooling sleeve almost reached ambient temperature during the collection of condensate, we tried to increase the condensation efficiency by lowering the condensing temperature to −80 °C in the Post PE EBC sample from pig number 5 and throughout the rest of the experiment. The cooling sleeve was insulated to reduce heating during the 15–20 min of EBC collection. The heat and moisture exchanger filter was disconnected during EBC collection. Immediately after collection, the EBC samples were stored in the collection tubes at −80 °C until analysis.
2.4. Estimation of protein concentration in EBC
The EBC volume was estimated in connection with the protein analysis either by pipetting or by weighing assuming 1 g = 1 ml. Protein concentration was estimated by tryptophan fluorescence, essentially as described previously for peptide measurements [11]. Samples were vacuum centrifuged and re-dissolved in 120 µl digestion buffer (0.5% SDC, 20 mM TEAB). The fluorescence (Excitation at 295 nm, Emission at 350 nm) was measured in microtiter trays using 100 µl. A standard curve was constructed from tryptophan. The protein concentration was estimated under the presumption that 1 g of protein corresponds to 0.0117 g of tryptophan as it is the case for human and mouse protein samples [12].
2.5. Statistics concerning clinical data and protein changes
Protein concentrations and EBC volumes were graphically summarized depicting medians and interquartile range (25th–75th percentiles) and lower and upper values within 1.5 times the interquartile range.
In analysis where clinical data, protein concentrations and EBC volumes were compared according to initial condensing temperature, data were analyzed as independent samples by the Students t-test. The assumption of normality was checked by inspection of Q–Q plots, and when violated the Wilcoxon rank sum test was used. Estimates are given as mean ± standard error of the mean (SEM).
When the data were compared according to collection time (Pre PE vs Post PE) data were analyzed as paired samples based on the t-test, assumptions of equal distributions and normality was checked by Bland–Altman plots and Q–Q plots of the differences, respectively. Statistical analysis of clinical data and descriptive statistics of protein amount, concentrations and EBC volumes were performed in STATA version 14.0 (Stata Corporation, College Station, Texas, USA) software package.
The LFQ intensities for proteins with at least two identified peptides in EBC samples collected before PE were compared with the EBC samples collected after PE using two-sided t-tests with no correction for multiple comparisons, p-values <0.05 were considered significant.
2.6. Filter-aided sample preparation with in-solution digestion and phase transfer
Protein digestion was performed using Microcon 30 K centrifugal filter devices (Merck Milipore Ltd, Tullagreen, IRL), essentially as described [11] with slight modifications. The EBC sample was added to the filter device and centrifuged at 14 000 g for 10 min. A 100 µl of 50 mM iodoacetamide was added, mixed at 600 rpm for 1 min and incubated at room temperature for 20 min in the dark. The filter was centrifuged and 100 µl digestion buffer was added two times each followed by centrifugation. Then 35 µl digestion buffer was added together with 0.5 µg of trypsin and left overnight at 37 °C in a wet chamber. A 50 µl digestion buffer was added and the filter unit centrifuged at 14 000 g for 10 min with new collection tubes. TFA was added to a final concentration of 0.5% (v/v) and an equal sample volume of ethyl acetate was added, shaken for 1 min and centrifuged at maximum speed for 2 min. The lower phase was saved by removal of the upper phase. The extraction was repeated two times. The samples were dried in a vacuum centrifuge and re-suspended in 0.1% (v/v) formic acid.
2.7. Nano liquid chromatography-tandem mass spectrometry (nLC-MS/MS)
The peptide mixture was separated by nLC on an UltiMate 3000 (Thermo Scientific) coupled to an Orbitrap Fusion mass spectrometer (Thermo Scientific) through an EASY-Spray source (Thermo Scientific). A trap column (300 µm × 5 mm, C18 PepMap100, 5 µm, 100 Å, Thermo Scientific) was used to load the sample and an analytical column (EASY-Spray Column, 500 mm × 75 µm, PepMap RSCL, C18, 2 mm, 100 Å, Thermo Scientific) was used to separate peptides. The peptides were eluted with a flow of 300 nl min−1 using a 60 min gradient by mixing buffer A (0.1% formic acid) with buffer B (80% acetonitrile, 20% water, 0.1% formic acid). The following amounts of buffer B were used, 6% (0 min), 16% (3 min), 30% (30 min), 60% (38 min), 99% (40 min), 99% (50 min), 6% (51 min), 6% (60 min). The universal method setting was used for mass spectrometry detection with full Orbitrap scans (m/z 400–1500) at a resolution of 120 000. An AGC target of 4 × 10⁵ and a maximum injection time of 50 ms was used. The cycle time was 3 s. The most intense precursors were selected with an intensity threshold of 5 × 10³ in top speed data dependent mode. MS [2] scans were performed in the linear ion trap in auto scan range mode with CID energy set to 35%, an AGC target of 2 × 10³ and a maximum injection time of 300 ms. The precursor ions with charge states 2–7 were isolated using the quadrupole with an isolation window of 1.6 m/z. Dynamic exclusion was set to 60 s.
2.8. Identification and label-free quantification of proteins
The raw data files were used to search the Sus scrofa and Homo sapiens Uniprot databases each downloaded on the 22 February 2017, using MaxQuant (v1.5.5.1) for LFQ analysis [13]. The settings in MaxQuant have previously been described [14]. Ideally, the raw files that were based on tryptic pig peptides, should thus be used to search for protein identifications in the Sus scrofa protein database. However, the Sus scrofa database is not as comprehensive as the Homo sapiens database, so if the initial searches were restricted to the Sus scrofa database, the number of protein identifications would be modest. Our experience is that several human and pig tryptic peptides are identical. This first analysis was performed using MaxQuant based on the raw datafiles with m/z values of tryptic peptides and collision induced fragments. MaxQuant combines individually identified peptides into protein groups with quantification data. The false discovery rate (FDR) was set to 1% at peptide spectrum match level as well as at protein level. The data from MaxQuant was entered into Perseus (v1.5.8.5) for statistical analysis [15] finally describing expressed proteins which will be based on a mixture of proteins identified in the Sus scrofa database as well as in the Homo sapiens database. Proteins were filtered by removing potential contaminants, proteins identified as reverse hits and proteins only identified by site. LFQ-values were log2 transformed. Technical replicates were averaged by mean. The samples were then categorized as Pre PE EBC or Post PE EBC and also according to condensing temperature (−21 °C or −80 °C). Proteins were filtered by requiring razor + unique peptides > 1. The proteins were further filtered by requiring that each protein was identified in all EBC samples prior to PE and after PE. Gene and protein names were added manually for thirteen proteins identified in the Sus scrofa Uniprot database (accession numbers: P00355, P00506, P01965, P02067, P08835, P09571, P50828, P53715, P79260, P80031, P81608, Q29092). No gene name was available for the protein with accession number P81245 (Odorant-binding protein).
2.9. Bioinformatics
A bioinformatic analysis was conducted based on the gene names of proteins identified in 100% of the samples using GeneCodis3 to bring insights into the Gene Ontology aspect: 'Cellular Component' of proteins identified in the EBCs [16–18]. To ensure that all proteins were recognized in GeneCodis3 the gene names were entered, Homo sapiens was chosen as organism and 'Cellular component' was chosen. In GeneCodis, a hypergeometric test was used and p-values were corrected using the FDR method of Benjamini and Hochberg [19]. 'Cellular component' with a corrected p-value <0.05 was accepted as statistically significant.
2.10. Principal component analysis (PCA)
A PCA analysis was conducted using default settings in Perseus in order to analyze if the protein expression patterns varied based on initial condensing temperature. The PCA analysis was based on proteins identified in all the EBC samples in the dataset. The LFQ values were log2 transformed before the analysis. The samples were classified as either 'condensing temperature −21 °C' or 'condensing temperature −80 °C'.
2.11. Tracking of extracellular vesicles
The EBC samples were analyzed (undiluted) for presence of extracellular vesicles using NTA on a LM10-HS system (Malvern Instruments Ltd, Malvern, UK) equipped with a 405 nm laser and a Luca-DL EMCCD camera (Andor Technology, Belfast, UK) in accordance with previous recommandations [20]. Silica Microspheres (0.1 µm, Polysciences, Hirchberg, Germany) were used to determine the software settings of the Nanosight NTA software version 3.0 (Malvern Instruments).
3. Results
3.1. Hemodynamic data
In all seven pigs, the emboli settled in the central pulmonary arteries. The hemodynamic phenotype of the porcine PE model has been characterized in detail previously [10]. The hemodynamic data of the seven animals included in this study are summarized in table 1. The pigs had significantly higher mean pulmonary artery pressure and HR after PE, but preserved cardiac output and mean arterial pressure. The end systolic volume of the right ventricle diameter was larger after PE. Arterial blood gas analysis showed higher PaCO2 after PE (table 1). Due to hypoxemia during transport from the MRI center to the research facility two of the pigs were given supplemental oxygen (FiO2 of 0.75–1.0) during collection of Post PE EBC samples, tidal volume and respiratory rate was however unaltered (figure 1). The PaO2 was significantly lower after PE if these two pigs were excluded from the analysis (table 1 and supplementary table 1).
Table 1. Clinical data, functional and invasive measures before and after PE.
| Before PE (n = 7) | After PE (n = 7) | p-value | |
|---|---|---|---|
| Heart rate (beats min−1) | 43 ± 3 | 85 ± 12 | 0.01 |
| Mean arterial blood pressure (mmHg) | 73 ± 5 | 77 ± 3 | 0.35 |
| Cardiac output (l min−1) | 4.4 ± 0.47 | 4.3 ± 1.24 | 0.70 |
| Right ventricle end systolic volume (ml) | 61.3 ± 5.8 | 98.0 ± 7.3 | <0.001 |
| Ejection fraction (%) | 59 ± 3 | 39 ± 4 | <0.001 |
| Mean pulmonary arterial pressure (mmHg) | 16 ± 1 | 29 ± 2 | <0.001 |
| End tidal-CO2 (kPa) | 5.0 ± 0.1 | 5.4 ± 0.2 | 0.14 |
| pH | 7.46 ± 0.03 | 7.44 ± 0.02 | 0.49 |
| PaCO2 (kPa) | 5.2 ± 0.1 | 6.3 ± 0.2 | 0.003 |
| PaO2 (kPa)a | 21.1 ± 1.8 | 21.3 ± 7.4 | 0.99 |
| Base excess (mmol l−1) | 4.5 ± 1.2 | 7.4 ± 0.7 | 0.04 |
| Lactate (mmol l−1) | 2.5 ± 0.5 | 1.1 ± 0.2 | 0.05 |
| Rectal temperature | 35.8 ± 0.4 | 39.1 ± 0.6 | <0.001 |
Abbreviations: SEM, standard error of the mean; PaCO2, arterial CO2 tension; PaO2, arterial O2 tension. a For the five animals who did not receive supplemental oxygen: PaO2 before PE: 21.3 ± 2.6, PaO2 after PE: 12.5 ± 0.4, p-value = 0.04.
3.2. Volume of exhaled air, EBC, protein amount and concentrations
The mean minute ventilation was 6.9 ± 0.2 l min−1 with no differences according to condensing temperature (p-value = 0.79), the respiratory frequency and tidal volume was unaltered throughout the experiment in each pig (i.e. unaltered before and after PE). The mean volume of EBC was significantly higher when condensing temperature was −80 °C instead of −21 °C (figure 2, table 2). The mean protein concentration in all the EBC samples was 5.85 ± 0.93 µg ml−1, not significantly altered by the condensing temperature (table 2, figure 2). The mean protein amount was 6.52 ± 1.04 µg per EBC sample with significantly higher amounts when collected at −80 °C compared with EBCs collected at −21 °C (9.91 µg and 3.33 µg, respectively, table 2, figure 2). Collection times were longer, although not significantly, for EBC samples collected at −80 °C (15.1 min for EBC collected at −21 °C vs 18.1 min for those collected at −80 °C, p-value 0.13) (table 2), and, therefore, sampled from larger volumes of exhaled air (104.1 l for the EBCs collected at −21 °C vs 123.75 l for the EBCs collected at −80 °C, p-value 0.05) (table 2).

Figure 2. Volume of EBC, total protein yield, protein concentrations in the EBC plotted against initial collection temperature (n = 9 at −21 °C and n = 5 at −80 °C). Boxes indicate median and interquartile range (25th–75th percentiles), whiskers indicate lower and upper values within 1.5 times the interquartile range.
Download figure:
Standard image High-resolution imageTable 2. Volumes of EBC, protein amounts and concentrations according to initial condensing temperature. Values are expressed as mean ± SEM.
| Initial condensing temperature | −21 °C | −80 °C | p-value |
|---|---|---|---|
| n EBC samples = 9 | n EBC samples = 5 | ||
| EBC vol. (ml) | 0.71± 1.23 | 1.78 ± 0.25 | <0.001a |
| Protein amount (µg)c | 3.33 ± 0.76 | 9.91 ± 1.45 | <0.001b |
| Protein concentration in the EBC (µg ml−1)c | 5.33 ± 1.60 | 6.36 ± 1.01 | 0.59b |
| Collection time (min) | 15.1 ± 0.2 | 18.1 ± 0.8 | 0.13a |
| Respiratory minute volume (l) | 6.9 ± 0.3 | 6.8 ± 0.22 | 0.79a |
Abbreviations: SEM, standard error of the mean; EBC, exhaled breath condensate; vol., volume; PE, pulmonary embolism. a Wilcoxon-rank sum. b t-test. c Estimated by tryptophan fluorescence.
The total protein amount and the protein concentration in the EBC did not differ in the Pre PE EBC compared with the Post PE EBC, p-values 0.58 and 0.26, respectively (table 3, figure 3).

Figure 3. Volume of EBC, total protein yield, protein concentrations in the EBC plotted against collection period. Boxes indicate median and interquartile range (25th–75th percentiles), whiskers indicate lower and upper values within 1.5 times the interquartile range of seven samples.
Download figure:
Standard image High-resolution imageTable 3. Volumes of EBC, protein amounts and concentrations before vs after PE. Values are expressed as mean ± SEM.
| EBC samples | Before PE (n = 7) | After PE (n = 7) | p-value |
|---|---|---|---|
| EBC vol. (ml) | 1.46 ± 5.26 | 2.09 ± 7.71 | 0.09 |
| Protein amount (µg) | 10.36 ± 4.49 | 8.57 ± 2.80 | 0.58 |
| Protein concentration in the EBC (µg ml−1) | 7.37 ± 2.15 | 4.12 ± 0.81 | 0.26 |
| Collection time (min) | 15.5 ± 0.8 | 16.7 ± 0.9 | 0.16 |
| Respiratory minute volume (l) | 6.8 ± 0.35 | Unaltered | — |
Abbreviations: SEM, standard error of the mean; EBC, exhaled breath condensate; vol., volume; PE, pulmonary embolism.
In summary, the total protein yield was higher when the initial condensing temperature was −80 °C compared with an initial condensing temperature of −21 °C. No differences in total protein yield or concentrations in the EBC was observed after PE compared with before PE.
3.3. Label-free quantification and bioinformatics
A total of 254 proteins were successfully identified in the EBC samples (supplementary table 2). The average number of proteins per sample was 209 (range 166–234). A total of 131 proteins were identified and quantified in all EBC samples (supplementary table 2). These 131 proteins were grouped according to their cellular localization using the bioinformatics tool GeneCodis3 [16–18]. A protein can be localized in more than one cellular compartment. Cellular compartments of the identified proteins were described as cytoplasm (73 proteins), cytosol (47 proteins), nucleus (40 proteins), extracellular region (31 proteins), plasma membrane (28 proteins), mitochondrion (18 proteins), intracellular (13 proteins), soluble fraction (12 proteins), cytoskeleton (11 proteins), extracellular space (11 proteins), melanosome (11 proteins) and protein complex (10 proteins), (supplementary figure 2). The levels of five proteins were significantly different in EBC samples collected after PE compared with EBC samples collected before PE; for two of the proteins, the levels were up to 29 fold higher after PE (P81245, P30086) while for the remainder three proteins the levels were lower after PE (P06753-4, P31949, P13797-3) (p-values < 0.05).
3.4. Principal component analysis (PCA)
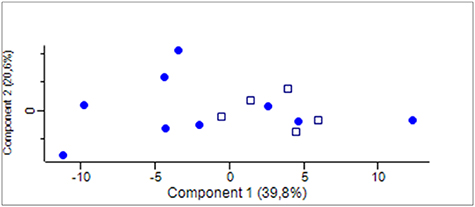
In order to reveal whether there was a difference in protein composition between samples obtained at the two different condensing temperatures we performed a PCA. The first two components, explaining more than 60% of the total variance of the data, are plotted in figure 4. The data points were uniformly spread with no separate grouping of neither EBC obtained at −21 °C nor those obtained at −80 °C. Thus, the PCA did not reveal any difference in the protein composition of EBC samples obtained at the two different condensing temperatures (figure 4).
Figure 4. PCA of protein composition in EBC samples collected at −21 °C (•) (n = 9) and −80 °C () (n = 5). The protein composition of the EBC samples do not differ according to initial condensing temperature.
Download figure:
Standard image High-resolution image
3.5. Extracellular vesicles
No extracellular vesicles could be detected using Nano-sight analysis, neither before nor after PE.
4. Discussion
The porcine model corresponded to acute intermediate-high-risk PE [3, 10]. EBCs were collected before and after PE in all seven pigs. The method yielded sufficient sample material for protein quantification by proteomic analysis, and collection at −80 °C was significantly better than −21 °C. We demonstrated that our method was able to identify and quantify 131 EBC proteins which were present in all EBC samples. Considering the low protein content of the EBC [21–23], a total of 131 successfully identified proteins in all samples is a fairly high number. Thus, there was good consistency in the proteomic analysis by LC-MS/MS. We required each protein to be identified and quantified in all EBC samples. This is a strict criteria considering the low abundance of proteins in the EBC. Furthermore, some of the proteins revealed a significant difference from before to after PE indicating a potential as diagnostic biomarkers.
As the EBC has a low cellular content [24], a high number of extracellular proteins was likely to be identified in the EBC. Nevertheless, the bioinformatic analysis revealed that relatively large numbers of proteins localized in the cytoplasm, cytosol, nucleus and plasma membrane were identified in the EBC (supplementary figure 2).
This is the very first study to investigate the protein content of EBC in PE. To the best of our knowledge only one other research group has collected EBC from pigs, however not during mechanical ventilation; the protein concentrations of EBC samples in our study are comparable to their findings [25]. A recently published study on the proteome of EBC in humans collected the EBC by the RTube commercial device identified 145 unique proteins in two pooled samples of EBC by nano LC-MS/MS [26]. We identified 79 orthologs of these proteins in all of our EBC samples. The initial condensing temperature did not influence the protein concentration in EBC samples, which confirms earlier observations [27, 28] but the protein yield was considerably higher at −80 °C because larger volumes of EBC were obtained and probably more efficiently condensed as the condensing temperature was low for a longer period.
The primary objective of our study was to demonstrate that proteins of the EBC prior to PE and after PE could be identified and quantified using label-free LC-MS/MS. Our study demonstrates that the use of a porcine model of experimental PE combined with LC-MS/MS has the potential to identify proteins in EBC with a different composition following PE. Plasma is the most commonly used material in the search for biomarkers for PE. We demonstrated that the EBC is a potential source for biomarkers and a possible alternative to plasma. Although the results indicated some potential candidates, the study is too preliminary to suggest putative diagnostic markers for PE. The findings must be confirmed in larger studies.
4.1. Study limitations and strengths
We cannot rule out that the transitory hypoxemia and accordingly higher FiO2 in two of the pigs make their post PE EBC protein profile differ from the other five pigs. Since specific proteomics is not within the scope of this pilot study, we consider this a minor limitation only. Transitory hypoxemia should not change the effect of condensing temperature on protein concentration of the EBC or the protein concentration in the EBC to such a degree that these animals ought to be excluded.
As the study protocol encompassed MR scans, Gadolinium contrast (0.1 ml, 279.3 mg ml−1, Dotarem®, Guerbet, France) was added to the blood right after distribution to the tubes [10]. Gadolinium does not bind to proteins in vitro (www.drugs.com/pro/dotarem.html), thus neither interactions with proteins measured in EBC nor interactions with the coagulation should be a matter of concern, but cannot be ruled out completely.
The coagulation in this model for formation of thrombi is activated by contact activation, and it may therefore not be completely equivalent or comparable to an embolus formed in vivo. However, it has in the recent years become clear that contact activation probably is important in the pathophysiological formation of thrombi [29] and therefore the approach used here is probably a reasonable method to resemble the in vivo situation.
The experimental animals were their own controls within few hours before exposure to autologous PE, which is rather unique and a great advantage since this paired study design minimizes inter-individual variation of protein expression. Also, importantly, the controlled volume of exhaled breath during mechanical ventilation minimizes variations in EBC volumes caused by individual breathing patterns [8, 30]. Mechanical ventilation hinders the normal physiological response to hypercapnia (i.e. hyperventilation). This is a limitation for the generalizability for the PE model, as discussed previously [10]. However, we find no reason to believe that it would influence the observed effect of the condensing temperature on the EBC or have a major effect on the protein content.
4.2. Clinical implications
The EBC collection is gentle in its non-invasive nature. This method would be applicable to mechanically ventilated patients with suspected PE. However the method would probably also be feasible in the vast majority of conscious patients suffering a PE of whom some may be severely dyspneic, as a previous study have shown that even patients with severe heart failure can cooperate to breath analysis without adverse events [31]. However, the potential of this method may of course be demonstrated in studies with humans having PE.
4.3. Conclusion
This study showed that EBC collected from pigs before and after autologous intermediate-high-risk PE yielded sufficient amounts of protein for identification and quantification with proteomic analysis by nLC-MS/MS. Lower initial condensing temperature increased the total protein yield by increasing the EBC volume, but did not affect the protein concentration in the EBC or the overall protein composition in the EBC samples. Our methods demonstrated high consistency in the protein analyses and allowed for quantification of a great variety of proteins with different cellular localizations. In conclusion our study indicates that EBC could be an interesting new source of PE biomarkers and an alternative to plasma.
Acknowledgments
We would like to thank Mona Britt Hansen and Thøger Nielsen for expert technical assistance. ILG received funding from the Department of Clinical Medicine, Aalborg University, Dagmar og Peder Kristen Tøftings Fond and Snedkermester Sophus Jacobsen og hustru Astrid Jacobsen's Fond for this study. During the study period, JGS received funding from Aarhus University Graduate School of Health, The Novo Nordisk Foundation, Holger og Ruth Hesses mindefond, Verner Lipperts Fond and Direktør Kurt Bønnelyckes fond. BH received funding from A. P. Møller og Hustru Chastine McKinney Møllers Fond til almene Formaal during the study period. LJC received funding from Fight for Sight Denmark and Helene og Viggo Bruuns Fond during the study period.
Conflict of interest
A patent application partly based on the observations from this study has been filed: 'Biomarkers for pulmonary embolism in exhaled breath condensate'. The patent applicants are Aalborg University Hospital, Aarhus University and Aalborg University, the inventors are Inger Lise Gade, Søren Risom Kristensen and Bent Honoré. Jacob Gammelgaard Schultz, Lasse Jørgensen Cehofski, Benedict Kjærgaard, Marianne Tang Severinsen, Bodil Steen Rasmussen and Henrik Vorum declare no conflicts of interest.
Author contributions
ILG conceived the idea of investigating the proteins in the EBC as a possible new diagnostic method, she collected the EBC samples, analyzed the hemodynamic measures and proteome data and wrote the article draft. JGS developed the porcine model of acute PE and obtained all hemodynamic measures, contributed to article writing and approved the final draft. LJC contributed to proteome data analysis and interpretation, contributed to article writing and approved the final draft. BK contributed to development of the porcine model of acute PE, optimization of EBC collection and contributed to article writing and approved the final draft. MTS contributed to overall study design, article writing and approved the final draft. BSR contributed to aspects of the mechanical ventilator and EBC collection and contributed to article writing and approved the final draft. HV contributed to overall study design, article writing and approved the final draft. BH was responsible for the mass spectrometry analysis, proteome data analysis, contributed to study design and contributed to overall study design, article writing and approved the final draft. SRK conceived the idea of investigating the EBC in a porcine model, contributed to study design, data analysis article writing and approved the final draft.