
Abstract
Exhaled breath contains hundreds of volatile organic compounds (VOCs) which offer the potential for diagnosing and monitoring a wide range of diseases. As the breath research field has grown, sampling and analytical practices have become highly varied between groups. Standardisation would allow meta-analyses of data from multiple studies and greater confidence in published results. Washout of VOCs from ingestion into the blood and subsequently breath could provide data for an initial assessment of inter-group performance. The Peppermint Initiative has been formed to address this task of standardisation. In the current study we aimed to generate initial benchmark values for thermal desorption–gas chromatography–mass spectrometry (TD–GC–MS) analysis of breath samples containing peppermint-derived VOCs using data from three independent European research groups. Initially, headspace analysis of peppermint oil capsules was performed to determine compounds of interest. Ten healthy participants were recruited by each three groups across Europe. The standard Peppermint protocol was followed. In brief, each participant provided a baseline breath sample prior to taking a peppermint capsule, with further samples collected at 60, 90, 165, 285 and 360 min following ingestion. Sampling and analytical protocols were different for each group, in line with their usual practice. Samples were analysed by TD–GC–MS and benchmarking values determined for the time taken for detected peppermint VOCs to return to baseline values. Sixteen compounds were identified in the capsule headspace, and all were confirmed in breath following ingestion of the peppermint capsules. Additionally, 2,3-dehydro-1,8-cineole was uniquely found in the breath samples, with a washout profile that suggested it was a product of metabolism of peppermint compounds. Five compounds (α-pinene, β-pinene, eucalyptol, menthol and menthone) were quantified by all three groups. Differences were observed between the groups, particularly for the recovery of menthone and menthol. The average time taken for VOCs to return to baseline was selected as the benchmark and were 377, 423, 533, 418 and 336 min for α-pinene, β-pinene, eucalyptol, menthone and menthol respectively. We have presented an initial set of easy-to-measure benchmarking values for assessing the performance of TD–GC–MS systems for the analysis of VOCs in breath. These values will be updated when more groups provide additional data.
Export citation and abstract BibTeX RIS

Original content from this work may be used under the terms of the Creative Commons Attribution 4.0 license. Any further distribution of this work must maintain attribution to the author(s) and the title of the work, journal citation and DOI.
1. Introduction
The analysis of volatile organic compounds (VOCs) in human breath offers a non-invasive tool for biomarker discovery. With each breath myriad VOCs are exhaled (De Lacy Costello et al 2014) and putative breath biomarkers have been proposed for a range of diseases including asthma (Ibrahim et al 2011, Wilkinson et al 2019), chronic obstructive pulmonary disease (Basanta et al 2012), heart failure (Biagini et al 2017), and pneumonia (van Oort et al 2017).
With the increase in the number of groups investigating breath volatiles worldwide, there has been a commensurate rise in the range of sampling and analytical techniques employed. This heterogeneity has made comparison of findings between groups difficult, and likely contributes to the lack of replication seen thus far, as highlighted by recent systematic reviews (Lawal et al 2017, Fowler 2018). Two complementary solutions have been proposed to overcome this issue: the standardisation of methods (e.g. sampling, analytical and reporting); and benchmarking studies among different research groups (Herbig and Beauchamp 2014, Horváth et al 2017). The Peppermint Initiative (Henderson et al 2020) has been founded within the breath community with the aim of determining a set of benchmark values through a standardised peppermint breath experiment as described in the methods section below. Interested groups are invited to join and perform the same breath VOC experiments using their own methods for sampling and analysis.
The experiment builds on previous work from members of the Initiative (Beauchamp et al 2010, Henderson et al 2020) and is designed to produce a temporary and well-characterised perturbation in the breath profile of a participant following the ingestion of a peppermint oil food supplement capsule. The volatile compounds in the oil enter the blood stream of the participant via the digestive tract and, along with the volatile metabolic products of peppermint oil, are subsequently exhaled. As the participant metabolises and eliminates these compounds, their concentrations reduce over several hours. Although the peppermint oil washout profiles likely vary between participants, we hypothesised that statistical analysis of the washout profiles would provide useful information about the reproducibility of results obtained from different groups. Each group used its own sampling and analytical protocols rather than complying with a prescribed protocol. As such, the results potentially allow the indirect comparison of the sampling and analytical approaches used.
Thermal desorption–gas chromatography–mass spectrometry (TD–GC–MS) is currently the gold standard analytical approach for untargeted biomarker discovery studies (Rattray et al 2014). This is primarily due to the high sensitivity offered by the pre-concentration of samples onto sorbent material and the ability to separate and identify VOCs by GC–MS instruments. TD is a versatile technique as breath samples can be collected by a wide range of different sampling devices onto many different types of traps (Lawal et al 2017). This has however, led a wide range of protocols making it an important target for standardisation.
Here we outline the sampling and TD–GC–MS measurement methods from three independent research groups in Europe and then compare the washout profiles that are observed after following the peppermint protocol. This work does not seek to set thresholds that future work must meet before being considered valid. Instead, it aims to suggest initial benchmarking values for the sampling and analytical performance of different VOC collection methodologies which will allow direct comparison of one group with another, something that has not been possible up to this point. To achieve this, benchmark values for the average time taken for the levels of five VOCs (α-pinene, β-pinene, eucalyptol, menthol and menthone) to return to baseline levels are suggested. Importantly, we expect that these results will need to be updated as adoption of the peppermint protocol increases and data from more groups become available.
2. Methods
2.1. The peppermint breath experiment
Ten participants were recruited at each institution. Ethical approval was obtained locally. Each participant was asked to provide an initial breath sample prior to swallowing a 200 mg peppermint oil capsule (Boots, London, UK). All peppermint capsules were purchased from the same batch to minimize any differences among participants (Henderson et al 2020). Following ingestion, further breath samples were collected at 60, 90, 165, 285 and 360 min. The sampling time points were set by the peppermint initiative and published by Henderson et al (2020), with the aim to capture the dynamic range of the exponential peppermint washout. Each measurement was taken as close to the prescribed time as possible and VOC were collected no later than 5 min after the set point for any of the samples.
Participants were instructed to refrain from brushing their teeth on the morning of the tests or consuming any products known to contain peppermint. They were instructed to avoid dairy products during the sampling period as they are known to affect VOC release (Hageman et al 2019) but were otherwise allowed to eat and drink. Information about food and drink consumed was included in the Participant questionnaire. A limited number of volunteers choose not to consume any food during the test.
2.2. Identifying compounds of interest
2.2.1. Headspace method group 1
Headspace analysis of the peppermint oil capsules was carried out in order to characterize the analytes emission and to determine which VOCs were likely to be detected in exhaled breath during the washout experiment. A single capsule was placed into a 20 ml glass headspace vial (Sigma Aldrich, Gillingham, UK) and pierced with a scalpel to release the peppermint oil. VOCs were passively collected by exposing a dual bed 'Biomonitoring' sorbent tube (Tenax TA and Carbograph 5TD total weight 200 mg, Markes International, Llantrisant, UK) to the headspace for 5 s at the unsealed head of the vial. Room air samples were collected using the same protocol with empty vials for comparison.
2.2.2. Headspace method group 3
Briefly, a single capsule was placed into a 20 ml HS vial (Sigma Aldrich, Gillingham, UK), pierced with a scalpel to release the peppermint oil and sealed. The vial was kept at 60 °C for 3 h before sampling. Empty vials were used to acquire room air samples. An aliquot (1 ml) of the HS was injected into the GC–MS instrument and VOCs were analysed using the GC–MS method described below by Analytical method 3 with the caveat that the MS acquired in both full scan (30–200) and multiple reaction monitoring (MRM) mode.
2.3. Breath sampling
In line with the peppermint initiative protocol (Henderson et al 2020), each group used their own sampling and analytical methodologies. The sampling and analytical techniques employed by the three groups to monitor the peppermint washout experiment are summarised in figure 1.
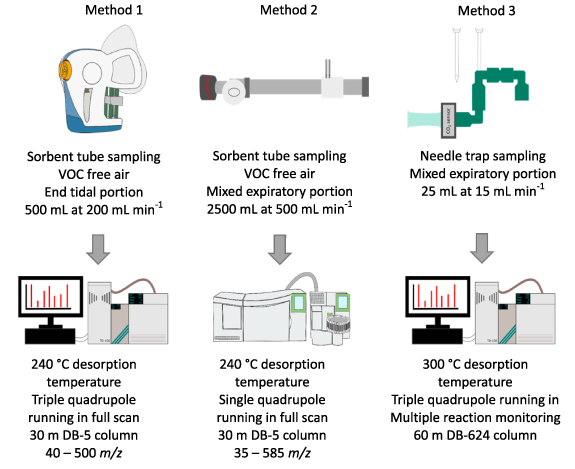
Figure 1. A summary of the sampling and analytical methodologies used by each of the three groups to process the peppermint washout experiment.
Download figure:
Standard image High-resolution image2.3.1. Sampling method 1
A volume of 500 ml of end-tidal breath was collected at 200 ml min−1 using a ReCIVA sampling device (Owlstone Medical, Cambridge, UK). Reusable silicon masks (Owlstone Medical) were used with the ReCIVA and were baked (180 °C) for 24 h before sampling to reduce the siloxane background. Following analysis, they were decontaminated with Decon90 (Agar Scientific, Stansted, UK) before being rinsed and stored ready for baking. A disposable bacterial-viral filter (Philips Respironics, Eindhoven, Netherlands) was placed between the silicon mask and the ReCIVA to prevent contamination of the device. VOC free air was provided at 40 l min−1 via a CASPER air pump (Owlstone Medical). ReCIVA background samples were collected immediately prior to the first sampling session for each participant. In order to seal the mask the ReCIVA was attached to a glass head whilst VOC free air was provided by the CASPER. A collection of 500 ml was performed on one tube with the ReCIVA pumps set to 'Always on'. All other ports in the device were blocked with blanking tubes. These samples allow an assessment of the contaminant VOCs that arise from the sampling setup. Biomonitoring sorbent tubes (Markes International) were used to trap and store the VOCs for analysis. Prior to storage all tubes were dry purged using 50 ml min−1 of clean N2 for 8 min using a TC-20 system (Markes International) to remove water trapped by the sorbent materials or condensed into the tube's walls (Wilkinson et al 2020). Following analysis all tubes were reconditioned using a TC-20 for 1 h at 320 °C in 100 ml min−1 of VOC free N2.
2.3.2. Sampling method 2
Room air was inhaled through an A2 VOC filter (Dräger, Lübeck, Germany), a y-valve (Hans-Rudolph, Shawnee, USA), and standard lung function sterile filter. Subjects exhaled through the sterile filter and the y-valve into an aluminium reservoir tube (50 cm × 4 cm ID) with a flow restrictor mounted at the end of the tube. Subjects exhaled against minimal resistance sufficient to close the nasal velum and were asked to maintain a certain flow rate indicated on a flow meter. Following a pre-collection period of 3 min (to clean the breath from acutely accumulated room air contaminants), the breath from the reservoir was loaded simultaneously into two separate Tenax TA adsorption tubes (200 mg, Perkin Elmer, Waltham, USA). Using a small suction pump and a calibrated resistor, adjusting flow to 500 ml min−1, 2.5 l of breath passed through the tubes over the 5 min collection period. As a control, 2.5 l of room air were collected close to the sampling device. The sterile filter and mouthpiece were discarded after collection, the valve was disinfected by placing it into a 2% Sekusept (Na Percabonate) solution for 10 min, after which it was washed 3 times in water and then left to air dry prior to the next use. The reservoir tube was first disinfected with ethanol and then rinsed thoroughly with deionised water.
2.3.3. Sampling method 3
Commercial side-hole needle trap devices (NTDs), (23-gauge stainless steel needle, length 60 mm), packed with 3 cm of Tenax GR (60/80 mesh), were purchased from PAS-Technology (Germany). Prior to first use, NTDs were conditioned at 300 °C in a custom-made heating device (PAS-Technology, Germany) by applying 1 bar front pressure of ultra-high purity 5.0 grade N2 for 15 h. Each NTD was then sealed with Teflon caps and stored under room conditions (25 °C ± 2 °C and RH 50 %± 5%) until use. Immediately before sample collection, NTDs were conditioned again for 30 min using the same procedure and loaded with 120 μg of toluene-d8 by dispersing 50 μl of stock toluene-d8 gaseous solution (600 ppmv) in a volume (10 ml) of synthetic medical air flowing through each NTD at 5 ml min−1.
The sampling device consisted of a disposable mouthpiece (Spectra 2000, Italy), a Capnostat 5 CO2 sensor (Respironics, Philips), three polyethylene T-piece connectors and an electronic sampling valve controlled by an automated NTD sampler device (PAS-Technology, Germany). The sampler allows appropriate pressure and sample volumes to be set as well as monitoring the sampling flow rate during VOC collection. The NTD sampler performs gated sampling using real time pCO2 data from the sensor and opening the sampling valve when a preselected threshold is overcome (delay <50 ms).
Before sample collection, each subject was asked to familiarise themselves with the sampling device by breathing through it at self-selected pace for 1 min. Preliminary experiments did not highlight significant differences between mixed and end-tidal breath for the VOCs of interest, so mixed breath (corresponding to a CO2 threshold of 2 mmHg) was selected to reduce sampling time. After familiarization, an NTD was connected to the sampler via the electronic valve and inserted into an adapter connected to the series of polyethylene T-pieces, then 25 ml of mixed breath gas was collected at 15 ml min−1. After collection, both ends of the NTDs were immediately sealed with Teflon caps to prevent analyte losses from the sorbent material (Biagini et al 2019).
2.3.4. Analytical method 1
For TD–GC–MS analysis, each set of breath samples was bracketed with a standard mix to monitor analytical performance. Each tube was loaded with 100 ml of a gaseous calibration standard (1 ppmv, 4-bromofluorobenzene in N2, Thames Restek, UK) as an internal standard. Immediately prior to desorption, tubes were pre-purged for 2 min in 50 ml min−1 He carrier gas to remove any possible air and moisture from the tubes. Sorbent tubes were then desorbed at 235 °C in 50 ml min−1 He carrier gas for 5 min using a TD-100 (Markes International) onto a general-purpose hydrophobic trap (Markes International) for cryo-focussing. During the primary desorption the trap was maintained at 0 °C. The trap was desorbed at 240 °C for 2 min and VOCs injected into a GC (7890B GC, Agilent, SantaClara, CA, USA) equipped with a DB-5 ms Ultra Inert column (30 m × 0.25 mm, 25 µm film thickness, Agilent). Chromatographic separation was carried out using the following temperature ramp: 40 °C for 0 min, 6 °C min−1 –170 °C (hold 0 min), 15 °C min−1 –190 °C (hold 0 min) for a total time of 23 min with an He carrier gas flow of 1.3 ml min−1. Post run was 2 min with an oven temperature of 250 °C and a He flow rate of 1.3 ml min−1. A triple-quadrupole MS (7010, Agilent) was used in electron ionization mode at 70 eV, with a scan range of m z−1 40–500 Da at 4 Hz.
2.3.5. Analytical method 2
Immediately prior to desorption, tubes were dry purged for 1 min in 10 ml min−1 He carrier gas to remove any possible air and moisture from the tubes. Sorbent tubes were then desorbed at 240 °C in 10 ml min−1 He carrier gas for 15 min using a Turbomatrix ATD350 (Perkin Elmer) onto a Tenax TA trap for cryo-focussing. During the primary desorption the trap was maintained at −25 °C. The trap was desorbed at 250 °C for 2 min with a 10 ml min−1 split and VOCs injected into a GC (Clarus 680, Perkin Elmer) equipped with a DB-5 ms Ultra Inert column (30 m × 0.25 mm, 25 µm film thickness, Agilent). Chromatographic separation was carried out using the following temperature ramp: 35 °C (hold 2 min), 7 °C min−1 –250 °C (hold 0 min) for a total time of 32.7 min with an He carrier gas pressure of 86 kPa. A single-quadrupole Clarus SQ 8T MS (Perkin Elmer) was used in electron ionization mode at 70 eV, with a scan range of m/z 35–585 Da at 4 Hz.
2.3.6. Analytical method 3
NTDs were thermally desorbed for 20 s at 300 °C using He as a carrier gas into the multimode GC inlet using a Concept GC auto sampler (PAS-Technology, Germany) optimised for the fast expansive flow technique (Warren et al 2011). A long-life non-stick septum and an Ultra Inert solid phase micro extraction (SPME) liner (inner diameter 0.75 mm, internal volume 35 μl) were used, both from Agilent Technologies. VOCs were injected into a GC (7890B GC, Agilent, SantaClara, CA, USA) equipped with a DB-624 Ultra Inert capillary column (60 m × 0.25 mm, 1.4 μm film thickness, Agilent). Chromatographic separation was carried out using the following temperature ramp: 150 °C for 0.1 min, 8 °C min−1 –220 °C (hold 0.2 min), 40 °C min−1 –250 °C (hold 2.2 min) for a total time of 12.1 min with He carrier gas flow of 1 ml min−1. Post run was 8 min with an oven temperature of 250 °C and He flow rate of 1.5 ml min−1. A 7010 triple-quadrupole GC/MS (Agilent Technologies) with an electron ionisation source set at 70 eV was operated in MRM mode during for the entire GC analysis. Qualifier and quantifier transitions were monitored for each compound, table 1.
Table 1. Retention time, quantifier and qualifier transitions, and qualifier to quantifier ratio (q/Q) of the investigated compounds. Collision energy (eV) is reported in round brackets.
| Analyte | Retention time (min) | Quantifier transition | Qualifier transitions | Qualifier to quantifier ratios |
|---|---|---|---|---|
| Alpha-pinene | 6.82 | 136 → 93 (8 eV) | 136 → 92 (8 eV) | 0.52 |
| 136 → 77 (8 eV) | 0.14 | |||
| 136 → 121 (8 eV) | 0.12 | |||
| Beta-pinene | 7.42 | 136 → 93 (8 eV) | 136 → 121 (8 eV) | 0.54 |
| 136 → 77 (8 eV) | 0.15 | |||
| 136 → 92 (8 eV) | 0.06 | |||
| Eucalyptol | 8.10 | 154 → 84 (9 eV) | 154 → 71 (9 eV) | 0.57 |
| 154 → 125 (9 eV) | 0.36 | |||
| 154 → 139 (9 eV) | 0.17 | |||
| Menthone | 10.16 | 154 → 139 (9 eV) | 154 → 112 (9 eV) | 0.15 |
| 154 → 83 (9 eV) | 0.10 | |||
| 154 → 69 (9 eV) | 0.08 | |||
| Menthol | 10.25 | 138 → 95 (5 eV) | 138 → 81 (5 eV) | 0.46 |
| 138 → 123 (5 eV) | 0.13 |
The temperatures of the transfer line, ion source and quadrupoles were set at 260 °C, 250 °C and 150 °C, respectively. Helium was used as a quench gas at a flow of 4 ml min−1 and nitrogen as a collision gas at a flow of 1.5 ml min−1. A solvent delay of 5 min was set to protect the filament from the water vapour released during the TD process.
2.4. Calibration curves
Calibration curves were generated for the five peppermint compounds included in the benchmark analysis. These compounds were α-pinene, β-pinene, eucalyptol, menthone and menthol. Calibration curves for additional peppermint compounds detected in breath were not run as they were not selected for inclusion in the benchmark values.
2.4.1. Calibration method for groups 1 and 2
Each pure compound was diluted into methanol to create an initial mix with an equivalent concentration to 1222 pptV in 500 ml of collected breath as calculated using equation (1):
where Vi is the volume of each volatile as determined using the ideal gas equation, Vt is the breath sampling volume and the constant is a conversion to parts per trillion.
A serial dilution of the primary stock was performed in five steps whereby the concentration at each step was half of the previous value. Each concentration in the dilution was purged onto five (group 1) and three (group 2) sorbent tubes using a calibration solution loading rig (Markes International) for 2 min in a flow of 50 ml min−1 clean He (4.6 Linde, Germany).
Limits of detection (LODs) were calculated according to the equation (2):

where σ is the standard deviation of replicates of the lowest concentration loaded onto the sorbent tubes, m is the slope of the fitted regression line and the constant is the factor required to generate a confidence interval of 99.7%.
2.4.2. Calibration method for group 3
Stock liquid mixture was prepared by mixing each pure compound into a 1 ml amber glass vial and stored at 4 °C up to 1 week. An aliquot of this mixture was vaporized into a pre-evacuated 2 l glass static dilution bottle (Supelco, USA), equipped with a screw-cap mininert valve (Sigma Aldrich, Italy), and stored at 37 °C for 1 d. The resulting concentration of α-pinene, β-pinene, eucalyptol, menthone, and menthol were 790, 1020, 690, 695, and 1070 ppbV, respectively. Humid working gaseous mixtures were prepared by injecting appropriate aliquots of stock gaseous mixture into the flow (500 ml min−1) of humidified synthetic air (purity of 99.999%) during the filling of 10 l double-walled Nalophan bags (polyethylene terephthalate, thickness of 20 µm). Such bags were prepared at (film) surface-to-(sample) volume ratio (S V−1) of 0.3 cm−1 to minimize the water diffusion trough Nalophan film (Ghimenti et al 2015) and stored at room conditions (25 °C ± 2 °C and RH 50% ± 5%) up to 3 h. An aliquot of these working gaseous mixtures were analysed according to the analytical method 3 to estimate the relative response factor of each compound. LODs were calculated according to equation (2) by analysing five of the lowest concentration loaded.
2.5. Data processing
GC–MS data were pre-processed according to the usual workflow by each group. Peak area was determined using MassHunter quantitative analysis (Agilent) by groups 1 and 3 and Chromion (Perkin Elmer) by group 2.
All data visualisation and modelling was carried out in R. Pairwise comparisons were made using t-tests and comparisons between groups were by ANOVA or chi-squared test depending on which was appropriate.
2.6. Safety precautions
All work was performed with consideration to the safety of staff and participants, where appropriate the cleaning procedures performed have been detailed. All participants in this work were healthy volunteers and as such there was minimal risk of infection.
3. Results
3.1. Demographics
Each group recruited ten healthy participants, table 2. The participants for all three groups were well matched for height, weight, body mass index (BMI), smoking status and gender. Participants for group 2 were older than for groups 1 and 3.
Table 2. Participant demographics by group. Values are presented as mean (standard deviation). Comparisons between each group of samples were performed by ANOVA for height, weight, BMI and age and by chi-squared tests for smoking status and gender. Bold values denote statistical significance at the p < 0.05 level.
| Group: | 1 (n = 10) | 2 (n = 10) | 3 (n = 10) | p-value |
|---|---|---|---|---|
| Height (m) | 1.74 (0.08) | 1.72 (0.11) | 1.72 (0.11) | 0.89 |
| Weight (kg) | 78.79 (12.37) | 70.8 (18.73) | 68.00 (15.18) | 0.33 |
| BMI (kg m−2) | 25.76 (2.26) | 23.92 (6.8) | 22.63 (15.18) | 0.33 |
| Age (y) | 26 (4) | 39 (16) | 28 (3) | 0.012 (1–2, 2–3) |
| Smoking status (Never/Past/Current) | 8/2/0 | 9/0/1 | 10/0/0 | — |
| Gender (M/F) | 6/4 | 4/6 | 6/4 | 0.59 |
3.2. Identifying peppermint compounds
To determine which VOCs were present in the peppermint oil capsules, headspace samples were collected and compared to the laboratory air by groups 1 and 3. A total of 16 VOCs were observed by group 1: alpha-pinene, camphene, 3-carene, beta-pinene, alpha-terpine, p-cymene, limonene, eucalyptol, gamma-terpinene, terpinolene, menthone, menthofuran, isomenthone, menthol, isomenthol and carvone at increased intensities in the headspace samples. In a headspace analysis by group 3, 11 of these compounds were also detected with the exceptions being: camphene, 3-carene, isomenthone, gamma-terpinene, terpinolene and carvone.
Breath samples collected 60 min after ingesting the peppermint capsule were compared with matched baseline samples to determine which compounds were exhaled during the washout. For groups 1 and 2 all 16 compounds recovered in the capsule headspace were also found in breath, figure 2. In addition, one extra compound, 2,3-dehydro-1,8-cineole, was also recovered. Using a preliminary data set analysed in full scan group 3 was able to detect the same 11 compounds in breath as in the capsule headspace.
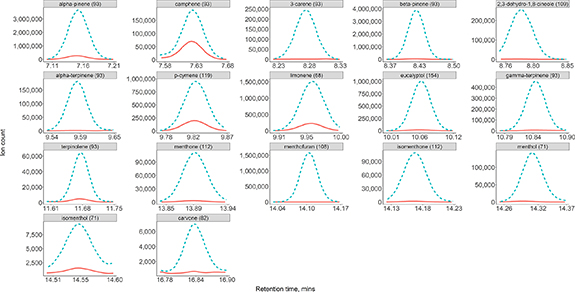
Figure 2. Extracted ion chromatograms from one participant for the peppermint compounds in a baseline breath sample (orange solid line) and 60 min following ingestion (blue dashed line).
Download figure:
Standard image High-resolution image3.3. Baseline levels
The baseline levels of each compound were compared between the different groups by a one way ANOVA with a post hoc Tukey test, figure 3. Differences were observed between the groups for all the compounds included in the benchmark. No group performed better across all the compounds than the others. Group 1 had the highest background levels of α and β-pinene and eucalyptol, group 2 exhibited the largest menthone concentrations and menthol was highest for group 3.
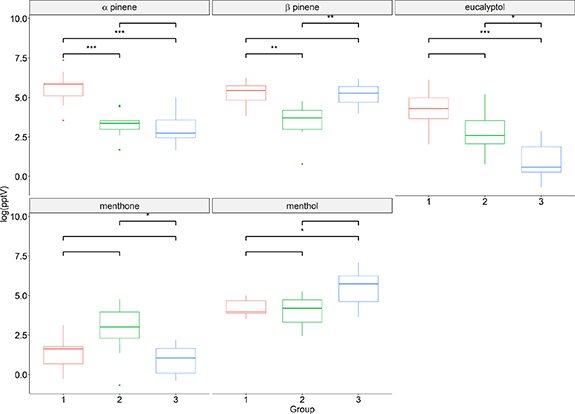
Figure 3. Box and whisker plots showing the median and interquartile ranges with the min and max data values shown as whiskers. Significance levels are calculated using one way ANOVA with a post hoc Tukey test. Blank = not significantly different, *p < 0.05, **p < 0.001, ***p < 0.0001.
Download figure:
Standard image High-resolution image3.4. Compound washout curves
Peppermint breath measurements were provided for five compounds by all three groups and were used to compare the performance of sampling and analytical protocols. In order to allow comparison between the groups, the integrated area of each compound at each time point was normalised by the background signal, figure 4. All compounds displayed clear washout curves with significant differences were found between the 0 and 60 min time points; α-pinene (p < 0.0001), β-pinene (p < 0.0001), eucalyptol (p < 0.0001), menthone (p < 0.0001) and menthol (p < 0.001) for all centres apart from α-pinene and menthol for group 3.
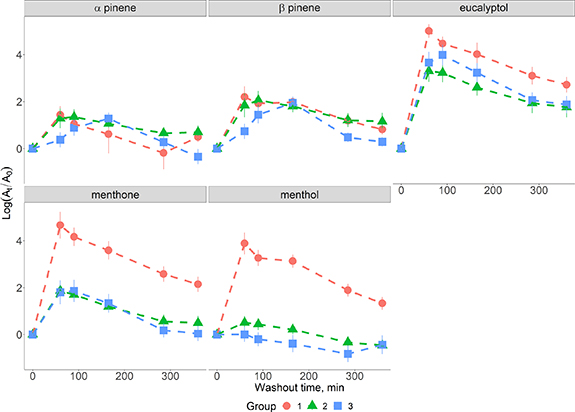
Figure 4. Washout profile for the five compounds identified by all three groups. Results are presented as the mean the standard deviation for each time point. At is the abundance of each compound at a given time point and A0 is the concentration at the baseline.
Download figure:
Standard image High-resolution imageThe results for group 3 are due to two different factors: for α-pinene the peak in the washout curve appeared at 90 min rather than 60 min as in the other groups' data. When the levels of α-pinene are compared between 0 and 90 min a significant difference is observed (p < 0.03). The washout curve for menthol does not show a rise above the baseline at any timepoint and as does not appear to have been detected in the breath samples.
A regression analysis was performed for each compound to determine whether the wash out rates differed between centres. The washout of menthol was the only compound to exhibit different behaviour and this was between group 1 and the two other groups (p < 0.001).
3.5. Washout time to reach baseline (t0) values
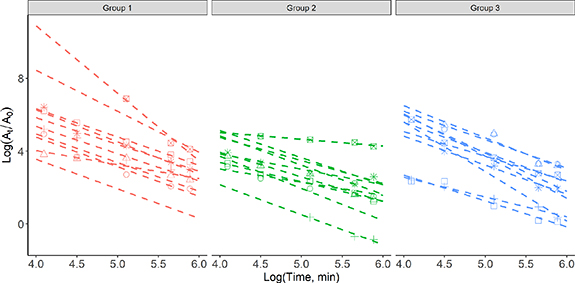
The lower 95% confidence interval of the time taken for the level of peppermint VOCs in breath to return to the baseline values (t0) was selected as the benchmarking metric for the peppermint Initiative. This metric allows the performance of the sampling and analysis to be assessed at the same time. To determine the benchmark values, a linear regression for each compound and each group was performed, figure 5. Group 1 exhibited the longest time to return to the pre-capsule ingestion intensities for eucalyptol, menthol and menthone, while group two had longer washouts for α-pinene and β-pinene. Group 3 had the shortest time to return to the start point for all five compounds, table 4. Furthermore, it was not possible to calculate a washout value for menthol in group 3 as the levels did not increase above the baseline in this cohort.
Figure 5. Linear regression for each participant of eucalyptol for samples from each group. At is the abundance of each compound at a given time point and A0 is the concentration at the baseline.
Download figure:
Standard image High-resolution image
Benchmark peppermint washout times for GC–MS analysis were determined for the five compounds by linear regression of the samples from all three groups. These were 441, 648, 1736, 643 and 375 min for α-pinene, β-pinene, eucalyptol, menthone and menthol, respectively. As the levels of menthol did not rise above the baseline values in the data from group 3 it was not possible to include it in the calculation of the benchmark.
3.6. Calibration curves
The calibration curves produced by each group were used to calculate LODs for each method and are summarised in table 3. The LODs for all groups were in the low pptV range but there was heterogeneity in the values obtained. None of the groups had the consistently lowest LOD across all the compounds but overall groups 1 and 3 performed marginally better than group 2. The calibration curves are available in the supplementary material, figure S1 (available online at stacks.iop.org/JBR/15/026006/mmedia). A wide range of minimum concentrations were used to produce the calibration curves and this may have impacted the LODs that were determined.
Table 3. Limits of detection calculated for each of the compounds by each group.
| Analyte | Calibration range (pptV) | LOD (pptV) | ||||
|---|---|---|---|---|---|---|
| Group 1 | Group 2 | Group 3 | Group 1 | Group 2 | Group 3 | |
| α-Pinene | 4.98–978 | 4.98–76.4 | 20–2160 | 6 | 11.1 | 5 |
| β-Pinene | 4.98–978 | 4.98–76.4 | 73–7367 | 5 | 19.8 | 20 |
| Eucalyptol | 4.98–978 | 4.98–76.4 | 2–155 | 7.5 | 8.4 | 0.5 |
| Menthone | 4.98–978 | 4.98–76.4 | 2–165 | 4.7 | 19.7 | 0.5 |
| Menthol | 4.98–978 | 4.98–76.4 | 392–7792 | 0.9 | 38 | 15 |
Table 4. Summary of the time taken (min) for the measured intensity of each compound to return to pre-ingestion levels in ten participants' breaths for each group as calculated by linear regression. Values for the lower and upper interquartile range are shown in brackets. It was not possible to calculate a washout value for menthol in group 3 as the levels did not increase above the baseline in this cohort.
| Compound | Group | ||
|---|---|---|---|
| 1 | 2 | 3 | |
| α-Pinene | 440 (319–577) | 658 (387–607) | 338 (264–511) |
| β-Pinene | 724 (397–1073) | 978 (524–996) | 462 (335–510) |
| Eucalyptol | 3433 (1088–2743) | 1313 (1034–3300) | 1319 (620–2012) |
| Menthone | 1312 (841–1745) | 513 (302–1083) | 364 (264–506) |
| Menthol | 795 (619–836) | 198 (198–372) | NA |
4. Discussion
The aim of the Peppermint Initiative is to devise a metric by which the sampling and analytical performance of a method may be assessed. In this work, we provided an analysis of the VOCs identified in breath following ingestion of the peppermint oil capsule. Furthermore, we determined washout times for five VOCs across a range of measured intensities that provides initial benchmarking values for future work.
Standardisation efforts have been undertaken in the metabolomics field by the metabolomics standards initiative (MSI) (Fiehn et al 2007), which published comprehensive guidelines on how samples should be taken, stored and analysed whilst also setting minimum reporting standards for results. Whilst recent appraisals of the success of the initiative suggest that adherence to the minimum reporting standards was lower than expected (Spicer et al 2017), comparative efforts in the breath community are in their infancy and the MSI provides a template to build upon.
Previous studies by members of the Peppermint Initiative found many of the compounds identified in this work after ingestion of peppermint oil (Beauchamp et al 2010, Malásková et al 2019). All but one of the VOCs detected were monoterpenes, the exception being p-cymene which is a closely related alkylbenzene compound. Since many compounds have the same molecular weight and highly similar mass spectra, the calculation of retention indices was important for accurate identifications as described by Davies (1990). All the compounds that were identified in the headspace of the peppermint capsule were also found in participants' breath profiles although there were differences in the number of compounds detected by each group. In addition to the compounds detected in the headspace, 2,3-dehydro-1,8-cineole was found in the breath samples by all three groups. Previous work has shown that 2,3-dehydro-1,8,cineole accounted for between 0.05% and 0.09% of the total ion count of VOCs in four out of five essential oils tested (Ieri et al 2019). In this work it was not detected in the capsule headspace and may arise from metabolic processing of the peppermint oil as it is closely related to eucalyptol.
A wide range of sampling techniques are currently being employed to collect breath (White and Fowler 2018). A recent review by Lawal et al (2017) indicates that the most common technique is to collect late stage expiratory air using sampling bags (e.g. Tedlar and Nalophan bags) and sorbent traps. Across the three groups in this study there was a high level of heterogeneity in the sampling protocols, particularly for group three.
The sampling protocols for groups 1 and 2 collected large volumes of gas onto sorbent tubes and both made use of an upstream filter and a clean-air washout period to reduce the impact of environmental VOCs on the analysis. The key differences between the two protocols were the portion of breath that was collected (end tidal for group 1 and mixed expiratory air for group 2) and the volume of gas sampled (0.5 l and 2.5 l for groups 1 and 2 respectively). Increasing the sampling volume may allow greater sensitivity but breakthrough of lighter compounds on the sorbent tubes and sufficient dry purge times must be considered. The use of filtered air has been shown to account for contamination from environmental sources (Doran et al 2018) and could be important in the peppermint sampling protocol as many household cleaning products contain monoterpene VOCs for fragrance.
In contrast, the sampling protocol of group 3 was to collect 25 ml of breath onto NTDs. No filtered air was provided to participants and mixed expiratory air was used despite the ability to select the end-tidal portion through capnography-controlled gating. This portion was selected to reduce sampling time as preliminary tests suggested that there was no difference in the collection of peppermint VOCs between breath portions.
A small subset of the of the peppermint compounds identified in breath was selected to compare the groups' sampling and analytical performance. This does not greatly impact the validity of the benchmarking data produced, as the five compounds were detected in breath at a wide range of concentrations. Future work could consider only eucalyptol and menthol to represent high and low concentrations.
The observed differences in the baseline levels of the VOCs between the groups are likely due to a number of factors. These may include the differences in the cleaning products used in each of the sampling rooms and variance in the average diets due to cultural norms in each country. Adherence to the protocol over tooth brushing prior to sampling may also have varied between the cohorts which may have impacted the baseline measurements as many toothpaste products contain mint compounds.
The LODS achieved by each group varied but were in a similar range in the low pptV region. It is important to consider that two of the MSs (groups 1 and 2) were used as full scan single-quadrupole devices whilst group 3 used a triple quadrupole in MRM which offers higher sensitivity. Analysing the calibration curves using single ion monitoring (SIM) on the single-quadrupole devices could have increased sensitivity but would not have reflected the analytical setups used to run the breath samples. Currently breath sampling studies are predominantly untargeted and as such MRM and SIM analysis is not appropriate. Differences in the LODS between groups 1 and 2 could be attributed to the efficiency of desorption on the different TD setups, the age of the columns used during the analysis, the tuning of the MSs.
Interestingly, despite having some of the best LOD performance measured intensities for the peppermint compounds for group three still returned to the baseline values more rapidly than for the other groups. Additionally, group 3 did not exhibit any rise in menthol levels across the sampling time and was excluded from the calculation of the benchmarking values for this compound. Group 1 exhibited a much larger rise in the levels of menthone and menthol from the baseline than groups 2 and 3. Given that the calibration curves show similar sensitivity to these compounds between the groups it is possible that the sampling setup is responsible for these differences. For example, the ReCIVA, used by group 1, places the sorbent tubes directly under the participant's mouth reducing the surface area that VOCs have to interact with prior to capture potentially increasing its recovery. The age of the peppermint capsules used to perform the sampling is another potential point of variability. All the capsules were purchased as part of the same production batch and used within the use-by dates but sample acquisition was performed across several months with the cohort from group 1 recruited first. It is possible that some compounds are lost from the capsule more rapidly than others leading to reduced intensity in the breath. We suggest that if the benchmark is adopted by the community rigorous capsule headspace sampling should be performed prior to breath sample collection to check the level of compounds present.
The washout time was selected as a benchmarking metric it captures information about all aspects of a sampling and analytical methodology. This value will also include intra-participant variation over the short and long term, as well as differences in inter participant washouts. These important factors will be assessed in a future synoptic paper that will include data from all the different analytical techniques used by members of the Initiative. Despite the fact that the time to washout the peppermint compounds represents a complex mix of factors it still represents a useful number. If a group performs the peppermint test and fails to achieve similar results to the consensus values then it knows that something is wrong with its procedures. By comparing the analytical LODs to the overall performance it is possible to further narrow down the likely source of error in the protocols.
The standardised peppermint washout protocol is easy to implement and provides a good starting point for benchmarking performance. However, as discussed, the range of VOCs that result from it is limited. Previous work in asthma alone has highlighted aldehydes (Ibrahim et al 2011, Meyer et al 2014), ketones (Dragonieri et al 2007, Ibrahim et al 2011), esters and acids (Dragonieri et al 2007, Ibrahim et al 2011), alkanes (Olopade et al 1997, Meyer et al 2014) and sulphur and nitrogen containing compounds (Awano et al 2011, Brinkman et al 2017). Whilst acknowledging that it would be challenging to find a safe medium for individuals to ingest a mix of examples from this range of compounds, it would provide a more accurate assessment of the different strengths and weaknesses of the large variety of sampling and analytical techniques that are currently being used to sample breath (Gaude et al 2019).
5. Conclusion
In this work, we presented an initial set of benchmark values (being the washout time of five peppermint VOCs appearing in the breath after ingestion of a peppermint oil capsule) for the Peppermint Initiative. These values have been determined using a wide range of sampling and analytical equipment which reflects the current situation within the field. We believe that this work captures the resulting variability in the breath samples and provides the first cross-group quantification of breath sampling performance. We hope that the impact of this paper, and its sister papers for other techniques, will be twofold: firstly, by providing an easy to produce metric by which a group can judge the performance of their analysis, we believe that it will be easier for the breath research community to improve sampling and analytical protocols; secondly, as the community moves to greater levels of standardisation and the benchmarking standards improve, journals interested in publishing studies related to breath VOCs may require recent benchmarking values to be provided with the manuscript in order to give readers confidence in the results submitted. This work is the first effort to produce and publicly disseminate a metric by which the performance of a sampling and analytical methodology can be assessed. At this point we are not able to recommend an ideal VOC sampling protocol due to wide range of techniques used. However, as more groups perform the Peppermint protocol it will be possible to determine if certain methodologies yield better benchmarking values suggesting that they should be the focus for standardisation.
For the work of the Peppermint Initiative to be successful, it is key that all the data and methodologies are shared openly to allow refinement and adoption of the standards.
Acknowledgments
We would like to thank the participants at all three institutions who took part in the study and provided breath samples. Work for one of the groups was supported by the German Center for Lung Research (DZL). Authors from that group would like to especially acknowledge Rieke Ehlers and Insa Strassburg for their great support in trial conduct and management.
Members of the initiative
Beauchamp J D4, Bellagambi G F5, Biagini D5, Cristescu S M1, Focant J-F13, Fowler S J3, Francesco F Di5, Franchina F A13, Grassin-Delyle S15, Hadjithekli A2, Hamshere K3, Henderson B1, Holz O7, Koppen G F6, Langejürgen J2, Lomonaco T5, Malásková M16, Mayhew C16, Moreno S8, Pedrotti M9, Pugliese G17, Ruszkiewicz D M2, Salman D2, Schuchardt S7, Sinues P10, Slingers G F6, Stefanuto P-H13, Thomas C L P2, Wilde M12, Wilkinson M3, Zanella D13 and Zenobi R14.
1 Exhaled Biomarkers and Exposure, Department of Molecular and Laser Physics, IMM, Radboud University, Nijmegen, The Netherlands
2 Centre of Analytical Science, Department of Chemistry, Loughborough University, Loughborough, United Kingdom
3 School of Biological Sciences, Faculty of Biology, Medicine and Health, University of Manchester, Manchester Academic Health Science Centre and NIHR Manchester Biomedical Research Centre, Manchester University Hospitals NHS Foundation Trust, Manchester, United Kingdom
4 Fraunhofer IVV, Department of Sensory Analytics, Freising, Germany
5 Department of Chemistry and Industrial Chemistry, University of Pisa, Pisa, Italy
6 VITO, Environmental Risk and Health Toxicology, Boeretang, Belgium
7 Fraunhofer ITEM, German Center for Lung Research (BREATH, DZL) Clinical Methods Development Group, Hannover, Germany
8 National Physical Laboratory, Hampton Road, Teddington, Middlesex TW11: 0LW, United Kingdom
9 Edmund Mach Foundation and Wageningen University, Trentino, Italy
10 University Children's Hospital Basel, Department of Biomedical Engineering, University of Basel, Basel, Switzerland
11 Hasselt University, Faculty of Medicine and Life Sciences, LCRC, Diepenbeek, Belgium
12 Department of Chemistry, University of Leicester, Leicester, United Kingdom
13 Organic and Biological Analytical Chemistry Group, MolSys Research Unit, University of Liège, Liège, Belgium
14 Department of Chemistry and Applied Biosciences, ETH Zurich, Zürich, Switzerland
15 Université Paris-Saclay, UVSQ, INSERM, Infection et inflammation, Département de Biotechnologie de la Santé, Montigny le Bretonneux and U Hôpital Foch, Département desmaladiesdes voies respiratoires, Suresnes, France
16 Department of Anaesthesiology and Intensive Care Medicine, Institute for Breath Research, University of Innsbruck, Innsbruck, Austria
17 Department of Anaesthesiology and Intensive Care Medicine, Rostock Medical Breath Research Analytics and Technologies (ROMBAT), Rostock University Medical Centre, Rostock, Germany
18 Molecular Physics Group, School of Physics and Astronomy, University of Birmingham, Birmingham, United Kingdom