


Abstract
Meltwater runoff from snow and glaciers in high mountain regions supports the water needs of hundreds of millions of people, but extreme events such as heatwaves modify the timing and magnitude of water available for downstream communities and ecosystems. The streamflow response to heatwaves depends strongly on heatwave timing and temperature, and the amount of snow and glacier ice available to melt. However, as ongoing climate change continues to alter both seasonal melt patterns and the frequency and intensity of heatwaves, it is not well understood how such streamflow responses will evolve relative to the seasonal cycle of streamflow. We address this knowledge gap by using long-term meteorological and hydrological datasets to characterize spatial and temporal heterogeneity in the streamflow sensitivity to heatwaves at six basins with >80 years of observations in Western Canada. We use years with earlier freshets and less snowfall as proxies of anticipated climate change, and apply a metric to describe how the streamflow sensitivity to heatwaves varies across years with different hydro-climatological characteristics. We find that in future proxy years relative to baseline years, nival streamflow is more sensitive to early spring heatwaves but less sensitive to late spring and summer heatwaves. Relative to baseline years, late spring heatwaves in future proxy years generate a smaller fraction of peak streamflow that is diminished as the freshet progresses. Our findings imply that future heatwave-driven peak flows in spring may be lessened by the diminished streamflow sensitivity to heatwaves in late spring, but this may be partially offset by excess melt during future heatwaves that are longer and hotter.

Original content from this work may be used under the terms of the Creative Commons Attribution 4.0 license. Any further distribution of this work must maintain attribution to the author(s) and the title of the work, journal citation and DOI.
1. Introduction
Heatwaves influence streamflow in nival and glacial basins by altering the timing and magnitude of snow and glacier ice melt. Heatwaves in spring primarily enhance snow melt and diminish snow resources that would otherwise persist until later in the melt season, whereas heatwaves in summer enhance glacier runoff in glacierized basins (Koboltschnig et al 2007, 2009, Zappa and Kan 2007, Thibert et al 2018, Van Tiel et al 2021, Pelto et al 2022). Two recent heatwaves in Western North America illustrate hydrological impacts of record breaking temperatures: record snow melt rates were observed during spring 2021 heatwaves in the western United States (McEvoy and Hatchett 2023), and then streamflow during the unprecedented Western North American heatwave in June 2021 broke all-time records at some Canadian basins and drove a regional streamflow response that was heterogeneous in both time and space (White et al 2023, Whitfield et al 2024). However, despite the relevance of heatwave-driven streamflow in relation to flooding (White et al 2023), ecological demands (von Biela et al 2022), and terrestrial water storage (Andersen et al 2005), it is not well understood how the streamflow response to heatwaves will evolve under climate change. Further, is it not well understood how historical variability of heatwave-driven streamflow compares to the variability of seasonal streamflow.
Streamflow in nival and glacial basins is sensitive to climatic conditions (e.g. Braun et al 2000, Koboltschnig et al 2007, Déry et al 2009, Pederson et al 2011, Godsey et al 2014, Kinnard et al 2022). The timing of spring snowmelt has been observed to advance in response to warmer temperatures (Dettinger and Cayan 1995, Whitfield et al 2002, Woo and Thorne 2003, Burn et al 2004a, 2004b, Barnett et al 2005, Stewart 2009, Clow 2010, Kang et al 2016), and a decreasing fraction of cold season precipitation falls as snow in response to warmer winter temperatures (Whitfield et al 2002, Knowles et al 2006). In Western North America, the snow regime is sensitive to temperature change (Rasouli et al 2022), and observations have revealed increases of winter snow melt (Musselman et al 2021), decreases of snow water storage (Hale et al 2023), increasing influence of rainfall as compared to snowmelt (Burn and Whitfield 2023), and declines of snow-covered areas (Stewart 2009). These shifts are expected to continue with future climate change in melt-dominated basins, with both an advancing freshet (e.g. Gleick 1987, Shrestha et al 2012, Chernos et al 2020) and a partial transition from snowfall to rain (Schnorbus et al 2014, Chegwidden et al 2020) being projected; although, the magnitude of streamflow change is sensitive to future climate trajectories (Schnorbus and Cannon 2014, Tsuruta and Schnorbus 2021). Overall, climate change is modifying when, where, and how much melt-driven streamflow occurs.
Additionally, future heatwaves are projected to become both more frequent and more intense (Meehl and Tebaldi 2004), with human influence increasing their likelihood (Stott et al 2004, Christidis et al 2015, Philip et al 2022). Taken together, climate change will alter the initial hydrological conditions at the onset of the heatwave, and the meteorological forcing during the heatwave. However, the net impact on streamflow is not well understood, with recent modeling work indicating that under warming, heatwave-generated streamflow in late spring is diminished whereas seasonal streamflow is enhanced (Anderson and Radić 2023). Yet, to our knowledge, historical variability in heatwave-driven streamflow, and its strength relative to variability in the seasonal hydrograph, has not been quantified across nival basins in the historical record.
In this study, we use long-term historical data from nearby hydrometric and weather stations within southwestern Canada to explore and gain a more detailed understanding of how streamflow has responded to heatwaves during the past century. We examine how historical heatwave-driven streamflow varies between years with different climate characteristics, and we use a new mathematical framework that characterizes the seasonal and heatwave-driven components of peak streamflow during heatwaves contrasted between characteristic 'baseline' and 'future proxy' periods within the historical record. We do not predict streamflow under future climate scenarios; rather, we gain a more detailed understanding of the streamflow response to heatwaves during the past century, to contextualize how these events may evolve under future climate change. We discuss the implications and limitations of our analysis and propose that the general approach presented can be used for climate change preparedness and adaptation efforts concerned with how river basin hydrology will change under a warmer climate.
2. Materials and methods
2.1. Study region
The study area is the region of southwestern Canada (figure 1). The western portion of the region is characterized by cool and wet winters, with warm and dry summers. Winter precipitation most often falls as rain at low elevations along the West Coast, but substantial snow accumulation occurs at higher elevations, further north, and further inland. Eastern regions on the leeward side of the Rocky Mountains are characterized by cold and dry winters with warmer and wetter summers. Streamflow across the region reflects the climatic and topographic heterogeneity, as nival regimes are predominant, with glacial regimes at high elevations in glacierized basins, pluvial regimes at low elevations on the west coast, and intermediate nival-glacial and nival-pluvial regimes transitioning between the two (Eaton and Moore 2010).

Figure 1. (a) An overview of the study region. Topographic data are from the Shuttle Radar Topography Misson (Farr et al 2007). Glacier locations are from the Randolph Glacier Inventory Version 6.0 (RGI Consortium 2017). (b) Streamflow in baseline and future proxy years for the Bow River at Banff. (c) Cumulative snowfall and freshet day anomalies for each year at the Banff weather station, highlighting baseline (blue) and future proxy years (orange).
Download figure:
Standard image High-resolution image2.2. Data
Daily streamflow data are from Environment and Climate Change Canada's HYDAT database (Environment and Climate Change Canada 2018). We use stream gage stations that are part of the Reference Hydrometric Basin Network due to their minimal missing data and minimal human disturbance. Weather station data (daily temperature and snowfall) are from the Environment and Climate Change Canada Historical Climate Data web site (Environment and Climate Change Canada 2023b). We identify six pairs of stream gage and weather stations that are nearby one another (within 20 km) and have overlapping daily observations over periods of at least 80 years (figure 1; tables S1 and S2). The weather stations are characteristically located in low-elevation settings near the stream gages (figures S1 and S2).
The study basins span a range of streamflow regimes (figure S3): the Lillooet River is glacial, with peak flows in summer due to glacier runoff; the Bow and Columbia Rivers are intermediate nival-glacial; the Similkameen River is nival; the Chilliwack River is intermediate nival-pluvial; and the Stuart River is both nival and the outlet of Stuart Lake.
2.3. Heatwave definition
The hydrological response to known, individual exceptional heatwaves can be identified on a case-by-case basis (e.g. Hughes 2008, Bedoya-Soto et al 2019, Salinger et al 2019); however, more general assessments of heatwave-driven streamflow require a suitable definition of a heatwave. Broadly, heatwaves are periods of persistent above-normal temperatures, and may be defined by absolute temperature thresholds (emphasizing heatwaves during the warm season, e.g. Pelto et al 2022) or by relative temperature percentile thresholds (considering warm anomalies throughout the year, e.g. Perkins and Alexander 2013).
We use a relative temperature percentile threshold definition because heatwaves outside of the warmest time of year can strongly influence streamflow. We define a heatwave as being a period of at least three consecutive days that exceed the 80th percentile of temperature based on a 15 d rolling window centered on the day of interest, and we calculate the duration and temperature exceedance of the 80th percentile for each heatwave (table S3). Our definition is similar to that proposed by Perkins and Alexander (2013) and used in the literature more broadly (e.g. Perkins-Kirkpatrick and Lewis 2020, Rogers et al 2022, Ruosteenoja and Jylhä 2023), but with a lesser percentile threshold (text S1). We do not perform an elevation correction for temperature because we identify relative temperature anomalies, not absolute temperature anomalies, and assume that relative warmth at the weather station location indicates relative warmth throughout the basin.
2.4. Streamflow sensitivity definition
We take a conceptually simple approach to quantify the streamflow sensitivity to identified heatwaves within the historical record, which indicates by how much streamflow increases relative to heatwave duration and temperature (figure 2). We determine the day of heatwave onset (, in days) and the streamflow at the time of heatwave onset (, in ). We calculate the maximum streamflow achieved during the heatwave (, in ), the streamflow increase during the heatwave (, in ), the duration of the heatwave (, in days); and the mean temperature during the heatwave (, in ). Finally, we define a streamflow sensitivity to heatwaves, normalized by heatwave temperature and duration (, in ) as in Anderson and Chartrand (2024, accepted). These quantities are related to each other by equations (1) and (2):


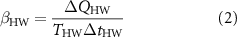

Figure 2. Two different years of streamflow at the Bow River and Lillooet River, with heatwave periods shown in red. Spring heatwaves drive increased streamflow in both basins, whereas late summer heatwaves drive increased streamflow in the glacial Lillooet River due to glacier runoff.
Download figure:
Standard image High-resolution imageusefully captures how heatwave-driven streamflow increases scale relative to the heatwave temperature and duration, which collectively describe the general heatwave severity. Scaling by and allows responses to different heatwaves at an individual basin to be better compared to one another. As a result, provides information concerning the overall impact of processes acting to generate river flows during a heatwave. We note that summarizes the relative streamflow response and is not meant to explain the physical mechanisms of streamflow generation. The differing contributions of snowmelt and precipitation are integrated within the streamflow response . As such, should be interpreted as describing when and by how much historical warm anomalies have been associated with increases to streamflow.


2.5. Definition of baseline and future proxy years
We take years with less than mean cumulative snowfall and an earlier than mean freshet to be characteristic 'future proxy' years, and years with greater than mean cumulative snowfall and a later than mean freshet to be 'baseline' years (figures 1(b) and (c); figures S3 and S4). Freshet timing and cumulative snowfall are chosen because they are consistently projected to change under future climate change (Hock et al 2019, Douville et al 2023). Given these expected changes, 'future proxy' years are historical years that have key characteristics that are expected to become more likely with continued climate change. We use years with <30 d of missing snowfall observations and we manually inspect streamflow in years with missing data to confirm that freshet streamflow is not missing.
Freshet timing is defined as the day in each year when cumulative streamflow exceeds 25% of the median cumulative yearly flow. We calculate cumulative streamflow beginning on April 1 to consider variability due to the freshet and not due to winter streamflow. On average, future proxy years are warmer by 1.2 °C, with warmer conditions in all seasons (table S4), and have 106 cm (nearly 50%) less cumulative winter snowfall relative to baseline years (figures S5 and S6; table 1). These differences are broadly consistent with projected temperature and snow depth aggregated across the study region from an ensemble of CMIP6 models, which project warming on the order of degrees and lessened average snow depth on the order of tens of centimetres (figures S7–S9; Environment and Climate Change Canada 2023a). There is substantial variability across individual models and climate scenarios, but the selection of baseline and future proxy years is consistent with a warmer future that has less snow (table 1).
Table 1. Overview of the mean yearly temperature, mean total yearly snowfall, and mean total yearly precipitation for baseline and future proxy years at all study sites. Mean yearly temperature is calculated using years without missing temperature data.
| Baseline | Future proxy | |||||||
|---|---|---|---|---|---|---|---|---|
| Site | Number of years | Mean temperature | Mean snowfall | Mean precipitation | Number of years | Mean temperature | Mean snowfall | Mean precipitation |
| Bow river | 23 | 2.1 °C | 258 cm | 478 mm | 29 | 2.7 °C | 157 cm | 423 mm |
| Columbia river | 23 | 4.4 °C | 216 cm | 500 mm | 20 | 5.4 °C | 133 cm | 425 mm |
| Similkameen river | 16 | 5.7 °C | 170 cm | 350 mm | 21 | 7.0 °C | 105 cm | 325 mm |
| Chilliwack river | 13 | 9.6 °C | 170 cm | 1548 mm | 19 | 10.6 °C | 42 cm | 1400 mm |
| Lillooet river | 17 | 7.0 °C | 332 cm | 973 mm | 14 | 8.3 °C | 145 cm | 896 mm |
| Stuart River | 15 | 1.9 °C | 220 cm | 481 mm | 12 | 4.1 °C | 124 cm | 394 mm |
Specifically, the average temperature of British Columbia is expected to reach or exceed an increase of 1.2 C within the next century across all scenarios (SSP1-1.9, SSP1-2.6, SSP2-4.5, SSP4-6.0, SSP3-7.0, and SSP5-8.5). The timing of this change depends on the scenario, with the lowest-emissions scenario (SSP1-1.9) having an average annual temperature change of 1.2 °C occurring between 2061–2080, whereas the highest-emissions scenario reaches 1.2 C between 2021–2040 (figure S7).


2.6. Characterizing streamflow responses to heatwaves
Equations (1) and (2) describe the streamflow response to discrete events. Next, we aggregate to continuous time series by averaging with a rolling window across time. We use average values from 30 d rolling windows to calculate a smoothed streamflow and streamflow sensitivity to heatwaves for the baseline case ( and ) and the future proxy case ( and ; figures S10 and S11). Subscripts '1' and '2' indicate baseline and future proxy cases, respectively, and the temporal dependence indicates that these are continuous time series. Events are aggregated by the day of heatwave onset (), meaning that a heatwave is considered a part of the 30 d window if it begins within that window. We also smooth streamflow with the same 30 d window so that the seasonal streamflow can be compared to the streamflow sensitivity to heatwaves. We do this procedure for baseline and future proxy years separately. For example: indicates the average streamflow from May 1 through May 30 over all baseline years, whereas indicates the average streamflow sensitivity to heatwaves that began between 1 May through 30 May in those same baseline years.


By transforming from discrete events to continuous time series, we can estimate peak flows as a function of heatwave timing, temperature, and duration in both the baseline and future proxy cases:
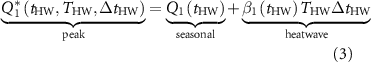
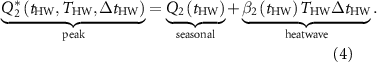
Equations (3) and (4) assume that the seasonal cycles of streamflow in baseline and future proxy years, i.e. and calculated from all days in 30 d windows, are equal to the seasonal cycles of streamflow calculated from streamflow at the time of heatwave onset in baseline and future proxy years, i.e. in equation (1). This assumption is valid so long as heatwaves occur with sufficient frequency throughout the year, such that the seasonal cycle of streamflow is captured by the streamflow sampled at the onset of historical heatwaves.


Further, we calculate the heatwave-driven fraction of peak flows:


where and are the fractions of peak flow that are generated during the heatwave for the baseline and future proxy cases, respectively.


Finally, we calculate the difference in peak streamflow between baseline and future proxy years, partitioned into seasonal and heatwave components:
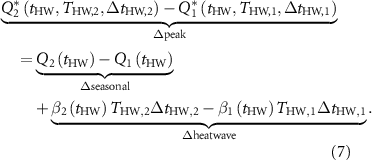
Equation (7) has the form of a plane:

where:


The coefficients, and , and the intercept, , are calculated for each day of the year (e.g. figure S10). We calculate 365 planes that describe how heatwave-driven peak flows differ between the future proxy and baseline years, as functions of heatwave timing, temperature, and duration.


3. Results
3.1. Temporal variability of streamflow sensitivity to heatwaves
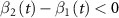
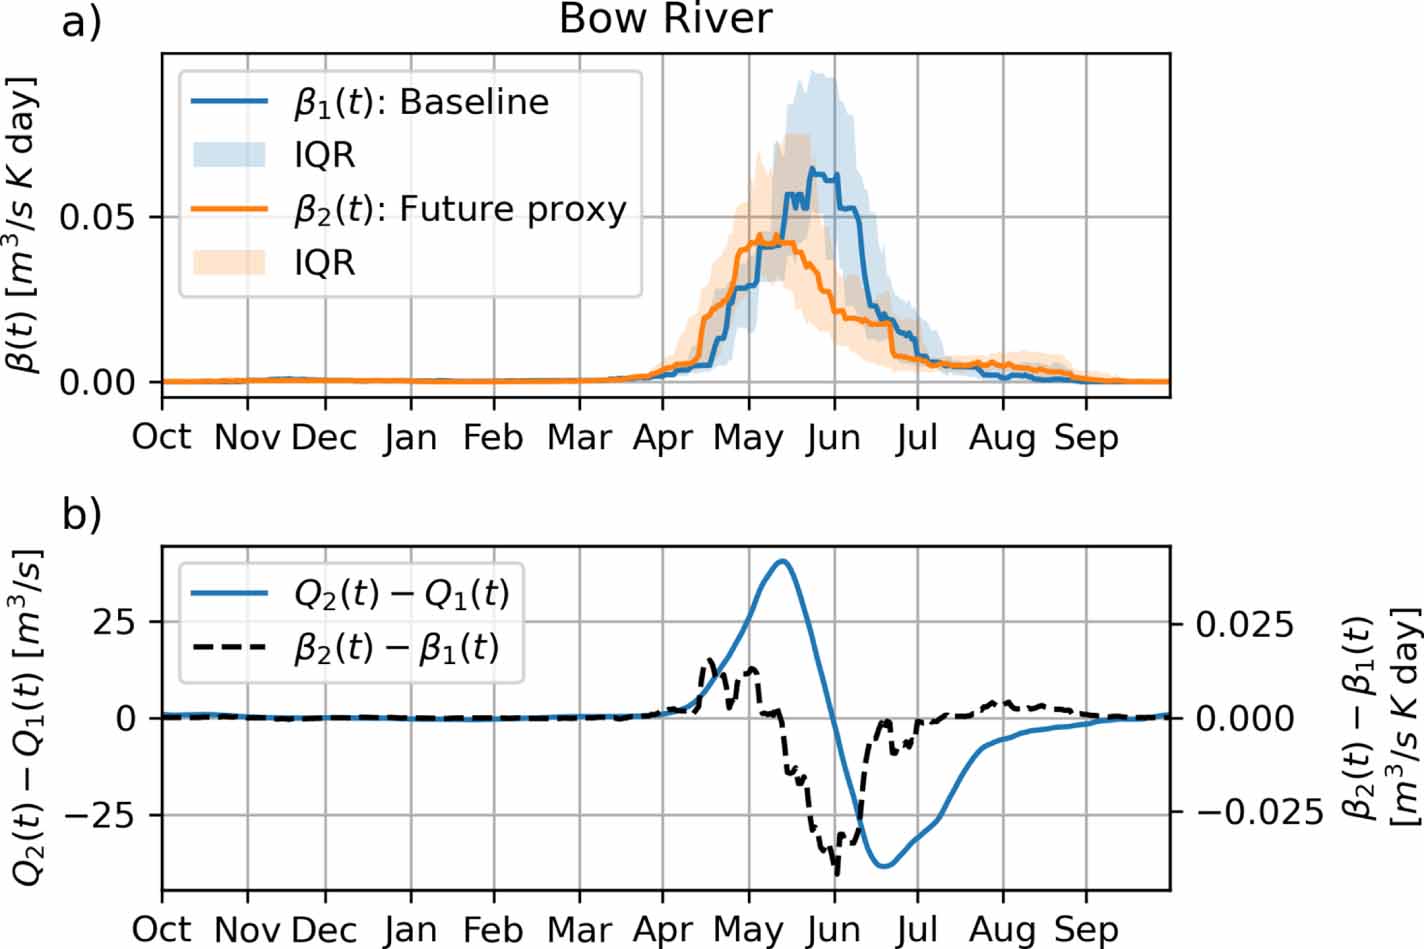
For conciseness, we first show results at a single basin (figure 3). For the Bow River, the streamflow sensitivity to heatwaves is greater in April in future proxy years relative to baseline years (figure 3(a)) due to warmer temperatures that drive enhanced snowmelt (). During this period, seasonal streamflow is enhanced (figure 3(b); ). In contrast, the streamflow sensitivity to heatwaves is lesser in May and June in future proxy years relative to baseline years (figure 3(a)) due to diminished snow reservoirs available for melt (). During this period, seasonal streamflow is first enhanced due to the advancing freshet (), and then diminished (figure 3(b); ). In other words, in late spring, the relative change in seasonal streamflow between future proxy and baseline years is of opposite sign compared to the relative change in the streamflow sensitivity to heatwaves. Furthermore, heatwaves during the spring freshet are characteristically dry with a majority of April, May, and June heatwaves having precipitation less than 1 mm d−1 (figure S12). This indicates that heatwave-driven flows during the freshet are predominantly melt-driven rather than rain-driven.


Figure 3. (a) Median and interquartile range of for baseline and future proxy years. (b) The difference in the median streamflow sensitivity between future proxy and baseline years (), and the difference in mean streamflow ().


Download figure:
Standard image High-resolution imageNext, we consider how differs relative to at each basin. A similar pattern is found in all basins in early spring (figure 4). Between approximately April 1–May 1, streamflow is relatively low, but is greater in future proxy years relative to baseline years (). During this time, the streamflow sensitivity to heatwaves is enhanced in future proxy years relative to baseline years (). Overall, in early spring of future proxy years, there is a greater streamflow sensitivity to heatwaves when seasonal streamflow is low.


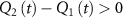
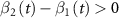

Figure 4. The difference in mean streamflow between future proxy and baseline years, compared to the mean baseline streamflow. Colours indicate the difference in median streamflow sensitivity to heatwaves.
Download figure:
Standard image High-resolution imageAll basins other than the glacial Lillooet River demonstrate a similar pattern in late spring. When seasonal streamflow is relatively large, the streamflow sensitivity to heatwaves is diminished in future proxy years relative to baseline years (). Importantly, the streamflow sensitivity to heatwaves is diminished when seasonal streamflow is both large and increasing due to the enhanced freshet. In contrast, in the glacial Lillooet River, the streamflow sensitivity to heatwaves is enhanced during late spring in future proxy years relative to baseline years.
3.2. Peak heatwave streamflow
For heatwaves at the threshold temperature (80th percentile of temperature), the difference in heatwave-driven peak flow () varies through time and by heatwave duration (figure 5). For basins where snow is the principal reservoir (Bow, Columbia, Similkameen, Chilliwack, and Stuart rivers), the streamflow sensitivity to heatwaves progresses from driving enhanced peak flows () to lesser peak flows () as the freshet progresses. In these basins, heatwaves of equal magnitude and duration drive greater peak flows during the early freshet (April), and lesser peak flows during the later freshet (June). For the glacial Lillooet River, equivalent heatwaves drive larger peak flows during all three months (figures 5(j)–(o)).


Figure 5. The difference in peak flow between future proxy and baseline years () calculated for heatwaves of varying durations, as two-week averages during the freshet (rows) at each study site (columns). Heatwave temperature is taken to be the 80th percentile of temperature at each date at each site, and we extrapolate across heatwave duration. This extrapolation assumes that the streamflow increases during heatwaves scale with heatwave duration, and is valid so long as there are sufficient melt reservoirs. The dashed black line is the 1-to-1 line, indicating equivalent heatwaves in the future and baseline cases. The color of the grid cells along the 1-to-1 line indicates if (peak flows are greater during future proxy years; blue) or (peak flows are lesser during future proxy years; red) for equivalent heatwaves in the future proxy years relative to the baseline years. The solid blue line is where , i.e. indicating pairs of heatwave durations that drive equivalent peak flows. We show results for heatwaves up to seven days in duration as this is characteristic of heatwaves in the historical record (table S3).


Download figure:
Standard image High-resolution image3.3. Fraction of heatwave-driven peak flow
and both increase with heatwave duration but differ in relative magnitude in time and space (figure 6). In April, when the freshet is nascent, in the Bow and Columbia basins (figure 1(b)) because the heatwave component is increased () more than the relatively low seasonal streamflow. However, during May and June when the freshet is more advanced. In the Similkameen and Chilliwack basins, for April, May, and June. Overall, in the future proxy case relative to the baseline case, a lesser fraction of peak flow is generated during a heatwave in all but the very initial stages of the freshet.


Figure 6. The heatwave-driven fraction of peak flow, , for baseline (blue) and future proxy years (orange), as a function of heatwave duration. Monthly results (rows) are shown for each study site (columns).

Download figure:
Standard image High-resolution imageIn contrast, the glacial Lillooet River has a greater or comparable fraction of peak flow generated during heatwaves in future proxy years, again consistent with enhanced glacier runoff in years with less snow. For the lake-outlet Stuart River, both and are smaller than at other study sites; further, in the three key freshet months.


4. Discussion
Our results quantify an increasing role of heatwave-driven streamflow during early spring, and a lessening role of heatwave-driven streamflow during late spring in nival basins. In spring of future proxy years relative to baseline years, when the freshet is advanced, streamflow is rising, and snowmelt-driven flooding is of greatest concern, heatwave-driven streamflow is diminished, peak flows achieved by equivalent heatwaves are reduced, and the fraction of peak flow that originates during the heatwave is lessened. Overall, such findings are conceptually consistent and are not sensitive to the choice of temperature percentile used to define a 'heatwave' (figures S13 and S14). Warmer spring temperatures enhance snowmelt, early spring streamflow, and streamflow sensitivity to heatwaves. However, as streamflow increases through the freshet, less snow is available to melt during a heatwave, especially during future proxy years when there is a lesser snowpack overall and more water has been released from storage through early season runoff (figures 1(b) and S3), ultimately diminishing the streamflow sensitivity to heatwaves. The relatively diminished streamflow sensitivity to late spring heatwaves is consistent with expected impacts of climate change, including reduced spring snowmelt rates (Musselman et al 2017), an earlier onset of above-freezing temperatures that shift the streamflow sensitivity to heatwaves earlier in spring (Anderson and Chartrand 2024; accepted), and warmer winter temperatures that extend the low-flow season in nival basins (Godsey et al 2014, Dierauer et al 2018, Kinnard et al 2022). These results suggest that a longer or hotter heatwave would be required to achieve the same peak flow during the high flow period (figure 5), but could only do so if there is sufficient snow for melting.
Anderson and Radić (2023) used deep machine learning models to suggest that in late spring, warmer annual temperatures cause enhanced seasonal streamflow and diminished heatwave-driven streamflow. Our findings corroborate and expand their simulated results, demonstrating that such projected signals under climate warming already exist within the variability of the past century. Yet, our results do not suggest that record-breaking streamflow responses cannot occur under climate change, as recent observations have proven (Queen et al 2021, McEvoy and Hatchett 2023, White et al 2023). Rather, our results suggest that the average streamflow sensitivity to a late-spring heatwave is lessened under the conditions associated with an earlier freshet and less winter snow.
Relative to the nival and nival-pluvial Similkameen, Stuart, and Chilliwack rivers, the glacial Lillooet River has a greater fraction of peak flow originating during June heatwaves (figure 6), consistent with observations of enhanced streamflow in more highly glacierized basins during heatwaves (Van Tiel et al 2021, Pelto et al 2022, Anderson and Radić 2023). Further, there is a greater streamflow sensitivity to heatwaves in future proxy years in June (figures 4, 6, and S13), consistent with how an earlier freshet reveals lower-albedo glacier ice earlier in the melt season, driving enhanced glacier melt (e.g. Aubry-Wake et al 2022). Van Tiel et al (2021) reveal a high degree of event-to-event variability of glacier compensation during warm and dry events, due to variability of antecedent conditions, catchment characteristics, and glacier coverage. We partially address the role of antecedent conditions by aggregating baseline and future proxy years, but our work primarily focuses on factors related to the snowmelt-driven freshet. Future work should continue to understand the variability of the streamflow response to heatwaves in glacial basins, especially how such variability relates to ongoing deglaciation.
Our analysis approach centered on was developed and applied based on three key methodological decisions: defining heatwaves, defining streamflow sensitivity to heatwaves, and defining baseline and future proxy years. We note that there is not an objective 'best' way to define these quantities. For example, to define streamflow sensitivity to heatwaves, one could use regression models to predict from a set of physically relevant predictors (e.g. positive degree days, precipitation, evapotranspiration, snow water equivalent, etc), and establish sensitivity metrics from the model parameters (e.g. Stahl and Moore 2006). Whereas our definition of is meant only to capture how the relative streamflow response varies throughout the year, such predictive models would be useful for tasks such as explaining the physical mechanisms that govern streamflow generation during warm events and how they vary through time. However, such approaches work best in data-rich environments, and become more difficult when fewer heatwaves are available for analysis (e.g. for 30 day windows in baseline years; figure S11) or when fewer predictor variables are available (e.g. in the earliest decades of the weather station observations). The definitions we use, while reasonable in characterizing how streamflow responds to persistent warm-temperature anomalies, are not intended to uncover a comprehensive description of the underlying physical processes that shape the streamflow response. Instead, we offer an empirical description of how streamflow has responded during historical multi-day warm anomalies, and we interpret the responses in the context of the known basin characteristics (figures S1 and S2), streamflow (figure S3), snow accumulation and runoff timing (figure S4), temperature (figure S5; tables 1 and S4), and precipitation (figures S6 and S12). Overall, we reveal a signal across years with different climate characteristics and we explore key implications of this signal, namely the relevance for high-flow events during the spring freshet.


One challenge is that future proxy years are not exactly representative of conditions under future climate change. For example, whereas annual regional precipitation is projected to increase (figure S9), reduced snowfall in future proxy years is associated with lesser overall precipitation than in baseline years (table 1). Further, whereas future proxy years are characterized by freshets that are earlier than average and snow accumulation that is less than average, we do not expect that every future year has these characteristics. Even under future climate change there will be variability in freshet timing and snow accumulation, and so it is possible for some future years to have later than average freshets, in combination with either more or less snow than the historical average. Given this, we clarify our use of the term 'future proxy'. The term 'future proxy' does not mean 'exact qualities of all future years'; rather, it indicates the expected average relative change of freshet timing and snow accumulation. We are not predicting future streamflow. We are describing streamflow characteristics—the sensitivity to heatwaves—that are associated with relative streamflow changes driven by the earlier melt of a declining mountain snowpack.
Our selection of future proxy years is motivated by two key features expected under climate change. However, future climate change will be more complicated than this comparatively simple approach, especially in mountain areas. There may be changes to the hydrological functioning of mountain basins (e.g. Aubry-Wake and Pomeroy 2023), and historical streamflow may not be representative of future streamflow as a result (e.g. Stephens et al 2020). For example, the loss of glacier ice (e.g. Marshall et al 2011, Clarke et al 2015), permafrost thaw (e.g. Li et al 2021), the emergence of proglacial lakes (e.g. Shugar et al 2020), suppressed blowing snow transport and sublimation (Pomeroy et al 2015), and changes to vegetation type and cover (e.g. Köplin et al 2013, Rasouli et al 2019) will further alter streamflow, with complex, and potentially offsetting, feedbacks and interactions between hydrological processes in cold regions (DeBeer et al 2016). Nevertheless, the earlier melt of declining mountain snowpacks has been observed in mountain basins for the past several decades and is expected to continue with ongoing climate change (Hock et al 2019, Douville et al 2023). Future work is needed to characterize the underlying physical processes and mechanisms that shape the variability in such streamflow responses to heatwaves, including the role of changing precipitation characteristics, to better understand how they may evolve under projected future climate change.
We consider streamflow increases during heatwaves (i.e. ). Future work should investigate the spatiotemporal variability of how, when, and where streamflow decreases due to a heatwave, as such reductions can occur both during heatwaves due to enhanced evaporative losses (e.g. Pelto et al 2022), and after heatwaves due to the earlier reduction of snow cover. Such future work is particularly relevant for the period of minimum flow in late summer and early fall.

5. Conclusions
This study offers a detailed characterization of streamflow responses to heatwaves at six basins in southwestern Canada over the past century, to better contextualize how the streamflow response to heatwaves may evolve under future climate change. We use freshet timing and cumulative snowfall as key characteristics that are expected to change under climate change. We find that in future proxy years relative to baseline years, streamflow is more sensitive to heatwaves during early spring, when streamflow is relatively small. Importantly, we find that in future proxy years relative to baseline years, streamflow is less sensitive to heatwaves in predominantly nival basins during late spring when streamflow is greatest and most enhanced due to the advancing freshet. We also find that the heatwave-driven fraction of peak flow is diminished in late spring and early summer in nival basins in future proxy years relative to baseline years.
Our work has implications for heatwave-driven spring flooding. That the streamflow sensitivity to heatwaves is diminished during the period of highest flow suggests that heatwave-driven peak flows could be reduced under climate change, unless future heatwaves are longer and/or hotter while sufficient snow remains for melting.
Acknowledgment
The authors declare no real or perceived financial conflicts. The authors were funded through the National Science and Engineering Research Council (NSERC) of Canada.
Data availability statement
All data are publicly available. Historical streamflow is available through Environment and Climate Change Canada's HYDAT database (Environment and Climate Change Canada 2018). Weather station observations are available through Environment and Climate Change Canada's Historical Climate Data web site (Environment and Climate Change Canada 2023b). CMIP6 climate projections are available through Environment and Climate Change Canada's climate projections website (Environment and Climate Change Canada 2023a). Topographic data are from the Shuttle Radar Topography Mission (Farr et al 2007) and glacier locations are from the Randolph Glacier Inventory Version 6.0 (RGI Consortium 2017). All code is publicly available (Anderson 2024).
The data that support the findings of this study are openly available at the following URL/DOI: DOI: https://doi.org/10.5281/zenodo.13504223.