


Abstract
Low carbon transition strategies of power plants are crucial to meet China's 'Dual Carbon' targets. While the Beijing–Tianjin–Hebei (BTH) region, the 'capital economic circles' of China, is suffering from serious air pollution, air quality co-benefits of low carbon transition policies in electricity system in BTH area remain unclear. Here, we estimate the impacts of low carbon transition policies, including one BAU, six single and five combined scenarios, in electricity system in BTH area on installed power capacity, CO2 emissions, air quality and human health through 2060 based on open source energy modeling system and extend response surface model ERSM models. Results show that the total installed capacity under single and combined scenarios (except RE and Tech single scenarios) fluctuates around the BAU level of 310.5 GW in 2060. While all single and combined scenarios would generally achieve 'carbon peak' in BTH electricity system before 2030, only S4 (combining technological progress, renewable energy development and CCUS) and S5 (in additional to S4, including gas-fired power generation instead of coal-fired power generation) scenarios have the potential to realize carbon neutrality by 2060. The magnitude of reductions in air pollutant emissions and improvement in air quality in BTH area from the BAU level in 2060 under combined scenarios, especially S4 and S5, generally exceed that of six single scenarios. Importantly, S5 in 2060 contributes to about 8528 avoided premature mortalities in BTH area, which are more effective than any other scenarios. The results suggest that S5 is a promising low carbon transition policy to achieve environmental improvement and produce health benefits.
Export citation and abstract BibTeX RIS

Original content from this work may be used under the terms of the Creative Commons Attribution 4.0 license. Any further distribution of this work must maintain attribution to the author(s) and the title of the work, journal citation and DOI.
1. Introduction
The Beijing–Tianjin–Hebei (BTH) region, as China's 'capital economic circle', is suffering from heavy climate change and air pollution, while are in a good economic position to introduce investment in abatement. CO2 emissions in BTH area accounted for more than 10% of the national emissions, and the power generation sector contributed to over 30% of BTH emissions during 2015–2020. Furthermore, annual average PM2.5 concentrations in BTH area reached up to 61 μg m−3 during 2015–2020 (CEMS 2021), over twelvefold that of 2021 air quality guidelines of World Health Organization (WHO 2021). Zhang et al (2020a) suggested that fossil fuel use in thermal power in BTH area mainly results in CO2 emissions and air pollution.
To achieve the 'dual carbon' 8 targes and air pollution control, the BTH area has proposed a series of incentives, including 'Measures to Reinforce Atmospheric Pollution Prevention and Control in Beijing-Tianjin-Hebei Region (2016–2017)', 'Working Plan for Atmospheric Pollution Prevention and Control in Beijing-Tianjin-Hebei Region and Surrounding Areas in 2017', 'Action Plan for Integrated Prevention and Control of Atmospheric Pollution in Beijing-Tianjin-Hebei Region and Surrounding Areas in Autumn and Winter of 2019–2020', 'Action Plan for Integrated Prevention and Control of Atmospheric Pollution in Beijing-Tianjin-Hebei Region and Surrounding Areas and Fenwei Plain in Autumn and Winter of 2020–2021'; and 'Cooperation Framework Agreement on Joint Ecological and Environmental Construction, Prevention and Treatment of the Beijing-Tianjin-Hebei Region during the 14th Five-Year Plan Period' (Wang et al 2023). Thus, emission reduction in BTH area, especially in the power generation sector is arduous and urgent. Here, we design 12 scenarios, including one Business-as-Usual (BAU), six single and five combined scenarios, to promote low-carbon transformation of energy and electricity in the BTH region. We use an open source energy modeling system (OSeMOSYS) model and an extend response surface model (ERSM) to estimate impacts of these scenarios on installed power capacity, CO2 emissions, air quality and health in BTH area through 2060.
Existing studies, such as Chu and Hawkes (2020) and Pursiheimo et al (2019), have broadly explored the decarbonization in the energy and power system and confirmed the contribution of renewable energy development to decarbonization for energy and power systems mainly based on an OSeMOSYS model. These studies mainly focused on the national level (Bartholdsen et al 2019, Müller et al 2019, Jayadev et al 2020). For China, Ye et al (2023) affirmed the role of concentrating solar power (CSP) plants in achieving China's carbon neutrality by 2060. In addition, some studies focused on other factors that may also affect the energy power system, such as coal-fired power (Liu et al 2019, Wei et al 2022), CCUS–carbon capture, utilization, and storage (Farabi-Asl et al 2020, Zhang et al 2020b, Fan et al 2021, Scharf et al 2021), and carbon sinks (Ke et al 2023).
Research on co-benefits has also been abundant in the past few years, particularly on human health from climate change and air pollution control policies (Woollacott 2018, Rafaj et al 2021, Zhang et al 2023), while few studies focused on the co-benefits of decarbonizing power systems. Specifically, Plachinski et al (2014) found that CO2 reduction policies in the power sector reduced NOX and SO2 emissions by 32% and 33%, respectively, in 2024 relative to the business-as-usual scenario. In China-specific research, some combined the economic and environmental models and focused on the whole country, such as Tang et al (2022) and Wang et al (2021). Tang et al (2022) found that by 2050, the health benefits can fully offset the carbon reduction costs, and early carbon peak target achievement can prevent more deaths from PM2.5. Wang et al (2021) calculated the site health co-benefits of CO2 emission reduction for the coal power industry using the intake fractions model and the statistical lifetime value method and found that co-benefits per ton of CO2 reduction ranged from US$51 to US$278 with high spatial heterogeneity. Furthermore, Qian et al (2021) suggested that measures to enhance energy intensity, scale, and electrification are crucial to reduce CO2 emissions and improve air quality as well. Additionally, some studies based on a multi-regional models covering 30 provinces of China mainland, such as Zhang et al (2020a) and Zhang et al (2021). They found that national and regional carbon policies would reduce CO2 and air pollutant emissions in target areas, resulting in an obvious decrease in PM2.5 concentrations. In addition to carbon pricing policies, Zhang et al (2023) estimated the co-benefits of a VOC tax on other air pollutant emission (such as SO2, NOX , VOC, and PM2.5) and even CO2 emission through 2060. They suggested that the human health benefits associated with VOC policies would partially offset policy costs. While Xu et al (2021) and Wu et al (2022) focused on the BTH region, found that CO2 emission reduction and air pollution control could considerably improve air quality and health in BTH area, lack of further exploration on the emission reduction effects of the power sector.
Existing studies above explored the national or regional effects of climate or energy policies, and lacked facility level, location-specific area. While some studies, such as Xu et al (2021) and Wu et al (2022), investigated the air quality co-benefits of carbon policies in BTH area, they seldom specifically focused on electricity system. The electricity system, contributing to the absolute proportion of BTH CO2 and air pollutant emissions, is the key sector in achieving 'dual carbon' targets and improving air quality in the BTH region (Zhang et al 2020a). Thus, we focus on the BTH power system and propose a practical low carbon transition path based on its CO2 mitigation and air quality benefits. Most of these studies above used OSeMOSYS model and estimated impacts of energy and electricity system reform on installed power capacity and CO2 emissions, but they rarely considered all technologies and fuels into assumptions, such as external power transfer (EELE) and biomass. Our model practically describes the reality, and the results would be more accurate to estimate the impacts of decarbonization instruments on installed power capacity and CO2 emissions in BTH power sectors compared to existing studies. Based on our assumptions, Furthermore, they seldom combined the above methodology with environmental models, such as an atmospheric chemical transport model and an emission-concentration response surface model, to assess health and air quality co-benefits of low carbon transition policies in electricity system. To address these gaps, we establish an interdisciplinary approach to explore facility-level air quality and health co-benefits of various low carbon transition policies in electricity system on BTH area through 2060, by combining a technology and fuel optimization embedded OSeMOSYS model and an ERSM model. The paper is organized as follows. Section 2 describes the methodology and scenario setting. Section 3 presents results and discussion, including installed power capacities, CO2 emissions, air quality and health benefits. Section 4 finally summarizes the conclusions.
2. Methodology and scenario setting
2.1. OSeMOSYS model
OSeMOSYS model is designed to calculate a portfolio of energy technologies that meet the lowest net present value cost of an energy system for a given demand and constraint (Howells et al 2011). The BTH electric power system constructed simplifies the real electric power system including generation, transmission, distribution and use. We assume that the electricity in BTH is produced by 12 power generation technologies and each power station uses the single type of fuel. Different from existing studies that merely considered local power supply, we take EELE as an important source of power supply to cover the gap in power demand according to the actual situation. Considering the difference of power load between seasons, working days or non-working days, day and night, the model has 16 time slices to describe time, and the time accuracy of the model takes 2 years as a step.
As shown in figure 1, four kinds of energy, coal, natural gas, biomass and garbage, are supplied to the power station, and the energy conversion from chemical energy to electricity is completed through 12 kinds of power generation technologies. Both the external power and the power generated by the power station need to be transported to different substations through the power grid, and then distributed to various power terminals.
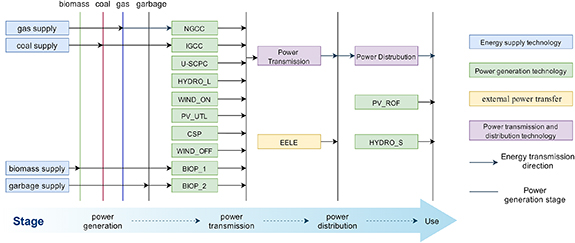
Figure 1. Electric system in BTH area designed by the OSeMOSYS model.
Download figure:
Standard image High-resolution imageTechnology and economic parameters, technology exploitable capacity, installed capacity, CO2 emission factor, capital cost of power generation technologies, fuel costs, electricity demand reserve rate, and discount rate are introduced in section S1 and table S1 of supplementary information (SI).
2.2. ERSM model
Based on energy use estimated by the OSeMOSYS model under different scenarios, fuel related air pollutant emissions, such as SO2, NOX, VOC, and PM2.5, are calculated by emission coefficients which refer to Zhang et al (2021). Air pollutant emissions in BTH electric system under the BAU scenario are based on the Air Benefit and Cost and Attainment Assessment System-Emission Inventory version 2.0 (ABaCAS-EI v2.0) (Li et al 2023). The historical changes in air pollutants in ABaCAS-EI v2.0 have been deeply explored from the aspects of 70 control policies, source contributions, and spatial-temporal characteristics. More details of air pollutant emissions could be found in the section S2 of SI. We use the ERSM prediction system, built by Tsinghua University (see Zhao et al 2018, Li et al 2023), to estimate PM2.5 concentrations in BTH area through 2060.
An ERSM model, effectively quantifies the response of PM2.5 concentrations to various emission changes through building a 'real-time' relationship between concentrations and precursor emissions on the basis of abundant simulations on chemical transports. A pf-ERSM, a multiregional prediction system, addresses the indirect effects of interaction among regions in accord with regional emission changes through incorporating polynomial functions. Specifically, the response of PM2.5 concentrations includes local chemical generation and regional transportation as well as interaction among regions. The pf-ERSM prediction system is based on the chemical transports simulated by community multi-scale air quality model with a grid spacing of 27 km * 27 km in East Asia for January, April, July, and October, four typical months. The response variables, provincial annual PM2.5 concentrations, are calculated by the average of four typical months, associated with control factors including provincial emission rates of VOC, SO2, NOx, ammonia (NH3), and PM2.5. Thus, we use pf-ERSM prediction system to estimate BTH PM2.5 concentrations.
2.3. Scenario setting
Scenario setting is a key part of low-carbon pathway analysis. We identify five key factors that affect the decarbonization of power systems and set up three main categories of scenarios, totaling 12 scenarios (see table 1).
Table 1. Scenario settings.
| BAU scenario | The amount of renewable energy is 80% of the technology exploitable capacity; technical parameters including capacity factor, efficiency and energy storage factor are improved. | |||||
|---|---|---|---|---|---|---|
| Single scenario | Tech | RE | Carb | Gas | CCUS | |
| Technical parameters have been further improved | Renewable energy is technology exploitable capacity | Two price levels are set, L-Carb price and H-Carb price | Coal-fired power generation replaced by gas-fired power generation is 0. | All carbon-emitting power plants are equipped with CCUS equipment | ||
| Combined scenario | S1 | √ | √ | |||
| S2 | √ | √ | √ | |||
| S3 | √ | √ | √ | √ | ||
| S4 | √ | √ | √ | |||
| S5 | √ | √ | √ | √ | ||
The BAU scenario examines the model's choice of power generation technology in the context of a rapid decrease in the cost of renewables in the future, and assumes that renewables is only used 80% of the technology exploitable capacity. Technology is in continuous development and progress, and phased assumptions are made on energy efficiency, transmission efficiency and capacity factor on the basis of the techno-economic assumptions in the previous section, and the remaining parameters remain unchanged. These parameters are listed in table S2 of SI.
There are 6 single scenarios: (1) technological progress scenario (Tech). Technical progress includes the improvement of capacity factor, the improvement of energy efficiency and the development of energy storage (Liu et al 2023). The parameters involved in energy efficiency include power generation efficiency and transmission efficiency. Referring to the 'Power Generation Costs 2020' released by IRENA (IRENA 2020), set future capacity factor based on historical trends in past capacity factor. The parameter settings are summarized in table S2 of SI. (2) Carbon pricing scenario (Carb). This scenario sets two different levels of carbon prices which change as shown in figure S3 of SI. The national carbon market trading data is obtained from Tianjin Climate Exchange, and the national carbon price is predicted based on the historical trading price trend of mature pilot areas, referred to as the low-carbon price scenario (L-Carb). The EU carbon market is the most mature market in the world. Currently, the EU carbon price has broken through the 100-euro mark. Drawing on the EU carbon price level, we assume that China's carbon price can reach $120/t by 2060, referred to as high-carbon price scenario (H-Carb). (3) Gas-fired generation scenario (Gas). With the continued retirement of coal-fired power units, gas-fired power generation will gradually replace coal-fired power generation, the flexible power supply will be completely powered by gas. Therefore, the maximum capacity of coal-fired power will be gradually set to 0 at the later stage of the modeling period, and a completely coal-free renewable energy power system will be obtained. (4) Renewable Energy Development scenario (RE). The installed capacity of renewable energy reaches the maximum limit that can be utilized, that is technology exploitable capacity. The scenario highlights the increasing proportion of electricity generated from renewable sources. At the same time assuming that the degree of external transfer of electricity to further improve the cleanliness, in 2050, the proportion of green power transfer 100%. (5) CCUS scenario (CCUS). The installation of CCUS in advanced coal-fired power units can capture 90% of CO2 emissions. In this scenario, all generating units that emit CO2 in 2060 will be equipped with CCUS. Here, referring to the hypothesis of Chen et al (2021) on CCUS cluster deployment of China's coal-fired power plants under the carbon neutrality goal, CCUS technology would be widely applied in 2030. The cost of installing CCUS in thermal power units will be 712 $/KW, while the cost of biomass power generation units will increase by 850 $/KW, with an annual decrease rate of 3%. The above costs refer to the cost assumption of installing CCUS units by Du et al (2023).
The implementation effect of a single policy has certain limitations, which would be not enough to achieve the goal of carbon neutrality. The single scenarios thus are combined to enhance carbon reduction effectiveness. Carbon pricing and CCUS both use price transmission mechanisms to force the transformation of the energy and power system. We assume that carbon pricing and CCUS would be only chosen between them. Thus, five combined policy scenarios are designed as follows. (1) S1 represents comprehensive technological progress and renewable energy. Explore the impact of two positive promoting effects on the transformation of energy and power systems; (2) S2 represents a combination of technological advances, carbon pricing, and renewable energy. (3) S3 considers gas-electric substitution on the basis of S2, that is, a high-proportion renewable energy power system with gas-electricity as the main flexible power supply under the comprehensive influence of multiple factors. (4) S4 considers renewable energy, technological advancements, and CCUS technologies in a comprehensive manner. And (5) S5 considers gas-electric substitution on the basis of S4.
3. Results and discussion
3.1. Installed power capacities
The change in installed capacity of gas and electricity presents an 'inverted U-shaped' pattern from 2020 to 2060. The installed capacity under the H-Carb and Gas scenarios during 2020–2060 exhibits an increasing trend, and changes in installed capacity under RE scenario is relatively stable. Table S4 of SI shows key indicators including total installed capacity, percentage of reproducible installation, coal-fired power generation, and gas-fired power generation, etc., under BAU and single scenarios in 2060. The total installed capacity under the single scenarios (except RE and Tech) generally fluctuates around the BAU scenario of 310.5 GW in 2060. The installed capacity of RE reaches up to 350.8 GW in 2060, and the installed capacity of Tech scenario are only 282 GW. The differences in installed capacity under the single scenarios are related to the mechanisms of the five factors as follows. The Tech could reduce CO2 emissions by reducing energy use during generation, transmission and distribution, increasing the available capacity of the power plant and meeting more electricity demand with the same capacity. Increasing the installed capacity of renewable energy can reduce the installed capacity of thermal power, thereby reducing the CO2 emissions of the energy power system. Replacing coal-fired power generation with gas and electricity aims to reduce CO2 emissions by changing the proportion of clean energy installed. CCUS technology has a relatively small impact on the power structure. RE and Tech scenarios have a relatively high proportion of renewable energy installed capacity, which can reach around 83%, fully demonstrating the importance of these two factors in improving energy structure.
Trends in the installed structure associated with the combined scenarios are consistent with the corresponding single scenarios. The proportion of installed capacity of renewable energy in S1 and S2 would be 90.9% in 2060. S3 achieves the highest proportion of renewable energy power systems with 91.8% in 2060, followed by S4 with 91.3%. Based on the installation of coal, gas and biomass power under combined scenarios (see table S6), compared to S1–S3 scenarios, S4 and S5 scenarios adding CCUS units gradually decrease the installed capacity of traditional coal-fired power, while the installed capacity of traditional biomass energy would be only reduced after the expansion of the installed capacity. This indicates that biomass power generation would shift towards low-carbon intensive BECCS power plants after experiencing a mature period in its initial scale, that is, BECCS power plants are with cost advantages in 2042. S4 and S5 are generally considered to be the most ideal energy and power optimization paths, which are specifically introduced in figure 2. However, S4 results in 26.53 GW of coal-fired power installed capacity in 2060, which is higher than the coal-fired power installed capacity associated with S1 and S2, but lower than the BAU level (40.5GW). This is because that CCUS technology delays the retirement of coal-fired power generation. Under S5, importantly, all coal-fired power generation would be out of the power system in 2060.
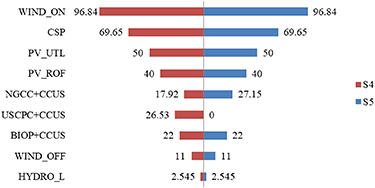
Figure 2. Installed capacity under S4 and S5 in 2060 (GW).
Download figure:
Standard image High-resolution image3.2. CO2 emissions
Figure S6 of SI depicts CO2 emissions of the electric power generation under the BAU and single scenarios in BTH area from 2020 to 2060. Under the BAU, CO2 emissions of the electric power generation in BTH region generally exhibit an 'inverted U-shaped' trend during the period of 2020–2060, reaching a peak (428.3 Mt) in 2038 and gradually decreasing associated with an increase in renewable energy generation capacity. However, the amount of CO2 emissions in 2060 is over 341.5 Mt, which is still far from achieving carbon neutrality target. In the single scenario, except for the L-Carb price scenario, which will not achieve the goal of peaking CO2 emissions before 2030, all other scenarios will peak in 2028. CCUS scenario results in the largest reductions in CO2 emissions through 2060, while other single scenarios have limited reductions, especially L-Carb, almost coinciding with the BAU curve.
All of the composite scenarios can peak before 2030, and S4 and S5 scenarios have great potential to achieve carbon neutrality in 2060. Compared to CO2 emissions reductions associated with the single scenarios, combined scenarios result in larger CO2 emission mitigation (see figure 3). For example, S1 reduces 87.6 Mt more emissions than the RE scenario, 122.5 Mt more emissions than the Tech, and 210.1 Mt more compared emissions than the BAU. The CO2 emissions from 2020 to 2060 under S2 and S3 scenarios are at similar level, although the flexible power supply under these scenarios is different (one is ultra-supercritical coal-fired power generation, the other is natural gas combined cycle power generation). This indicates that the emission reduction effect of gas-fired power replacing coal-fired power is limited. Similarly, in the comparison of S4 and S5, the magnitude of CO2 reductions associated with gas electricity replacing coal-fired power is still small. Thus, changes in CO2 emissions under S4 and S5 are similar through 2060. Under combined scenarios, CCUS, the main technology to keep the flexibility of power system, is more effective than carbon pricing. In 2060, CO2 emissions associated with S4 and S5 would be reduce to about 12 Mt. Carbon neutrality in 2060 would be fully achieved if direct air capture, biomass carbon cycle, and carbon sink, etc. are taken into account.
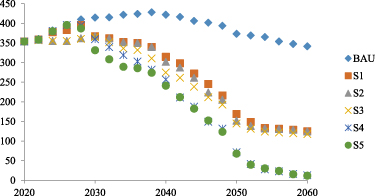
Figure 3. CO2 emissions under combined scenarios during 2020–2060 (Mt).
Download figure:
Standard image High-resolution image3.3. Air quality implications
Similar to CO2 emissions, all air pollutant (SO2, NOX , VOC, and PM2.5) emissions of power generation sector in BTH region through 2060, under all policy scenarios are reduced relative to the BAU. This finding is supported by previously studies that suggested that the air quality co-benefits of some climate policy options exist (West et al 2013, Thompson et al 2016, Li et al 2018, Zhang et al 2024). Explanation of air pollutant reductions is associated with a decrease in fuel use in power generation sector, which is similar to CO2 emission reductions. Thus, PM2.5 concentrations in BTH area under all policy scenarios decrease at different level. The combined scenarios decrease more PM2.5 concentrations in BTH area compared to the single scenarios.
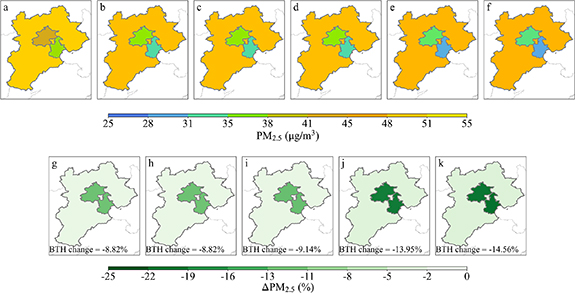
Figure 4 shows regional PM2.5 concentrations in absolute and relative terms in 2060 under combined scenarios. S4 and S5 which potentially achieve carbon neutrality in 2060 improve air quality in BTH region more effectively than S1–S3. While the regional average PM2.5 concentrations are 43.94 μg m−3 in 2060 BTH area under BAU scenario, S4 and S5 drop PM2.5 conventions by 13.95% and 14.56%, respectively. Specifically, S4 and S5 results in Beijing and Tianjin exposing to PM2.5 concentrations below 35 μg m−3 in 2060 (meeting the national Class II 9 standard for PM2.5 conventions), while Hebei is likely to expose to PM2.5 concentrations over 48 μg m−3. This is because that air pollutant emissions of thermal power generation in Hebei are not the main cause of air pollution. This indicates that energy-intensive sectors in Hebei, such as nonmetallic mineral product manufacturing, smelting and pressing of metals and chemical industry, calls for attention. Furthermore, the differences of regional PM2.5 concentrations in BTH area under S1–S5 exceed these under the BAU scenarios. For instance, S4 and S5 enlarge regional differences in PM2.5 concentrations to more than 18 μg m−3 in 2060, while the BAU level is merely 12.53 μg m−3 in 2060. This implies that regionally differentiated policies for air pollution control would be better than the uniform policies to promote environmental equity (Zhang et al 2021, 2024). Thus, the BTH area would make coordinated efforts to the improvement in air quality based on their own characteristics of industry and resources. Figure S5 shows changes in air quality in BTH area associated with the single low carbon transition policies in electricity system from the BAU level in 2060. The single scenarios result in BTH area exposing to average PM2.5 concentrations at the range of 38.5–43.91 μg m−3 in 2060. This indicates that single scenarios are far inferior to the combined scenario, especially S4 and S5. Thus, S4 and S5 policies are highly recommend for regional air quality improvement.
Figure 4. Spatial distribution of annual average PM2.5 concentrations in BTH area under BAU (a), S1 (b), S2 (c), S3 (d), S4 (e) and S5 (f) scenarios, and changes in PM2.5 concentrations under S1 (g), S2 (h), S3 (i), S4 (j) and S5 (k) scenarios from the BAU level in 2060.
Download figure:
Standard image High-resolution image
3.4. Health benefits
Improvement in air quality benefits to human health (Thompson et al 2014, Zhang et al 2023). Following the estimation of Cao et al (2011) that an increase of 10 μg m−3 PM2.5 concentrations leads to a 0.9% increase in cardiovascular, total respiratory, and lung cancer mortality, we calculate avoided mortalities under different low carbon transition policies in electricity system in 2060 BTH area from the BAU level as shown in supplementary table S7. Combined policies (S1–S5) contribute to about 5192, 5192, 5422, 8189 and 8528 avoided premature mortalities in BTH area in 2060, respectively. The level of regional health benefits associated with combined policies is much higher than that of regional health benefits associated with the single policies in 2060, which is caused by more air quality improvement under combined scenarios as above. Human health benefits in BTH area associated with S4 and S5 policies in 2060 are much larger than the benefits associated with S1–S3 policies, especially S5. The level of human health benefits in BTH area in 2060 under S5 is higher than that of Zhang et al (2023). This is because S5 which is highly recommended is consist with more fuel related effective measures and policies. Additionally, human health benefits in Beijing under each policy scenario are larger than these in Tianjin and Hebei, which indicates that further end-of-pipe control measures for Tianjin and Hebei to reduce non-combustion air pollutant emissions are needed.
4. Conclusion and policy implications
Based on the 'dual carbon' targets, this study explores the impacts of low carbon transition policies in BTH electricity system on installed power capacity, CO2 emissions, air quality and human health through 2060 based on OSeMOSYS and ERSM models. The total installed capacity of the single and combined scenarios fluctuates around the BAU level of 310.5 GW in 2060 (except RE 350.8 GW and Tech 282 GW). The single RE and Tech scenarios contribute to an increase in the proportion of renewable energy installed capacity, which are highly recommended for strategy design in power generation sector. Only S4 and S5 combined scenarios have the potential to realize carbon neutrality by 2060 on the basis of reaching carbon peak in BTH electricity system. CCUS is confirmed to be more effective in CO2 reductions in power system than carbon pricing. Additionally, S4 and S5 have advantages in air pollutant emissions reductions and air quality improvement compared to other scenarios. From the perspective of human health, S5 is recommended for policymakers as it avoids more premature mortalities than other policies. However, the policy costs of these instruments are not estimated and would be further incorporated in our further research. Policy costs would significantly affect policy implementation, while we have not yet estimated costs of policies designed in the paper. Thus, we would assess policy costs in our further research to ensure that policy recommendations are more easily implemented.
The following policy suggestions are put forward in view of the above conclusions.
First, based on the characteristics of same root, same origin, and simultaneousness of CO2 and air pollutants, a decrease in fuel use would mitigate CO2 and air pollutant emissions (Thompson et al 2016). The emissions in BTH power sector mainly come from fossil fuel combustion. From the perspective of source control, thus, increasing renewable energy capacity is an important measure to reduce CO2 and improve air quality. The BTH region would increase the proportion of renewable energy and sustainable energy installations while vigorously expanding wind and solar power generation. Thus, S5 is recommended to be an ideal energy and power optimization path. Further strengthen research and development to surmount technologies that reduce energy use in power generation, transmission and distribution and increase the available capacity of power plants are needed. Efforts to promote the development of energy storage and distributed energy resources configuration, in order to meet more electricity demand, are important for the sustainable development of the electric system.
Second, to improve carbon reduction and meet 'dual carbon' objectives, policymakers should focus on combining renewable energy, technical innovation, and CCUS (S4) and adding gas-to-electricity replacement (S5). Power generation sectors would speed up efforts to increase CCUS units, improve low-carbon technology innovation capabilities, conduct CCUS technology demonstration projects. Local governments would issue relevant support policies and regulatory systems and accelerate the promotion of new breakthroughs in hydrogen energy and low-speed wind power generation. Furthermore, the carbon pricing level in this study to some extent reflects the actual carbon price traded in China's emission trading market, but it is much lower than the EU emission trading scheme (EU ETS), resulting in limited emission reduction effects. The reason is that China's ETS only involves the power generation sector, with loose carbon quotas, which results in oversupply in the market at an unreasonable carbon price. The power sectors in BTH region have insufficient emission reduction motivation. To fully leverage the role of carbon pricing, this study suggests generally expanding the coverage of China ETS.
Third, Hebei exposing higher PM2.5 concentrations in 2060 relative to Beijing and Tianjin, under all decarbonization scenarios, calls for further air control measures. End-of-pipe pollution controls for fuel-related power generation system in Hebei should be taken into account. Furthermore, the differences of regional PM2.5 concentrations in BTH area associated with decarbonization measures in electricity system are enlarged from the BAU level. Regionally differentiated decarbonization policies for air pollution control are recommended. Further effective incentives to promote coordinated regional development in terms of growth, environment and energy is still a theme for the BTH area.
Acknowledgments
This study is supported by the Humanities and Social Sciences Youth Foundation, Ministry of Education of the People's Republic of China (No. 22YJC790167), Shanghai Pujiang Programme (23PJC050), Natural Science Foundation of Beijing (No. 9222011), and Humanities and Social Science Research Foundation, Ministry of Education of the People's Republic of China (No. 20YJA790018).
Data availability statement
All data that support the findings of this study are included within the article (and any supplementary files).
Conflict of interest
No potential conflict of interest was reported by the authors.
Footnotes
- 8
The 'dual carbon' targets refer to: China will achieve 'carbon peak' before 2030 and 'carbon neutrality' by 2060.
- 9
Supplementary data (<0.1 MB XLSX)
Supplementary data (10.0 MB DOCX)