Abstract
Lakes are sentinels of environmental change. In cold climates, lake ice phenology—the timing and duration of ice cover during winter—is a key control on ecosystem function. Ice phenology is likely driven by a complex interplay between physical characteristics and climatic conditions. Under climate change, lakes are generally freezing later, melting out earlier, and experiencing a shorter duration of ice cover; however, few long-term records exist for large, high-elevation lakes which may be particularly vulnerable to climate impacts. Here, we quantified ice phenology over the last century (1927–2022) for North America’s largest high-elevation lake—Yellowstone Lake—and compared it to seven similar lakes in northern Europe. We show that contrary to expectation, the ice phenology of Yellowstone Lake has been uniquely resistant to climate change. Indeed, despite warming temperatures in the region, no change in the timing nor duration of ice cover has occurred at Yellowstone Lake due to buffering by increased snowfall. However, with projections of continued warming and shifting precipitation regimes in the high Rocky Mountains, it is unclear how long this buffering will last.

Original content from this work may be used under the terms of the Creative Commons Attribution 4.0 license. Any further distribution of this work must maintain attribution to the author(s) and the title of the work, journal citation and DOI.
1. Introduction
Lakes are sentinels of environmental change as they accumulate and reflect changes to local and regional watersheds through time (Adrian et al 2009, Moser et al 2019). Most lakes are located at temperate to arctic latitudes in the Northern Hemisphere (Verpoorter et al 2014) and experience strong seasonality as they transition annually from open water to a frozen surface. Ice phenology has been recorded on a wide range of lakes around the world and shifts in ice duration have become a hallmark of climate change impacts (Magnusson et al 2000, Sharma et al 2019). Generally, warming temperatures are leading to later ice-on and earlier ice-off dates, expanding ice-free periods (Lopez et al 2019), and in some cases eliminating ice cover intermittently or entirely (Sharma et al 2019). For instance, across spatially and morphologically distinct lakes in the Northern Hemisphere, ice-on is occurring on average 11.6 d later per century with ice-off shifting ahead by 8.1 d (Magnuson et al 2000, Woolway et al 2020). The duration of ice cover influences the timing and duration of stratification, which controls nutrient mixing and oxygenation in lakes, making it one of the most critical drivers of biological activity (Woolway et al 2021). Thus, changes in ice phenology can have cascading implications extending from physical characteristics to food webs, and from microfauna to higher trophic levels.
Although ice duration is declining for most lakes due to climate change, substantial variation exists in ice phenology trends over space and time (Weyhenmeyer et al 2011). Predicting changes in phenology remains challenging, particularly for lakes with unique characteristics (e.g. at exceptionally high elevation and/or extremely large). For instance, deeper lakes take longer to cool in fall and thus are more susceptible to intermittent ice cover (Woolway et al 2020). Surface area also matters; greater fetch yields more wave action which can inhibit or delay ice formation (Magee and Wu 2017). High elevations, which show large gradients in weather over small distances (Mountain Research Initiative EDW Working Group 2015), are expected to be particularly susceptible to warming. While long-term records for high-elevation lakes are rare, one 36 year record of small mountain lakes (<50 hectares) in the Colorado Rockies found a link between a 9 day advance in ice-off and declining spring snowfall in the region (Christianson et al 2021). The complex interplay between environmental factors is further complicated by the importance of both temperature and precipitation to ice formation and persistence. While most regions of the globe are experiencing warming, changes in precipitation are more heterogeneous over small spatial scales with higher uncertainty in future projections (Lopez-Cantu et al 2020). This uncertainty is important as precipitation as rain can reduce ice thickness and accelerate melting, while snowfall, particularly in the winter, tends to insulate the ice and increase albedo, delaying the onset of ice break up (Duguay et al 2003, Brown and Duguay 2010).
In this study, we evaluated links between climate and ice phenology at Yellowstone Lake, North America’s largest lake above 2000 m. Yellowstone Lake is located in Yellowstone National Park, the centerpiece of the ∼8 million hectare Greater Yellowstone Ecosystem (GYE). Since 1950, the GYE has experienced steady warming with temperatures rising by 1 °C in the watershed that includes Yellowstone Lake (Upper Yellowstone; Hostetler et al 2021). Elevations above 2100 m in the GYE are warming even faster with a rise of 1.4 °C from 1980–2018 (Hostetler et al 2021). Of note is Yellowstone Lake’s massive size and the rarity of the record we present; at 35 220 hectares, the surface area of Yellowstone Lake is ∼800x greater than lakes included in other recent studies of mountain lake ice phenology in North America (Preston et al 2016, Christianson et al 2021, Smits et al 2021). And, if included in a recent database of ice phenology records for 78 lakes in the Northern Hemisphere, (Sharma et al 2022), Yellowstone Lake would have ranked as the highest elevation and 9th largest lake. Given the high elevation of Yellowstone Lake paired with rapid contemporary warming in the region, we expected strong shifts in ice phenology, with later ice formation and earlier break-up over time. Alternatively, however, was the possibility that controls on ice phenology for Yellowstone Lake are more similar to other large lakes where ice phenology is shifting more slowly. Thus, a large lake at relatively high-elevation presents an interesting scenario for better understanding ice phenology under climate change.
In this study, we addressed three questions: (1) Has ice phenology changed for Yellowstone Lake over the last century (1927–2022)? (2) How does Yellowstone Lake’s ice phenology trend compare to similarly large lakes that are at either high-elevation (>1000 m above sea level) or high-latitude (>50 °N)? And, (3) how are climate factors linked to interannual variability and long-term trends in ice phenology at Yellowstone lake? Surprisingly, we found no change in timing nor duration of ice cover at Yellowstone Lake over a 96 year record. This trend differed markedly from seven similarly sized high-latitude lakes that all exhibited change in at least one metric: ice on, ice off, or ice duration. For now, an increase in snowfall is buffering the lake’s ice phenology against change; however, projections of how future temperature and precipitation regimes will shift above 2100 m in the Upper Yellowstone River watershed (i.e. Hostetler et al 2021) suggest this long-term buffering may be coming to an end. Collectively, our study highlights the inadequacy of a one-size-fits-all rule for ice phenology change in cold lakes and the power of long-term data for tracking environmental change.
2. Methods
2.1. Study area
Yellowstone Lake is located at a moderate latitude (∼44.5° N) in Yellowstone National Park in northwestern Wyoming, USA. With a surface area of 341 km2 (35 220 hectares), a maximum depth of 120 m, a volume of 14.9 km3, and an elevation of 2357 m, Yellowstone Lake is the largest high-elevation lake in western North America (Kaplinksi 1991). Yellowstone Lake mixes twice a year and has been typically ice-covered from late December through May (Benson 1961). Because Yellowstone Lake lies on the southeastern margin of the Greater Yellowstone Volcanic Caldera, water chemistry and temperature of about one-third of the lake are influenced by hydrothermal activity through hot-water vents and fumaroles (Aguilar et al 2002, Morgan et al 2007, 2022). From 1976–2018, surface water temperatures ranged from ∼9 °C–18 °C during the ice-free season (Koel et al 2019).
2.2. Long-term data acquisition
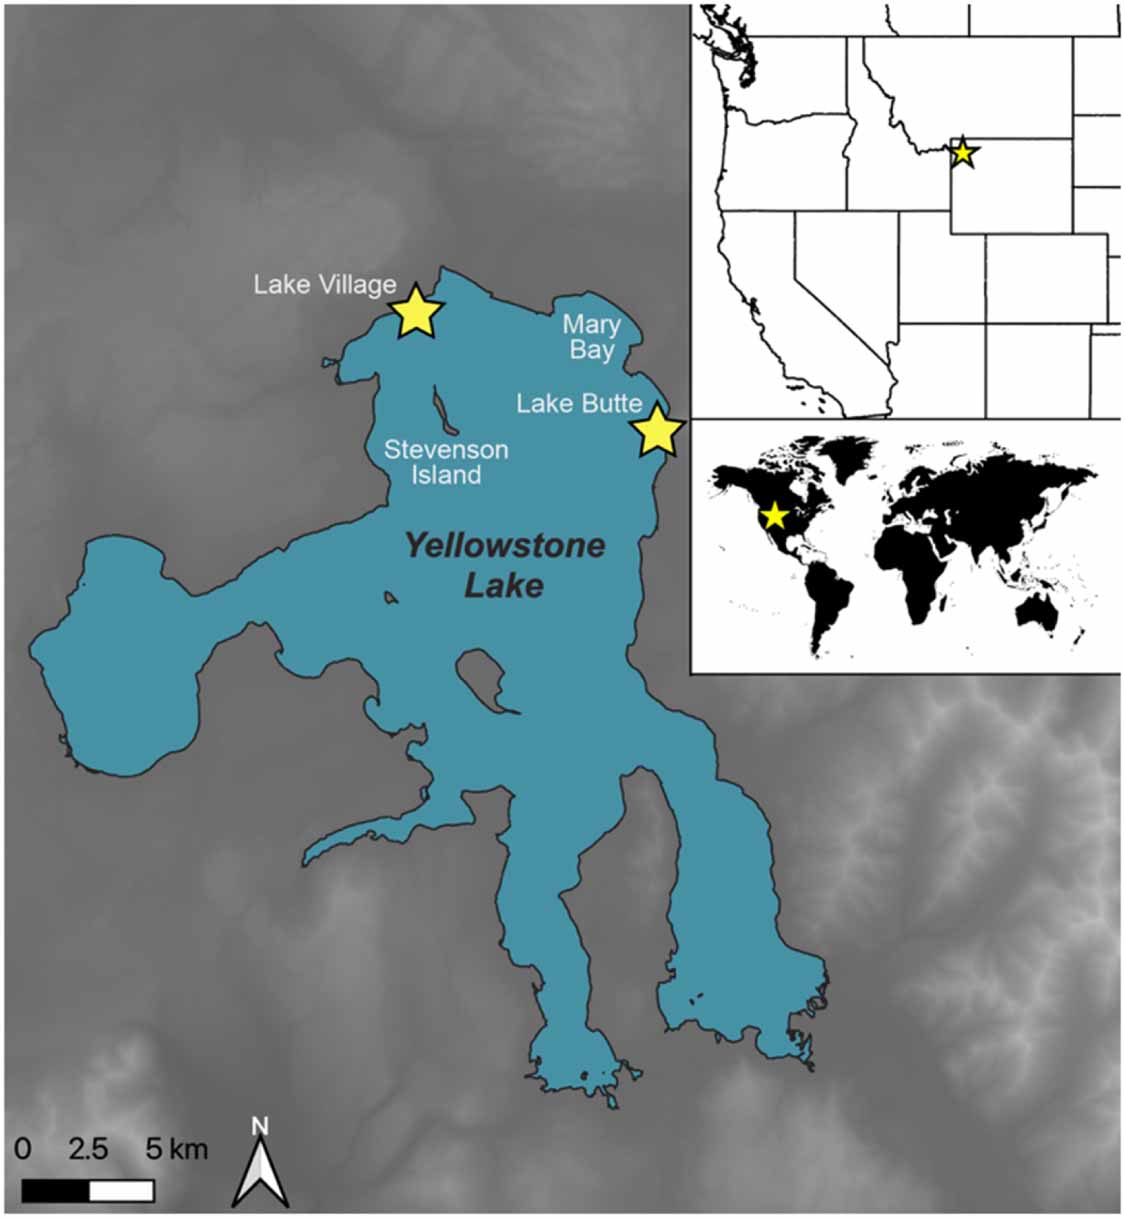
The ice-off date for Yellowstone Lake has been recorded each year by Lake Village Ranger Station staff since 1927. The ice-on date has also been recorded since 1931. For this record, ice-on is defined as the date when ice cover is continuous across the northern section of the lake (i.e. from Mary Bay to Stevenson Island) when viewed from the Lake Butte overlook (figure 1). For ice-off, the opposite is true; it is the date each year when ice was no longer continuous from the same overlook. We compiled these records from a combination of sources including the Yellowstone National Park archives, Yellowstone National Park Resource Management, and staff records from ranger stations. We obtained corresponding climatic data for the same time period (1927–2022). Daily air temperatures (maximum and minimum) and precipitation were retrieved from the Water Resources Data Systems which is maintained by the State Climate Office at the University of Wyoming (www.wrds.uwyo.edu/) for the Yellowstone Lake weather station (#485345) at the Lake Village Ranger Station (figure 1). From these data, we calculated annual and seasonal air temperatures. Daily precipitation amounts were converted into rainfall and snowfall based on an empirically derived snow probability function (Dai et al 2008; see supporting information for details). To place Yellowstone Lake in a broader context of cold lake ice phenology, we filtered the Sharma et al (2022) data set to identify lakes that (a) fully freeze in winter, (b) are similarly large (>100 km2), (c) have a similar ice phenology record available (1927–2022 ± a few years), and (d) are at either similarly high-elevation (>1000 m) or high-latitude (>50 °N). Using these criteria, we identified seven northern European lakes for comparison: Lakes Baikal, Haukivesi, Kallavesi, Kallsjön, Näsijärvi, Päijänne, and Pielenen. Comparison lakes are distributed among Russia (Baikal), Finland (Haukivesi, Kallavesi, Päijänne, Näsijärvi, Pielenen), and Sweden (Kallsjön). Basic physical details for each lake included in this study are provided in table S1.
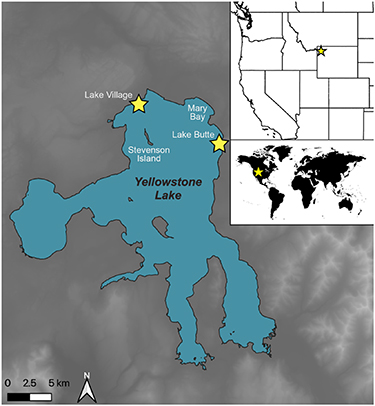
Figure 1. Map of Yellowstone Lake in northwestern Wyoming, USA, with yellow stars and labels indicating key landmarks where ice phenology was assessed. Inset maps: (Top) Yellow star indicating the location of Yellowstone Lake in the western United States. (Bottom) Yellow star indicating the location of Yellowstone Lake globally.
Download figure:
Standard image High-resolution image2.3. Data analysis
All statistical analyses and data visualizations were conducted in R version 4.2.1 (R Core Team 2022). For Yellowstone Lake, we constructed time series models to test whether the timing of ice formation and breakup changed over a century and to investigate potential climatic drivers. We tested how weather conditions of the preceding months impacted ice phenology (ice-on, ice-off), such that only data prior to the mean date of ice-on or ice-off were included in models. For modeling purposes, we summarized the daily weather data at both monthly and seasonal timescales. For ice-on models, we calculated cumulative minimum, maximum, and mean daily air temperatures and precipitation totals (as rain or snow) for individual months (October, November, December) as well as two seasons (fall and winter). We defined fall as October–November (inclusive) and winter as December–February (inclusive). For ice-off models, we followed a similar process, but considered climatic summaries for the individual months of March–May and aggregated seasonal spring (April–June, inclusive) and winter (January–March, inclusive). For ice duration models, we considered all of the above climatic covariates in the corresponding water year (1 Octobor to 30 September).
We modeled the trends in and drivers of ice-on, ice-off, and ice duration using generalized additive models (GAMs; Hastie and Tibshirani 1987, Wood et al 2017) using a gamma family with a logistic link function via the mgcv package (version 1.8–40; Wood 2019). Model diagnostic checks indicated that we did not need to account for temporal autocorrelation in our models. For both ice-on and ice-off, we began with a ‘full’ model that included all predictors and only used uncorrelated variables in models (|r| < 0.7; table S2). We ultimately report the models that balance parsimony and deviance explained; many models performed similarly and are listed in table S2 for comparison. Similarly, for all climatic variables and Yellowstone Lake, we analyzed the time series using GAMs to test for changes over time. For each time series, we additionally calculated the first derivatives in the GAMs time series to test for an acceleration or deceleration in the trend; a period was significant if the confidence intervals around the first derivative did not overlap with zero. For the broader lake comparison, we fit GAMs for ice-on, ice-off, and ice duration for the seven additional lakes and the same time period as Yellowstone Lake; however, assessing the drivers of those trends was beyond the scope of this study.
3. Results
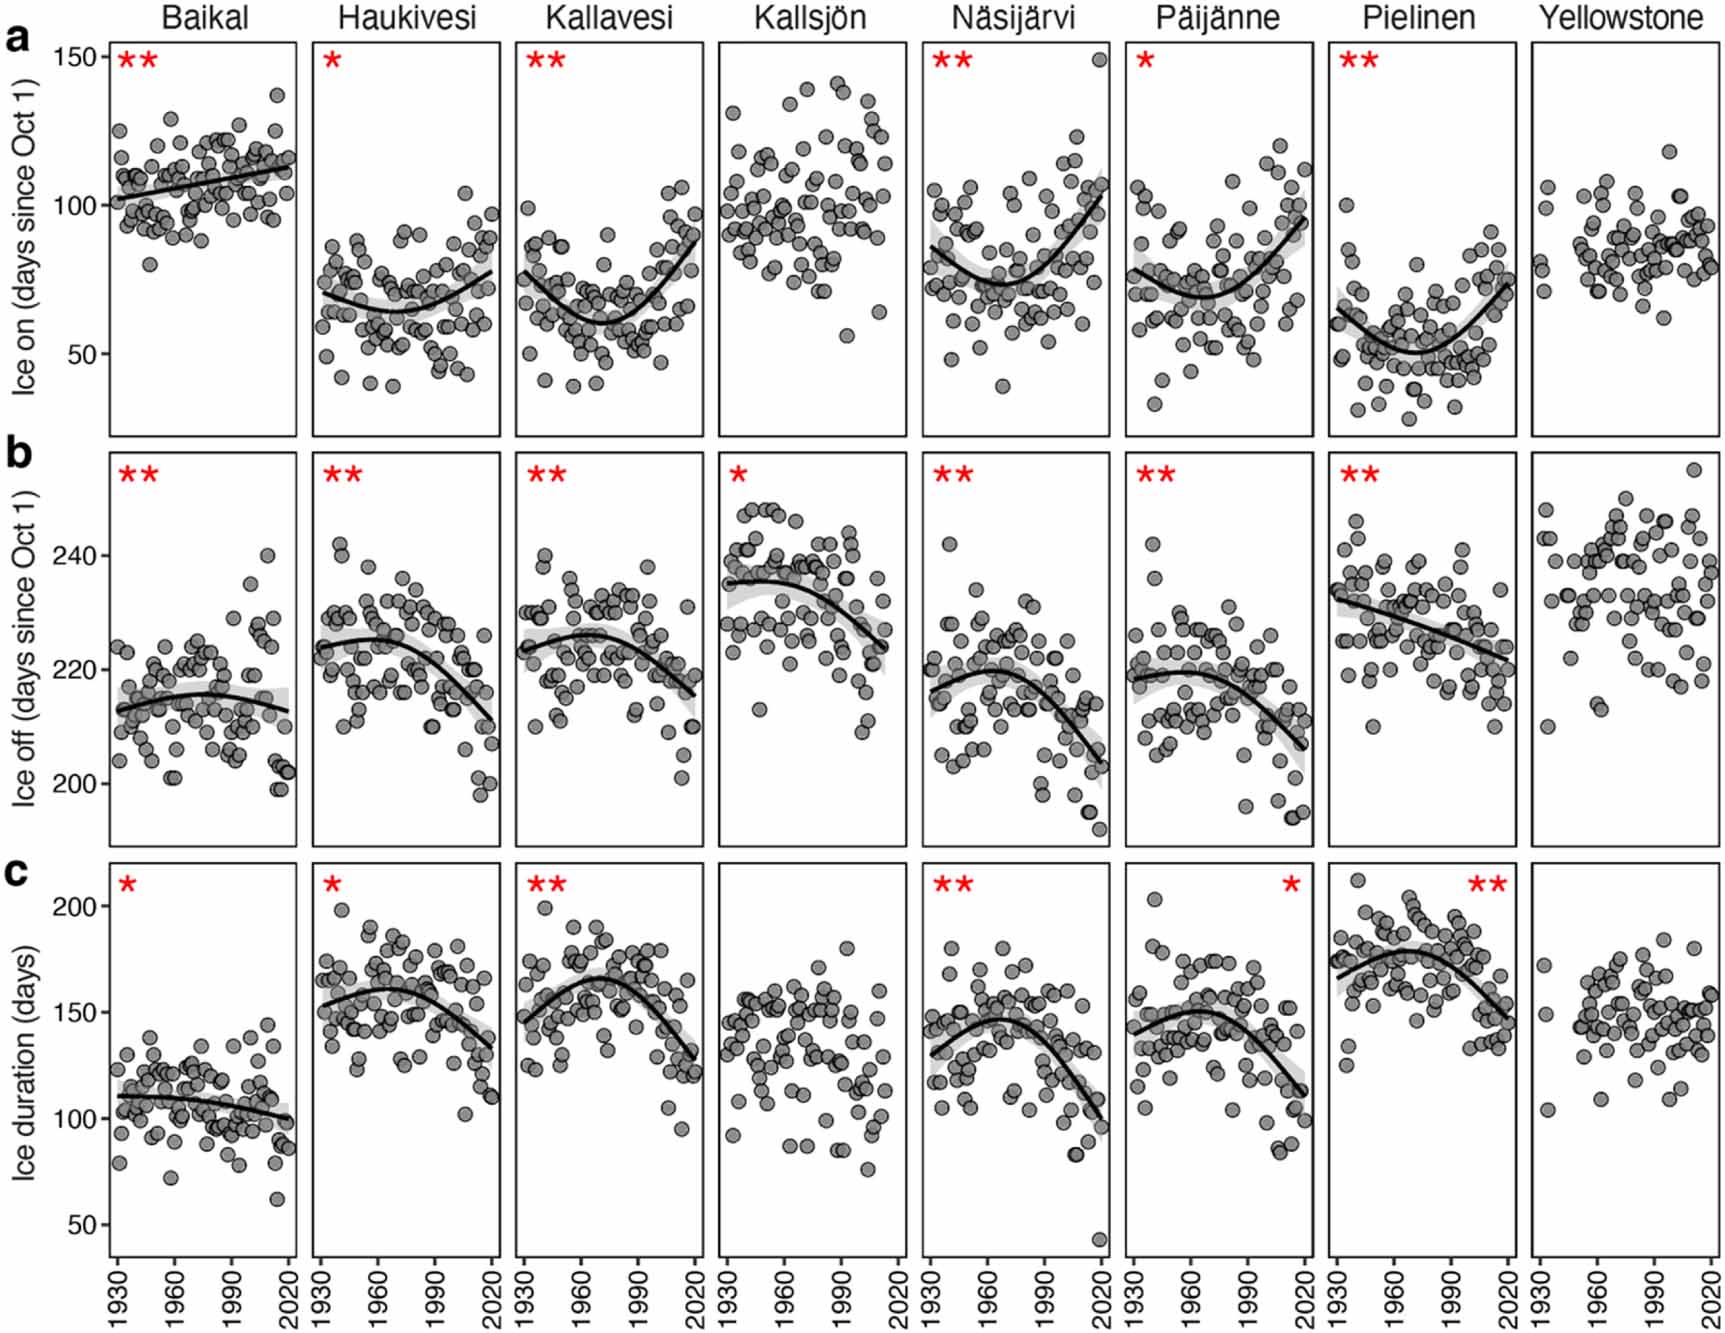
Our Yellowstone Lake data set included 74 and 84 years of data for ice-on and ice-off, respectively, which translated to 22% and 12% missing data for each metric. For our study period, the average ice-on date for Yellowstone Lake was 27 December with the earliest ice-on occurring on 2 December and the latest on 28 January. We found no evidence for a shift in the timing of ice-on (edf = 1.2, F = 0.4, P = 0.48; figure 2(a); table S3). The average ice-off date was 24 May with the earliest break-up occurring on 29 April and the latest on 13 June. We found no evidence for a shift in the timing of ice-off (edf = 1, F = 0.1, P = 0.77; figure 2(b); table S3). The average ice duration was 147 d with a minimum of 111 and maximum of 185. Similarly, we found no evidence of changing ice duration (edf = 1.3, F = 0.8, P = 0.33; figure 2(c); table S3). For the seven comparison lakes, all seven had earlier ice-off timing (P⩽ 0.002), six comparison lakes had later ice-on (P⩽ 0.047), and six comparison lakes also exhibited decreases in the duration of ice cover (P⩽ 0.017; figure 2, table S3).
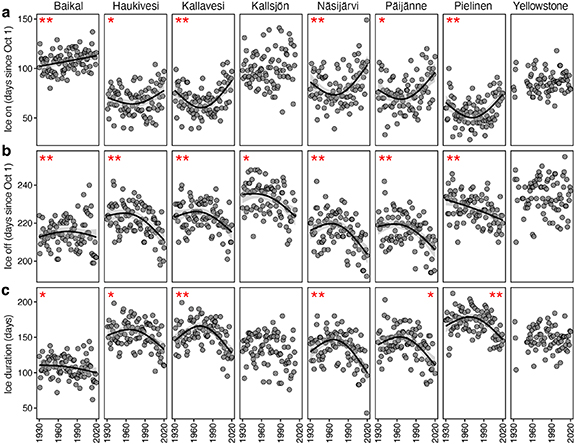
Figure 2. Raw annual data for the timing of (a) ice-on, (b) ice-off, and (c) ice duration across eight lakes, including Yellowstone Lake, from 1927–2022. Points represent the day of the water year (starting 1 October) for ice-on and ice-off (a,b) or the number of days of ice duration (c). Blue lines are fitted trend lines from GAM analysis. Statistically significant trends (P ⩽ 0.05) are indicated by the presence of trendlines and one (P ⩽ 0.05) or two asterisks (P ⩽ 0.001). Lack of trend lines indicate a lack of statistical significance at P < 0.05. There were no significant trends for Yellowstone Lake. Physical characteristic for each lake are provided in table S1. Full statistical results are provided in table S3.
Download figure:
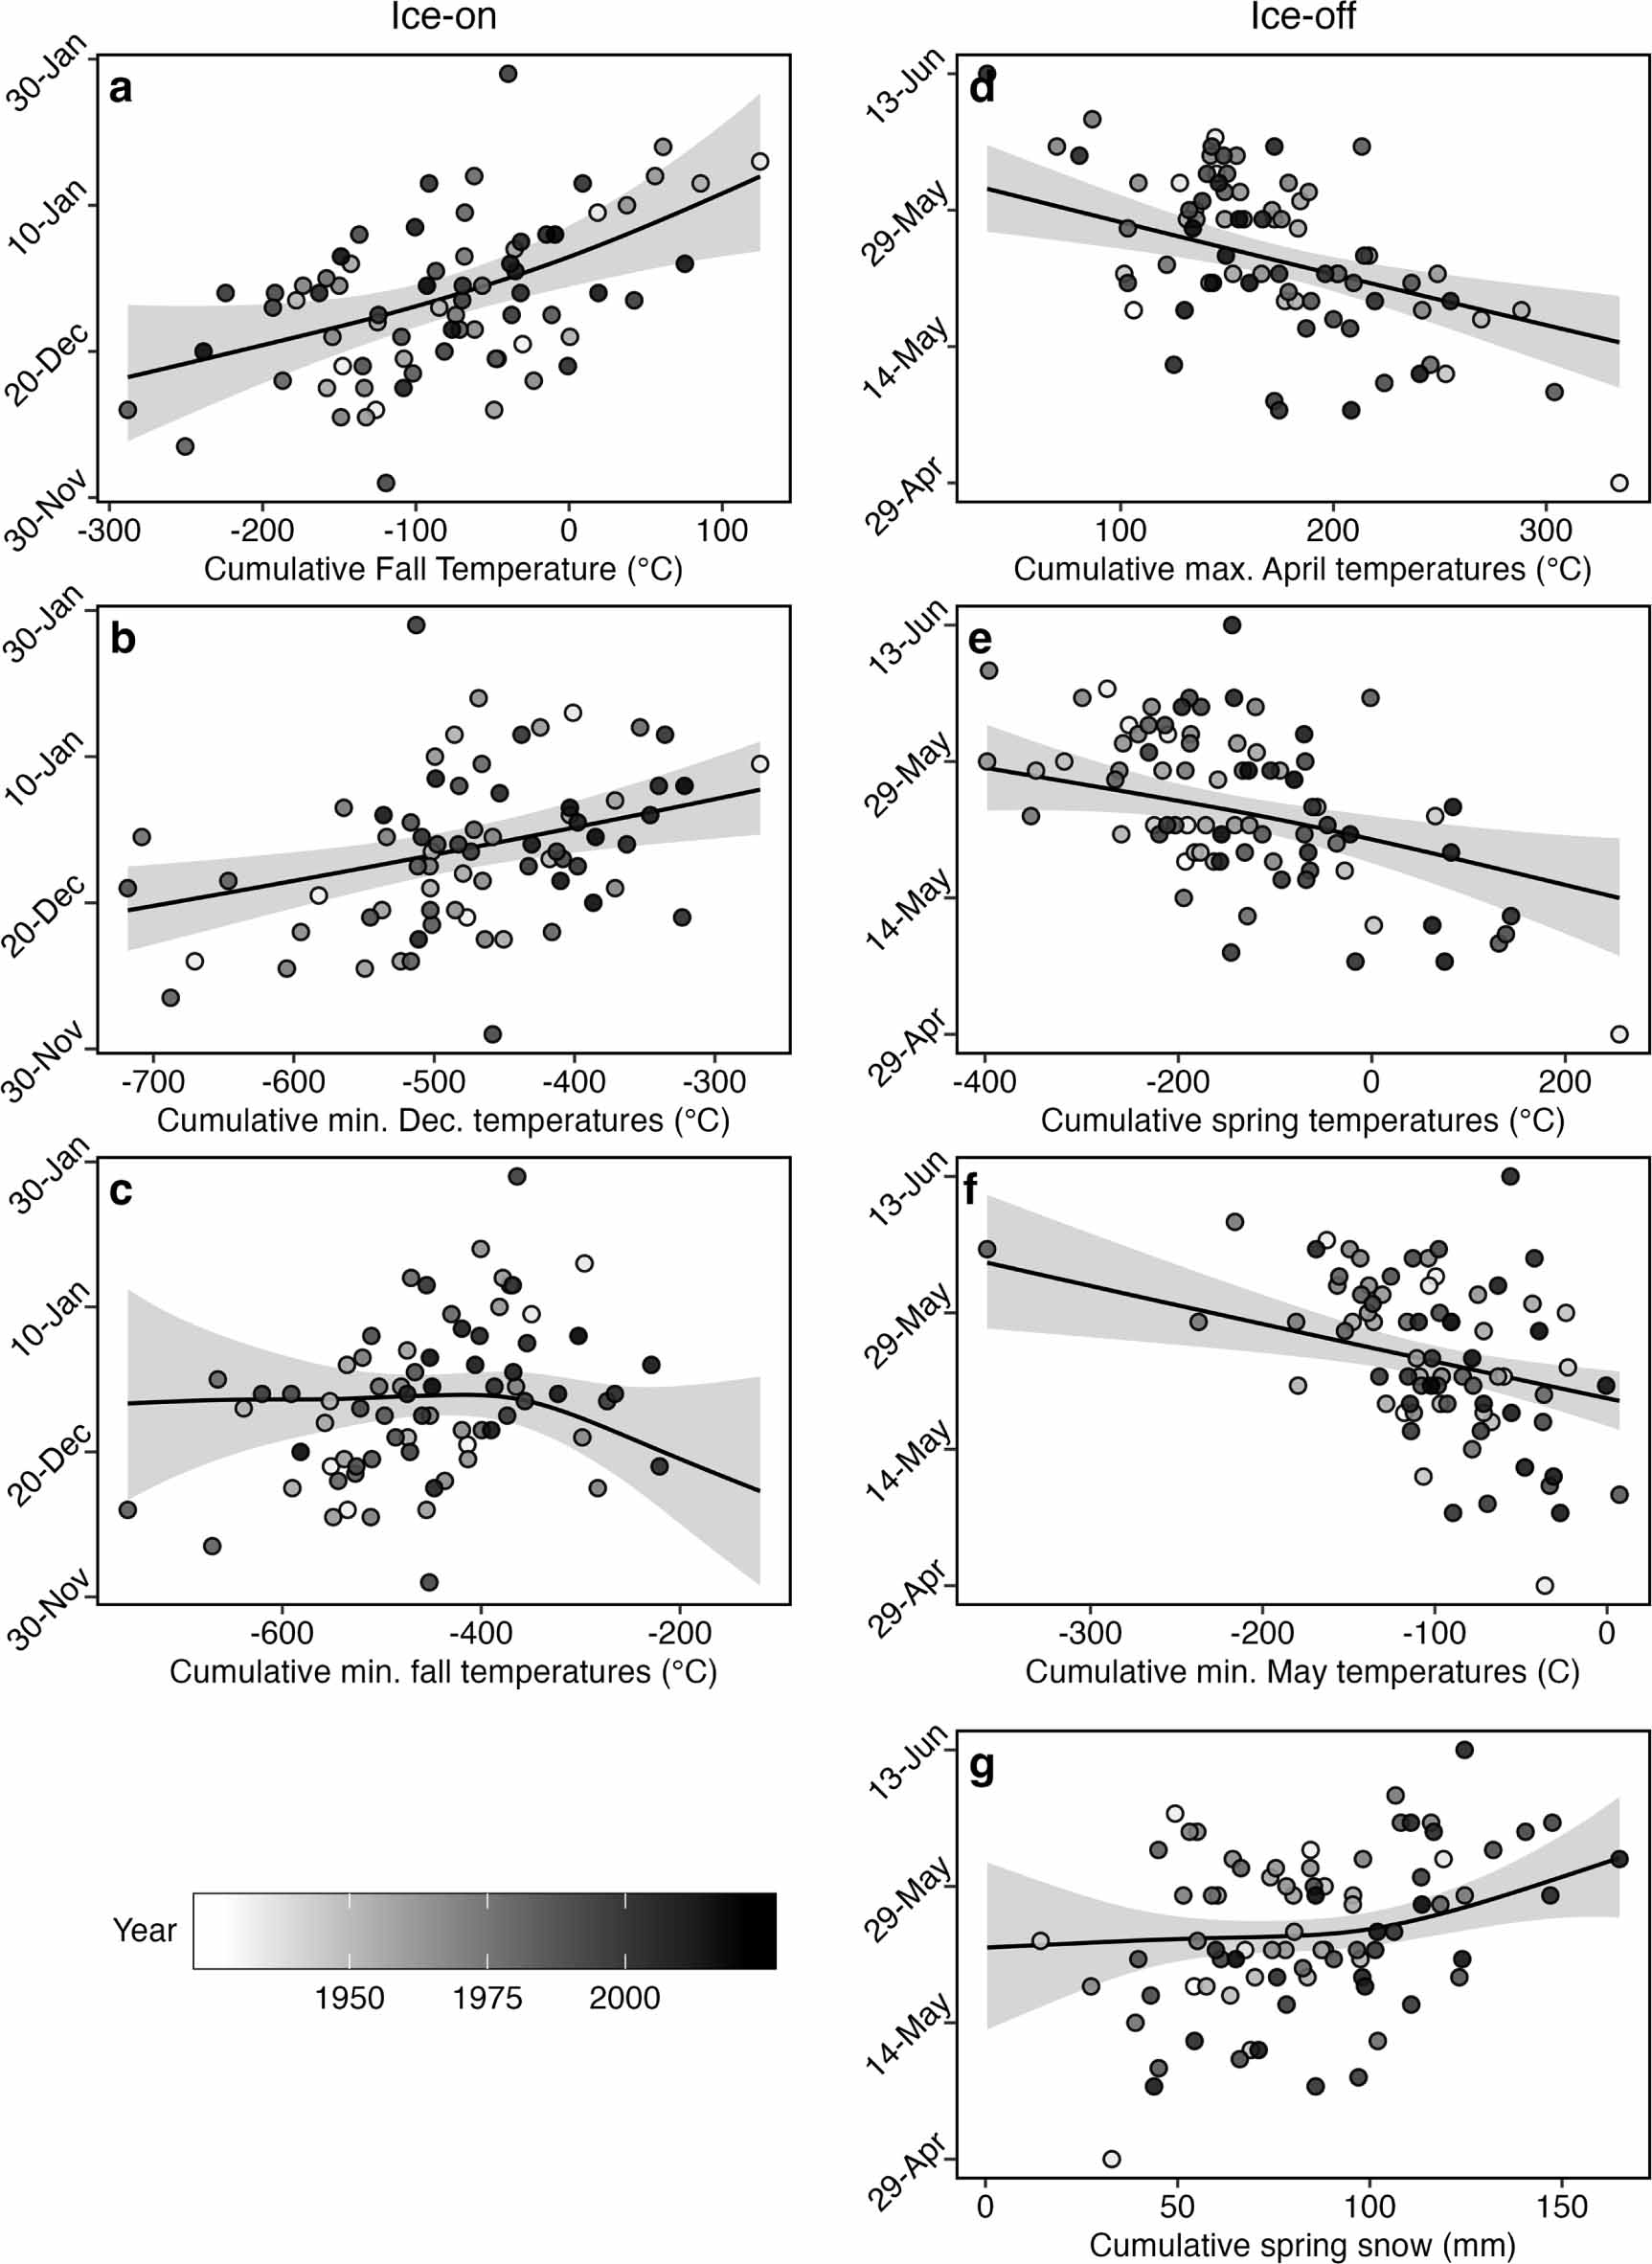
Standard image High-resolution imageThe best-fit model for ice-on included cumulative fall mean air temperatures, cumulative minimum December air temperatures, and cumulative minimum fall air temperatures (deviance explained = 40.0%; figures 3(a)–(c)). Generally, later ice formation was associated with warmer fall (Oct–Nov) and December air temperatures. Ice-off date was best explained by cumulative maximum April air temperatures, cumulative mean spring air temperatures, cumulative minimum May air temperatures, and cumulative spring snowfall (deviance explained = 61.7%; figures 3(d)–(g)). Ice-off was negatively correlated with cumulative maximum April air temperatures, cumulative mean spring air temperatures, and cumulative minimum May air temperatures, while later ice-off was associated years with higher cumulative spring snowfall. The best-fit model for ice duration unsurprisingly included many of the same covariates as the previous two models (table S2). Specifically, winters with longer ice duration were associated with cooler cumulative fall and spring air temperatures and colder cumulative minimum December air temperatures (deviance explained = 44.8%; table S2).
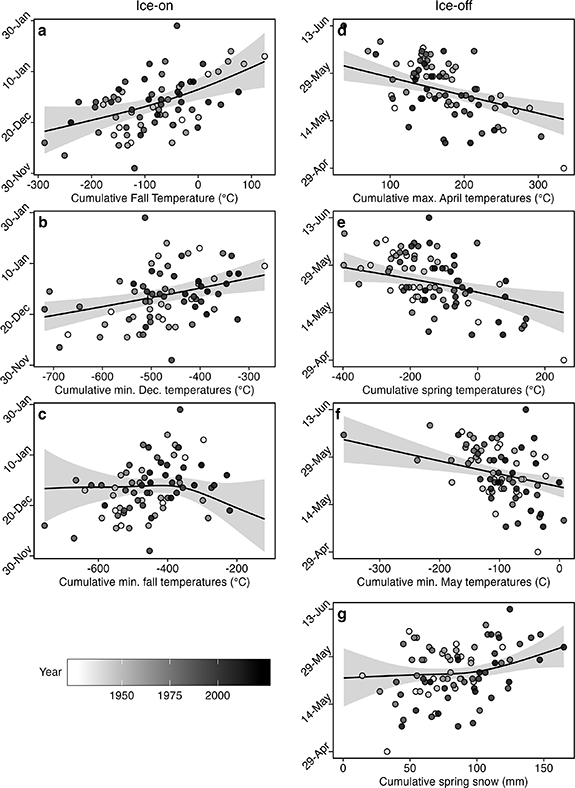
Figure 3. General Additive Model (GAM) results for the date of (a)–(c) ice-on and (d)–(f) ice-off at Yellowstone Lake. Date of ice-on was best explained by (a) cumulative fall air temperatures, (b) cumulative minimum December air temperatures, and (c) cumulative minimum fall air temperatures (total deviance explained = 40.0%). Ice-off date was best explained by (d) cumulative maximum April air temperatures, (e) cumulative mean spring air temperatures, (f) cumulative minimum May air temperatures, and (g) cumulative spring snowfall (total deviance explained = 61.7%). For all panels, points represent raw data, and fitted curves represent predictions when holding all other predictors at their median value.
Download figure:
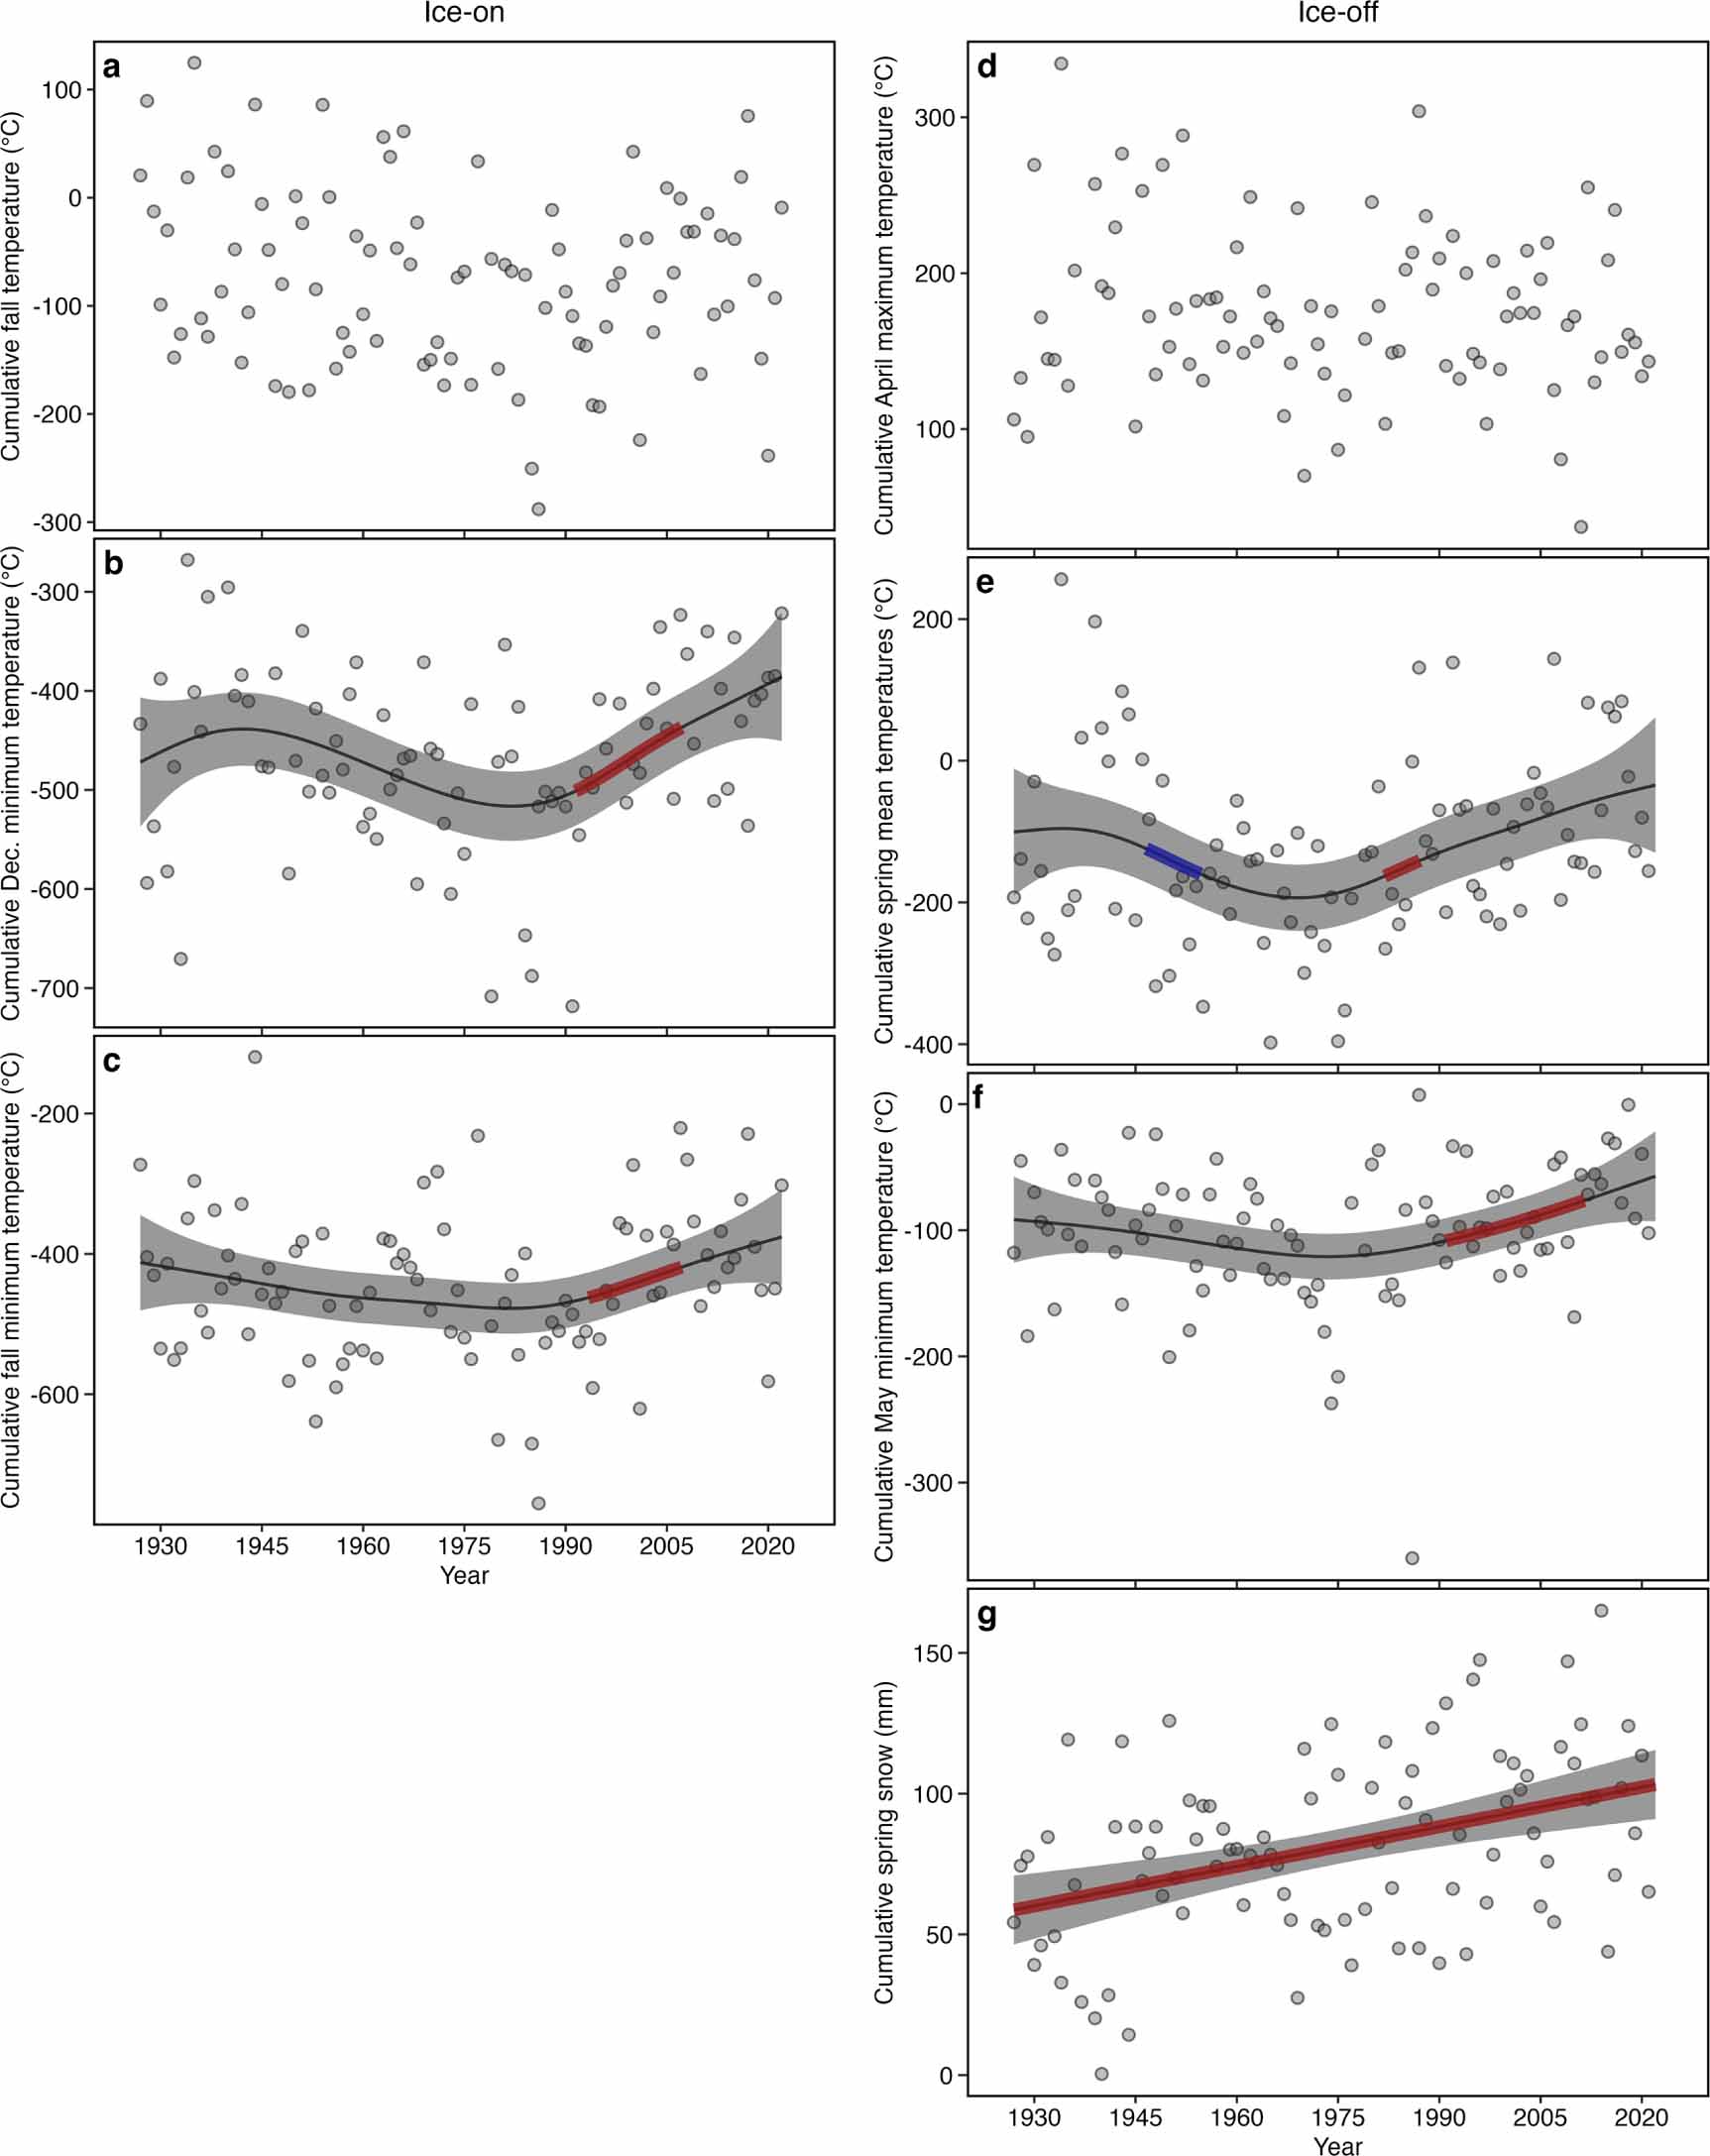
Standard image High-resolution imageMany of the top predictors of ice phenology show evidence of change over the period of record, although the strength and direction of those trends varied, and not all trends were linear (figure 4). Indeed, cumulative minimum December air temperatures have increased slightly since the mid-20th century (edf = 2.985, P = 0.009; figure 4(b)), with an acceleration from ∼1991-2012. Similarly, warming trends in cumulative minimum fall air temperatures also accelerated from ∼1993–2007 (edf = 2.77, P = 0.07; figure 4(c)). Cumulative fall mean air temperature shows a modestly increasing trend, with no evidence of acceleration since the 1930s (edf = 2.2, P = 0.07; figure 4(a)). Cumulative spring mean air temperature has been increasing since the late 20th century with an acceleration between ∼1980–2008 (edf = 2.431, P =0.004, figure 4(e)). Cumulative minimum May air temperatures are also warming modestly (edf = 2.748, P= 0.03, figure 4(f)) with an acceleration from ∼1994–2009. Finally, we observed pronounced changes in spring snowfall with linear increases over the entire record in cumulative snow (edf = 1.0, P < 0.001; figure 4(g)). For transparency, trends for all predictors that were assessed are included in the supporting information and organized by focal time period: annual (figure S1), winter (figure S2), spring (figure S3), summer (figure S4), and fall (figure S5).
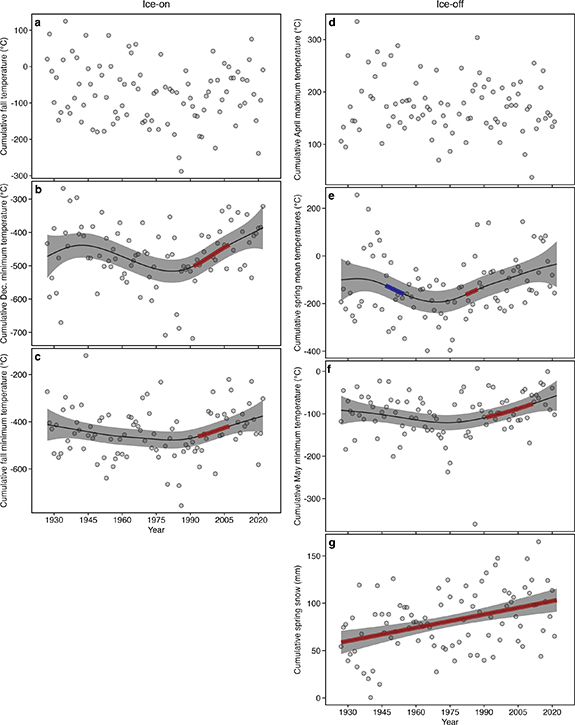
Figure 4. Time series of the top predictors of the date of (a)–(c) ice-on and (d)–(f) ice-off. Grey points are raw data and lines are fitted trends from generalized additive models (GAMs). Shading around trend-lines represents 95% confidence intervals. Red or blue lines indicate periods of a significant increase or decrease in the trend, respectively, as indicated by the first derivative of the GAMs. Panels without fitted trends (i.e. (a), (b)) showed no statistically significant change over time.
Download figure:
Standard image High-resolution image4. Discussion
Globally, most lakes are experiencing shifts in ice phenology due to climate change (Magnuson et al 2000, Sharma et al 2019). Exceptions to this trend are interesting as they can reveal factors that promote stability in lake ecosystems against climate-induced shifts in ecosystem functioning. Here, using a 96 year record, we show that Yellowstone Lake, an unusually largely, high-elevation lake—has been remarkably resistant to changes in ice phenology despite steady warming in the region. Shifts in local precipitation, especially increases in fall and spring snow, appear to be buffering the lake’s ice phenology against warming temperatures. This buffering capacity of snow likely stems from simple thermodynamics; a thicker layer of ice and snow cover takes more energy to melt so quicker accumulation (fall snow increase) and maintenance/addition (spring snow increase) can buffer ice cover against the faster melting that accompanies warming air temperatures. The unchanging ice phenology of Yellowstone Lake stands in stark contrast to similar lakes in the Northern Hemisphere (figure 2). Of these, Kallsjön stands out as the comparison lake that has experienced the least change in ice phenology over the study and thus is most similar to Yellowstone Lake (table S1). This may be because Kallsjön is the highest of the comparison lakes at 386 m and thus, like Yellowstone Lake, it may also be experiencing a slower transition to a rain-dominated precipitation regime and/or buffering by increased snowfall. We are unfortunately unable to better understand the influence of elevation by making direct comparisons between Yellowstone Lake and other large, cold lakes in the western United States because those lakes (e.g. Crater Lake, Flathead Lake, Lake Tahoe) do not freeze in winter due to a combination of their size, depth, and local conditions.
The lack of long-term change in ice phenology at Yellowstone Lake was unexpected given regional warming. Since 1950, annual temperatures have increased by 1 °C throughout the GYE (Hostetler et al 2021). These changes are particularly pronounced at the high elevation (above 2000 m) of Yellowstone Lake where air temperatures increased by 1.4 °C in less than 40 years (1980–2018; Hostetler et al 2021). Using local weather data, we found some evidence for increased summer, fall, and spring temperatures, primarily in the last three decades. Given the key role of air temperatures in driving ice formation and break-up (Kirillin et al 2012), it is noteworthy that we did not find evidence for corresponding shifts in ice phenology. This is likely a result of how precipitation regimes are concurrently changing at Yellowstone Lake.
Snow cover can delay lake ice melting and increase ice thickness via several mechanisms (Brown and Duguay 2010). Snow insulates the lake ice from warming temperatures in spring due to its lower thermal conductivity relative to ice and it can facilitate formation of snow-ice, which enhances ice thickness (Duguay et al 2003). Snow cover can also slow ice formation and reduce ice thickness in fall due to its insulating effects, but our analysis found that snowfall is increasing particularly in the spring, during ice break up. As a result, we suspect the net effect of changing snowfall over the time series in our analysis is that it increases ice thickness in spring and delays onset of ice decay. Snow also increases albedo directly and may minimize the accumulation of sediment on the ice surface, which would otherwise decrease albedo. These effects can reduce solar radiation from reaching the ice surface in spring, further delaying ice break up (Brown and Duguay 2010). Indeed, cumulative spring snow has nearly doubled over the last century at Yellowstone Lake (figure 4(d)). In general, precipitation has increased in spring and fall in the region. Ice-off timing of other high elevation lakes is strongly correlated with spring snowfall (e.g. Preston et al 2016, Caldwell et al 2021) and increased snowfall has been suggested as a primary cause in other lakes where ice phenology is not shifting with warming temperatures (e.g. Nõges and Nõges 2014). Thus, our results further emphasize the importance of considering interactions between air temperature and precipitation patterns in predicting changes in ice phenology.
The amount of deviance explained by our models—40.0% and 61.7% for ice-on and ice-off, respectively—is modest but a lack of data is likely limiting higher values. Indeed, models containing other key variables—e.g. wind or discharge—may help to explain more of the variation we observed. And, while those data do exist to some degree, they do not come close to spanning the ice phenology record. For example, U.S. Geological Survey discharge data from the Yellowstone Lake outlet only goes back to the 1990s. Modeling ice phenology at Yellowstone Lake may be further complicated by geothermal activity. The floor of Yellowstone Lake is well-known for its geothermal features (Anderson and Harmon 2002, Morgan et al 2007, 2022) but the degree to which they influence ice phenology and how that influence may have changed over the last century is unknown. For our comparison lakes, to our knowledge, geothermal activity has only been documented in some areas of Lake Baikal (Shanks III & Callender 1992).
Our results, paired with recent analyses of climate projections, suggest a ‘tipping point’ may be coming to Yellowstone Lake when ice phenology abruptly. This tipping point would likely stem from the ongoing shift from snow- to rain-dominated precipitation regimes in the fall and spring. Indeed, while spring cumulative rainfall was not an explanatory variable in our models, it is weakly negatively correlated with ice-off dates and shows an increasing and accelerating trend in the latter half of the 20th century (figure S3(c)). Future temperature projections under an RCP4.5 scenario across all seasons suggest an increase of around 2.8 °C by 2061–2080 for the Greater Yellowstone region (Hostetler et al 2021). More concerning are projections for the dominant precipitation regime across elevations in the Upper Yellowstone watershed. At present, the elevation band that contains Yellowstone Lake (1800–2400 m) sits between ‘snow-dominant’ and ‘rain-snow mix.’ By 2040, this is projected to shift entirely to ‘rain-snow mix’ while trending towards ‘rain-dominated’ (Hostetler et al 2021).
If Yellowstone Lake experiences an abrupt shift in ice phenology, there may be wide-ranging consequences for nutrient cycling, lake productivity, fisheries, and recreation. Abrupt shifts in lake ecosystem functioning have increased in recent decades (Huang et al 2022). Early warning signs of abrupt shifts in ecosystem functioning—e.g. increases in the variance of ecosystem properties–are useful to monitor (Ratajczak et al 2018). Yellowstone Lake, although relatively isolated, has a history of nonnative species introductions (e.g. lake trout) and may experience future change due to atmospheric nitrogen deposition (Nanus et al 2017, Koel et al 2019). Understanding how multiple drivers interact will be critical in predicting future shifts in lake functioning and provisioning of ecosystem services for Yellowstone Lake and other large lakes globally.
Acknowledgments
We thank Jerry Bateson, Jerry Bateson Jr, Pat Parrotti, Dan Reinhart, and the staff of Lake Village and Bridge Bay for their efforts to record ice phenology on Yellowstone Lake and Richard Anderson-Sprecher for time series suggestions. IAO was supported by NSF Award #DEB-2306895. S H was supported by Agriculture and Food Research Initiative Competitive Grant #2021-69012-35916 from the USDA National Institute of Food and Agriculture.
Data availability statements
All data sets and code used for this study are openly available on GitHub: https://github.com/bellaoleksy/NC_YSL_Ice_Phenology. The raw data are also openly available on Zenodo (https://doi.org/10.5281/zenodo.10909274) and as a data publication (Oleksy et al 2024).
Author contributions
L M T, G G, K C, A H, and P F organized the data set and performed exploratory analyses. I A O and J P F P led the modeling with input from L M T, D L P, and S H. I A O, J P F P, G G, and S H made the figures with input from L M T and D L P. I A O, J P F P, D L P, and S H wrote the manuscript with input from L M T and all authors. All authors read and approved the article for submission.