

Abstract
Air pollution is perceived through sensory stimuli and interpreted by our brain. Perception is highly subjective and varies from person to person. As many direct and indirect factors influence air pollution perception, it is difficult to unearth the underlying mechanisms. Many studies have tried to understand the mechanisms and relations affecting perception, and it is important to evaluate those different approaches. We systematically reviewed 104 studies on air pollution perception, following the preferred reporting items for systematic reviews and meta-analyses guidelines. There is a difference between the public's subjective perception and objective air quality measurements. This discrepancy has been found to occur due to varied socio-economic characteristics, knowledge, emotions, etc. The advent of social media and the internet has had a significant effect on risk perception. All these influencing factors create differences between the public's perception and the scientific community/policymakers. This gap can be fixed by tailoring science-backed information for better communication. Based on past studies, we highlight the need for tailored data dissemination, integration of big data for urban management, development of robust frameworks to incorporate perception and use of a perception index for better communication.
Export citation and abstract BibTeX RIS

Original content from this work may be used under the terms of the Creative Commons Attribution 4.0 license. Any further distribution of this work must maintain attribution to the author(s) and the title of the work, journal citation and DOI.
1. Introduction
Air pollution is a complex and serious problem with high spatio-temporal variation in many developing countries. It has been found to be the 4th leading risk factor in premature death (Burnett et al 2018, Health Effects Institute 2020). Various respiratory diseases and increased hospital admissions have also been attributed to air pollution worldwide (Chang et al 2015, Cohen et al 2017).
The public becomes aware of air pollution through sensory stimuli and interprets the air quality based on their perception. It has been found that the objective air quality level measured by the instruments differs from people's subjective air quality (how people perceive the air quality) (Brody et al 2004, Schmitz et al 2018, Boso et al 2022). This difference occurs due to people's perception, which is influenced by many factors like socio-demography, economic disposition, education, etc (Cisneros et al 2017, Schmitz et al 2018, Balžekienė et al 2022, Boso et al 2022). Air pollution perception is highly subjective and varies from person to person due to their diverse experiences, beliefs, values and knowledge (Kiss et al 2022, Kramm et al 2022).
Perception is often a neglected parameter in air quality studies and policies. This creates challenges in policy implementation and acceptance. Ensuring public participation in such cases becomes difficult, resulting in lost time and resources. Understanding people's perception of air quality can help develop better air quality management policies, as perception affects the acceptance and participation of the public in air quality management strategies (Kim 2021). As many direct and indirect factors influence air pollution perception, it is difficult to design an experiment considering all the influencing parameters. We wanted to understand the factors studied in the past literature to help design effective experiments and untangle the complex relationship between air pollution and perception.
There have been interesting studies on perception starting from 1968 (Crowe 1968), and subsequently, many new methods have been developed to understand how people perceive air quality, what air quality means to them, and what affects perception. These studies must be compiled and consolidated to get an overview of the recent developments and state-of-the-art. Malm et al (2019) summarised the studies on visibility preference studies, where a group of people were shown pictures of sceneries/vistas and asked to rank them based on visual quality. Systematic reviews on risk perception were conducted by Cori et al (2020) and Noël et al (2021). Even though few reviews exist on perception, they are limited to a certain qualitative or quantitative method; they focus on particular components of air pollution perception, namely, visibility perception and risk perception. Many more components of perception studies need to be considered for a comprehensive understanding.
In this review, we consider a variety of sub-topics of air pollution perception by including more articles and diverse methods used to understand perception. We try to classify different methods and consolidate them according to methodology, analysis techniques, advantages and disadvantages, which will help choose suitable parameters and methods.
2. Method
The literature review was conducted to understand the different methods used to find people's air pollution perceptions. The preferred reporting items for systematic reviews and meta-analyses guidelines (Moher et al 2009) were followed for this systematic review. It is an evidence-based set of items, including a flow diagram and a 27-item checklist for standardized reporting in systematic reviews and meta-analyses. The checklist covers various aspects of a systematic review and meta-analysis, such as the title, abstract, methods, results, discussion, and funding. In addition to this, it provides an extended checklist that offers detailed recommendations for reporting each item. Figure 1 shows the flow diagram indicating the selection process of the reviewed papers. Scopus and PubMed databases were searched and screened for relevant documents. Initially, 35 journal papers of interest were selected, and their keywords were analyzed. The most commonly used keywords were used to frame the search criteria. Perception, air pollution, air quality, emotion, sentiment, GIS, social media, search, complaints, and environmental pollution were the most commonly used keywords. Based on the keywords, the following search criterion was used to refine search output from the databases: 'pollution' AND 'perception' AND ('gis' OR 'search' OR 'sentiment' OR 'emotion' OR 'social media' OR 'twitter' OR 'risk' or 'health' OR 'survey') AND NOT ('cohort' OR 'cross' OR 'section'). Many health science papers on cohort and cross-section studies came up in the search. Since this review focused only on air pollution perception, the literature related to cohort and cross-section studies was removed.
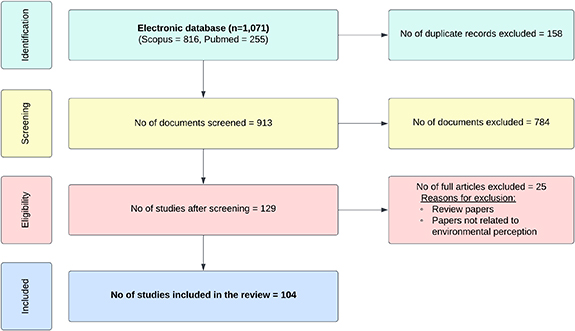
Figure 1. Systematic review of air pollution perception following PRISMA guidelines.
Download figure:
Standard image High-resolution imageAir pollution is an integral part of environmental pollution perception, and noise & odour pollution is considered a part of the air pollution problem. So, the studies focusing on environmental perception, noise and odour perception were also considered for this review, in addition to air pollution perception studies. Using the search criterion, 1071 documents were retrieved, and 158 duplicates were removed. After screening and excluding review papers and papers unrelated to environmental perception, 104 articles were included in this systematic review. The methodology and analysis techniques employed in the literature were studied for the review.
3. Results
In this study, we have tried to classify the air quality perception studies based on methodology and variables (indicators) used to understand perception. The perception studies can be broadly classified into three main categories: visual perception studies, air quality perception studies and health risk perception studies (figure 2). Among them, air quality perception studies can be further divided into perception vs. indicator studies, precautionary measures studies, sentiment analysis, complaint analysis and search analysis. The last three can be grouped as big data analysis, as they use data available on the internet. The prevalence of these different categories over the years and their global status can be found in the figure 3. The past studies have been used for different applications like air quality analysis, studying air pollution perception, risk analysis, improving communication and finding the factors that affect perception.

Figure 2. Classification of perception studies.
Download figure:
Standard image High-resolution image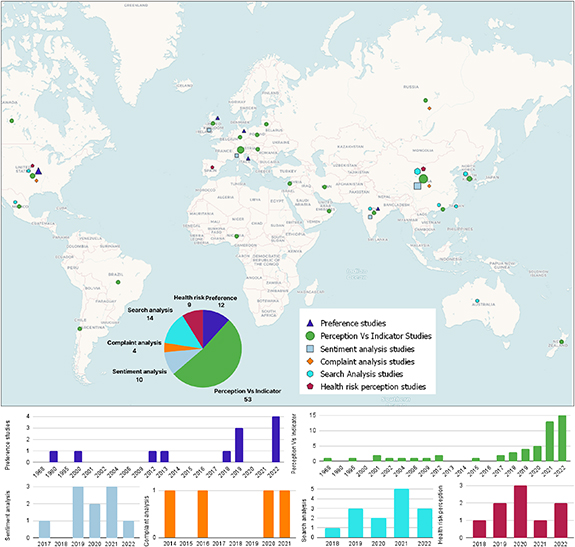
Figure 3. Global status of perception studies.
Download figure:
Standard image High-resolution image
3.1. Preference studies
Preference studies were one of the first methods to be used for understanding air quality perception, which started in 1980 (Malm et al 1980). Preference studies are qualitative, and they usually ask the participants to rank a particular vista/ scenery or a picture of a scenery or an environment (Malm et al 1980, Fajardo et al 2013, Masullo et al 2022). The country-wise details of these studies and their methodology are listed in table 1. These studies often examine the visual cues affecting people's perception. Once the participants rank the pictures, they will be compared with the actual objective measurement (haze level (Fajardo et al 2013), visibility (Malm et al 2019), air pollution levels (Morris and Smart 2012), etc) to understand visual perception of the environment. Conventionally, pictures of scenery with different environmental/visibility conditions, like cloudy, sunny, etc have been used to understand the factors influencing perception. Other visibility metrics, like atmospheric extinction, Sobel index, contrast, and apparent sky-image contrast of the more distant landscape feature, have been used to study the acceptability of the scene. Only a few studies were conducted using this method owing to the small sample size and difficulty of the execution. However, in recent times, additional data from questionnaires and air quality measurement devices have been used to supplement the preference studies (Marquart et al 2021).
Table 1. Overview of preference studies.
| Study | Country | No of interviews | Interview | Data | Analysis |
|---|---|---|---|---|---|
| Malm et al (1980) | USA | Photos/slides | Visibility | 1–10 pt scale | |
| Malm et al (2019) | USA | Photo | Extinction Coeff. | ||
| Stafford and Brain (2022) | USA | 19 | Interview | ||
| Masullo et al (2022) | Italy | 36 | VR model | LUX | 9 pt Likert scale |
| Marquart et al (2021) | India | 15 | Ride along | A.Q data (PM) | Speech analysis |
| Marquart et al (2022) | Germany | 28 | Ride along | A.Q data (PM, Noise) | Speech analysis |
3.1.1. Insights from preference studies
Malm et al (2019) compared different visibility metrics and found that extinction coefficient and apparent contrast correlated well with acceptability. They also found that the distance of objects in the image also affects the acceptability of the scenery. A small change in extinction coefficient can hide a distant vista but is unnoticeable at a short distance (like in a room). Fine particles (0.1–1  ) were more efficient at scattering light than molecules or coarse particles. An increase in colour or presence of clouds causes participants to perceive air quality better than its original level. People perceive the extremes of air quality better (good and worst) but are confused with intermediate levels of visibility and air pollution.
3.1.2. Advantages of preference studies
Preference studies can be used to understand the relationship between human perception and environmental parameters like haze, visibility, air pollution, odour, etc. They help investigate individual judgment, satisfaction, and behaviour. Observed objective metrics like visibility, particulate matter level, etc can be used to relate perception and environmental factors. Since a trained interviewee administers them, the biases in framing questions and executing interviews can be eliminated. The biases associated with self-reporting in questionnaire-based surveys can be avoided.
3.1.3. Limitations of preference studies
One of the main limitations of this method is the difficulty in covering a large sample population. The difficulty in executing the study and the high resource requirement makes it less preferable.
Smith (2013) pointed out that preference studies have framing bias, and people gave ratings based on the availability of both clean and haze images. They found the visual air quality rating changed when the range of visual quality, i.e. the haze intensity between clean and hazy images, in the photos changed. The framing of questions was also found to affect the ratings.
They suggested the following steps to reduce these biases: (I) participants should be instructed that all photos/slides may be acceptable or not, (ii) the selection of images must include best air quality levels to worst air quality levels, and (iii) selected images should have a similar angle of the Sun but varied meteorology.
Ride-along studies, where the interviewer travels along with the participants during their day-to-day commute, have been conducted by Marquart et al (2021) to understand the participant's decisions and perceptions based on their conversations. They found that people do not always assess the negative impacts of air pollution but feel exposed to it. The presence of vegetation, water bodies or urban aesthetics made the participants feel pleasant even when exposed to high pollution. Exposure information can empower people to take preventive actions, but it can also cause resignation. This problem must be studied further to find the relationship between information and subsequent actions. Marquart et al (2022) combined ride-along interviews (subjective) and air quality sensor data (objective) to understand the commuter's exposure and the effect of perception on wellbeing. The use of both subjective and objective data in these studies helps understand perception and the reasons for certain decisions made by the participants. Such studies can help address the limitations of preference studies.
3.1.4. Use cases of preference studies
Preference studies have been used to (i) understand visual perception, (ii) assess the need for visual standards, (iii) combine quantitative and qualitative measurements and (iv) understand the emotional response to air pollution.
3.2. Perception vs Indicator studies
Perception vs Indicator studies were the first method to be used to understand perception, starting in 1968 (Crowe 1968). The ease of implementation, ability to cover a large sample population and fewer resource requirements have made this a widely used method in perception studies. Since 2021, there has been a threefold increase in the number of perception studies annually (figure 3). These studies use various indicators to understand the air pollution perception. Usually, the data is collected through a questionnaire-based online or in-person survey. These questionnaire surveys are designed to collect information regarding the selected indicators. The indicators, demography, perception, knowledge (Kramm et al 2022), air quality data (Brody et al 2004, Chiarini et al 2020), media sources (Hong et al 2022), behaviour (Tan and Xu 2019), attitude (Schmitz et al 2018), etc and the methodology used in the past studies are detailed in table 2. Many different statistical methods have been used for data analysis, from basic descriptive statistics (Szopinska et al 2022a) to advanced Structural equation Modelling (Yu et al 2021, Li and Folmer 2022). Linear (Huang et al 2017) and logistic regression (Hong et al 2022) are the most common statistical techniques used in these studies. Initially, the studies were looking to find the effect of basic indicators like socio-demography, economy, air quality data, etc on perception (Brody et al 2004, Cisneros et al 2017). After the spread of the internet and social media, more studies are looking at the effect of advanced indicators like internet usage (Chukwu et al 2022), social media (Kim et al 2020), behaviour (Cao and Chen 2021), attitude (Schmitz et al 2018), etc on perception. The pathways and mediation effects of these indicators have changed, and the studies are trying to unearth the complex relationships between these variables.
Table 2. Overview of Perception vs. Indicator studies.
| Indicators used | |||||||
|---|---|---|---|---|---|---|---|
| Study | Country | No of samples | Demography | Perception | Knowledge | Other indicators | Analysis methods |
| Brody et al (2004) | USA | 870 | X | X | X | Air Quality (A.Q), Media, Political ideology | Correlation, OLS |
| Cisneros et al (2017) | USA | 24 | X | X | X | MLR | |
| Clougherty et al (2022) | USA | X | X | Housing, Job security, Violence | Odds ratio | ||
| Chiarini et al (2020) | Europe | X | X | A.Q, Psychology | Bivariate Probit reg | ||
| Schmitz et al (2018) | Germany | 3553 | X | X | X | Behaviour, Attitude | OLR, χ2 test |
| Kramm et al (2022) | Germany | 1027 | X | X | X | Env. Awareness | OLS, Hierarchical regression |
| Szopinska et al (2022a) | Poland | 108 | X | X | Descriptive, ADMS | ||
| Balžekienė et al (2022) | Lithuania | 1900 | X | X | Risk, place attachment | Geospatial analysis, LR | |
| Kiss et al (2022) | Hungary | 512 | X | X | X | A.Q, Climate change | Logistic reg, χ2 test |
| Macêdo Coelho et al (2022) | Brazil | 154 | X | X | Intensity | Avg. ranking model, statistical test | |
| Boso et al (2022) | Chile | 586 | X | X | LR | ||
| Boso et al (2022) | Chile | 298 | X | X | Economy | MLR, ANOVA | |
| Sanskriti Menon (2019) | India | 500 | X | X | X | Descriptive | |
| Barg et al (2022) | Russia | 1324 | X | X | Risk matrix | ||
| Chukwu et al (2022) | Nigeria | 262 | X | X | Sources, Control measures, Responsibility | Kruskal–Wallis, Hochberg's post hoc test | |
| Kim (2021) | South Korea | 510 | X | X | Policy, Social media dependency | Hierarchical regression | |
| Yu et al (2021) | South Korea | 285 | X | X | Trust, Desire | CFA, SEM | |
| Ho et al (2021) | Hong Kong | 551 | X | X | X | Preparedness | 2-stage analysis |
| Huang et al (2017) | China | 1284 | X | X | Acceptance, Daily activity | Linear, Logistic reg, CFA | |
| Tan and Xu (2019) | China | 979 (In-person) | X | X | X | Env. awareness, Behaviour | Cluster, ANOVA, MLR |
| Liu et al (2021) | China | 500 | X | X | Weighted function | ||
| Cao and Chen (2021) | China | 2010 | X | X | Behaviour, Authority | LR, Hierarchical MLR, Path model | |
| Zhang et al (2021) | China | X | X | Correlation | |||
| Li et al (2022) | China | 1329 | X | X | Mental health, Exercise | Correlation, SEM, NLP | |
| Hong et al (2022) | China | 3694 | X | X | A.Q, Media | Logistic reg | |
| Liu (2022) | China | 105 | X | X | Policy | Descriptive stats | |
| Fang et al (2022) | China | 450 | X | X | X | Benefit perception, Acceptance | EFA, PCA, SEM |
a Note: OLS—Ordinary Least Squares; MLR- Multivariate Linear Regression; LR—Linear Regression; CFA—Confirmatory Factor Analysis; SEM—Structural equation Modelling; NLP—Natural Language Processing; PCA—Principal Component Analysis
3.2.1. Insights from indicator studies
Objective air quality measurements do not influence people's perception (Brody et al 2004, Schmitz et al 2018, Boso et al 2022). This is one of the main reasons for studying people's perceptions of air pollution. This discrepancy makes data dissemination, control policies and management strategies ineffective. Air pollution exposure negatively affects perception, i.e. people exposed to air pollution perceived air quality as poor (Cisneros et al 2017, Huang et al 2017).
Brody et al (2004) pointed to the Halo effect, wherein people rated the air quality in their area lower than actual. Barg et al (2022) also found a similar effect, where people perceived risk to others as higher than to themselves. They call it the 'Illusion of invulnerability'. Urban people reported the air quality to be worse than actual more often than rural people (Brody et al 2004). Urban people are well aware of the risks but constantly underestimate the risk (Balžekienė et al 2022). This has been attributed to the risk normalization due to habituation, which acts as a coping mechanism. In contrast, (Schmitz et al 2018) reported no difference in perception between urban and rural respondents. Risk normalization and the halo effect put the urban population at higher risk. The propensity to underestimate risk in their area can affect their actions, and they may become habituated to the worst environmental conditions.
Other factors like gender, education, socio-economic status and knowledge affect the perception. Most studies reported that females perceived the air quality to be poorer than males (Cisneros et al 2017, Schmitz et al 2018, Balžekienė et al 2022, Boso et al 2022). However, some studies found no difference between how genders perceived air pollution. Low levels of education and socio-economic status may reduce the ability to perceive hazards (Boso et al 2019). People with no schooling perceived the mining impacts on the environment to be very less (Macêdo Coelho et al 2022). Similarly, (Zhang et al 2021) found that higher education increased the awareness of pollution. Contrastingly, (Kramm et al 2022) argue that higher education and income develop a sense of control and trust, thereby reducing the perception of danger and risk.
Socio-economic position affects health via stress mechanisms and physical pathways (Clougherty et al 2022). At the same time, socio-cultural factors mediate the relation between actual pollution and risk perception (Boso et al 2022). Interestingly, people who noticed the economic advantages of an activity perceived the negative impacts to be less likely (Macêdo Coelho et al 2022). People with poor health rated air quality worse than actual (Schmitz et al 2018).
Only 26.5% of people made an effort to prevent air pollution exposure (Ho et al 2021). They found low environmental knowledge to be the major factor affecting preparedness. Kiss et al (2022) had similar findings, where knowledge determined the level of concern, and people with proper knowledge took effective actions to protect themselves. Fang et al (2022) found that improvement in knowledge made people overestimate the risks and underestimate the benefits of pollution control, thereby lowering their acceptance. They also found that knowledge triggered emotional judgment rather than rational judgment.
In general, people felt poorly informed on air quality (Schmitz et al 2018). They also did not know how to get air quality information (Liu 2022). This calls for effective data dissemination systems. Additionally, media coverage affects perception (Hong et al 2022), and Kim (2021) found the use of traditional media positively related to risk perception and the use of social media negatively related to risk perception. Informal networks play a vital role in perception. Hong et al (2022) say that frequent exposure to news from the inner circle (family and friends) had a higher impact than newspapers, TV or the internet. Media narrative strongly affects perception, and this causes different perceptions among the scientific community and the people (Kramm et al 2022). Fang et al (2022) emphasize the need for science-backed data dissemination to assuage people's concerns. This is supported by Boso et al (2022), where they suggest reinforcing health risk communication and interventions in urban management plans. Barg et al (2022) suggest having communication based on the risk level perceived by experts and common people, and any such communication should improve the trust in the decision-maker.
Anxiety, anger, and sadness about pollution risk are positively related to risk perception. Anxiety increased risk preventive measures, and anger induced the motivation to address the problem (Kim 2021). Cao and Chen (2021) found that the individuals perceiving high risk can become overwhelmed, whereas individuals perceiving low risk may ignore it. People in high-pollution areas perceive impact intuitively, and communication from the government should emphasize self-efficacy. Meanwhile, for people in low-pollution areas, the government should focus on building people's environmental awareness.
3.2.2. Advantages of indicator studies
This method can cover large population sizes with limited resources. The study design can be tailored by selecting a combination of indicators to establish the relationship between perception and different variables. Advanced statistical analysis like Structural equation Modelling, Factor analysis, clustering, etc can be used in this method. They can also be used to supplement preference studies to get better results.
3.2.3. Limitations of indicator studies
The most common limitation found in these studies is the sampling bias. Many studies used online questionnaires, and thus, the sampling population was skewed towards literate and economically well-off populations (Jokar et al 2020, Al-Shidi et al 2021). Since the online surveys are self-administered without supervision, there is a possibility of misinterpreting the question. Some responses may be done without actually reading the questions and may reduce the robustness of the study. Thus, it is required to have an attention check question and responses from inattentive respondents must be removed (Zhao et al 2021). Using in-person interviews is a very tedious and time-consuming process. So, very few studies have conducted face-to-face interviews with a large sample population.
3.2.4. Use cases of indicator studies
These studies have been used in the past (arranged from the most used to least used) to study the (i) effect of air pollution on perception, (ii) impact of the urban environment on perception, (iii) effect of media on perception, (iv) acceptable risk level to the public, (v) communication strategies in urban management plans, (vi) effect of gender on perception, (vii) effect of green space and mental health on perception, (viii) effect of perception on tourism, and (ix) population segmentation for data dissemination.
3.3. Precautionary measures based studies
The precautionary measures people took during different air quality scenarios were analyzed to understand their perception through a questionnaire survey. The precautionary purchases (like masks, purifiers, etc) made by people using online platforms were collected and related to the air quality levels to understand air pollution through data analysis. The past studies have used the online purchase data from JD sales data and media coverage and search data from Baidu and Weibo (Xu et al 2022). They used Bayesian Structural equation modelling to understand the mediation effects on precautionary measures. Air pollution had a significant indirect effect on proactive defence purchases, mediated through media coverage and search behaviour. Meanwhile, social media mediated the relation between air pollution and proactive avoidance behaviour. They suggest using news media and the internet to convey policies that require people to perform actively. Policies requiring passive behaviour can be conveyed through social media.
The transition from risk perception to behavioural change involves two steps, the motivational or goal-setting step and the implementation step (Schwarzer and Fleig 2014). Self-efficacy, risk perception and planning influence the adoption and protective behaviour (Zhou et al 2016). The most common protective behaviours were using masks, air purifiers and staying indoors. Usually, people opt for face masks and stay indoors when possible. While the affluent population invested in air filters (Sun et al 2017). The public, especially the vulnerable population, respond to smog alerts (Neidell 2010, Ward and Beatty 2016). Elderly reduce vigorous outdoor activities by 82% in response to air quality alerts (Ward and Beatty 2016).
Individuals receiving personalized pollution exposure information changed their behaviour to reduce the exposure. However, they took overly safe measures even when the benefits of active commute outweighed the pollution health effects (Fan et al 2021). The complex relationship between different public health policies and their effects on each other must be considered before developing a policy.
3.3.1. Advantages and limitations of precautionary measures studies
Using precautionary purchases is a good proxy for perception, as it signifies precautionary behaviour. Sometimes, people may give wrong information during self-reporting, and using purchase history as a proxy eliminates the possibility. Since it mainly uses the online purchase history, it may under-represent the population with less internet accessibility and people who physically buy in stores.
3.3.2. Use case of precautionary measures studies
These studies have been used to understand (i) people's response to air pollution, (ii) people's response to news media, and (iii) precautionary measures taken by the people.
3.4. Big data studies
The big data studies usually use a vast amount of data stored on the internet. The increased dependence on the internet and social media has created a huge amount of data, and this has been tapped by researchers since 2014 to understand perception. This method saw an increase in application after 2018 due to wider internet reach, an increase in computing capabilities and easy access to big data. The advent of machine learning and deep learning techniques has played a crucial role in the increase of big data studies. These studies use databases from search engines, social media, e-commerce websites, government portals, etc to scrape data, analyze it, and get new insights for various applications. These studies on air quality perception can be broadly classified into three types: complaint analysis, sentiment analysis and search analysis.
3.5. Complaint analysis studies
Complaint analysis studies use the complaint data filed by citizens in government web portals and social media to understand their perceptions. They are generally used with complaints regarding water pollution and odour problems, as people can easily perceive these problems with their senses. Gallagher and Dietrich (2014) used the complaint frequency and description diversity to assess the water quality. The complaints were categorized as appearance, taste, odour and illness. They used the Shannon Diversity Index to describe the diversity of the complaints. If the diversity is low, people perceive a common problem; if the diversity is high, there is no consistent pattern. They also used the frequency and diversity of complaints to identify pollution episodes. Avaliani et al (2016), Pan et al (2020)used the odour complaint data to identify and locate pollution sources. Avaliani et al (2016) compared the concentration and odour complaints and found the best-correlated pollution source location. While (Pan et al 2020) used the risk index to estimate the risk probability of a parameter contributing to odour complaint.
3.5.1. Advantages of complaint analysis studies
This method is very useful in locating pollution sources. As the location of the complaint is recorded in the database, spatial data analysis can be performed to get the probable location. Additionally, pollution episodes and accidents can be found.
3.5.2. Limitations of complaint analysis studies
While complaint analysis studies are useful for locating pollution sources, they work only when the pollution is identifiable with sensory perception. People may not perceive air pollutants until they reach the high levels required to file complaints. Only developed countries have well-established online grievance registration portals. Many developing countries still use the traditional method of filing complaints by meeting the authorities, so the online complaint database may not be available everywhere.
3.5.3. Use cases of complaint analysis studies
These studies have been used to assess environmental pollution episodes and locate pollution sources.
3.6. Sentiment analysis studies
Sentiment analysis studies use social media posts (Wang et al 2017) and publicly available data (Sun et al 2021) to analyze perception based on the post's sentiment. Mostly, the data from Twitter and Weibo have been used to analyze the perception. The data and methodology used in these studies are listed in table 3. Many studies have used machine learning-based techniques to classify the sentiment. Gurajala et al (2019) found that most tweets were made within 6 to 24 hours following an air pollution event. They also say that the public response (tweets) is driven by relative PM2.5 levels experienced by the people rather than absolute values. Another public sentiment study (Adhikary et al 2021) on air pollution mitigation measures found the people's response to be mixed, and those policies were highly criticized. Hswen et al (2019), Sailunaz and Alhajj (2019), Lu et al (2022)used natural language processing techniques to extract and classify sentiment/emotion from the social media posts. Better education and high income lead to a better evaluation of public opinion on air quality in social media (Min et al 2021). All the studies mentioned above found it feasible to use social media data to monitor air pollution where regulatory monitors are insufficient. They may be more effective in the urban areas of developing countries, where the monitoring networks are limited and social media use is prevalent.
Table 3. Overview of sentiment analysis studies.
| Study | Country | Data | Analysis |
|---|---|---|---|
| Sun et al (2021) | China | Public complaints | Sentiment, density, geospatial analyses |
| Wang et al (2017) | China | Weibo, Weather, A.Q data | Machine learning |
| Lu et al (2022) | China | Weibo, A.Q, Demography data | NLP, haze tolerance index |
| Hswen et al (2019) | UK | Twitter, A.Q data | NLP, sentiment classifier |
| Gurajala et al (2019) | India, UK, France | Twitter, PM2.5 | Machine learning |
| Sailunaz and Alhajj (2019) | Global | Twitter data | NLP, sentiment classifier |
3.6.1. Advantages of sentiment analysis studies
Sentiment analysis gives the ability to monitor pollution in real-time, using social media messages as proxies (Wang et al 2017). It provides highly resolved temporal and spatial data on perception, making it easy to compare it with observational data like air pollution, haze level, visibility, etc. We can also do retrospective analysis based on data availability.
3.6.2. Limitations of sentiment analysis studies
Most of the studies used social media posts in English, which limits these models' generalisability. They have to be trained on different datasets to analyze different languages. The datasets generally available are aggregate datasets (city-level), which may lack the granularity required for microscale monitoring. Another limitation of these studies is the lack of social media penetration in rural areas, specifically in developing and under-developed countries.
3.6.3. Use cases of sentiment analysis studies
These studies have been used to (i) qualitatively measure air quality, (ii) measure the spatial distribution of perception, and (iii) understand the response to air pollution.
3.7. Search analysis studies
Search analysis studies use the search keywords from common search engines like Google and NAVER and social media like Twitter. The different datasets and analysis techniques used in these studies are listed in table 4. All the studies have compared the change in air quality and internet searches. Ryu and Min (2020) found that when awareness was low among people, they used sensory information to perceive their surroundings. When the awareness was high, they used other scientific information to perceive their surrounding. Memory and accumulation of memory significantly affect perception when the awareness is high. They consider PM10 to affect perception more than visibility. O'Leary et al (2022) integrated the air quality data, traffic data and social media indicators and found a strong correlation between tweets, traffic and NO2. Brimblecombe and Lai (2021) also found strong links between bushfires and searches on air pollution. Zhang et al (2019) were able to establish the seasonal variability of perception to haze using network topology analysis. This was mainly attributed to the perception arising from physical symptoms due to haze pollution. On the contrary, (Lee and Bae 2021) found no correlation between scientific observations and active searches. Since they only used correlation analysis, the rapid increase in internet searches may have contributed to the lack of correlation. In addition, (Lu et al 2018) found that the public was more sensitive to short-term fluctuations in air quality, which was reflected in the search trends. However, the use of long-term trends did not show any correlation with public perception. Zagal Flores et al (2022) integrated the sensor-based air quality data, health data and perception data from social media databases to analyze the spatiotemporal variation of perception. The prevalence of keywords related to air pollution in traditional information sources like newspapers has also been used to understand perception (Patel et al 2022).
Table 4. Overview of search analysis studies.
| Study | Country | Data | Analysis |
|---|---|---|---|
| Ryu and Min (2020) | South Korea | PM10, Visibility, Google trends, NAVER | Perception index |
| Patel et al (2022) | India | Newspaper data, PM2.5 | Web scrapping, M.L |
| O'Leary et al (2022) | USA | Twitter, Traffic, A.Q data | Correlation analysis |
| Zagal Flores et al (2022) | Mexico | Twitter, A.Q data | Geospatial analysis, NLP |
a Note: A.Q—Air Quality; M.L—Machine Learning; NLP—Natural Language Processing
3.7.1. Advantages and limitations of search analysis studies
We can perform retrospective analysis, and they are particularly useful for monitoring the public sentiment after any pollution episode or accident, as supported by Zhai and Cheng (2020). The availability of multiple datasets increases the robustness of the perception study. However, this method may not be suitable in areas with limited internet access, such as developing countries.
3.7.2. Use cases of search analysis studies
These studies have been used to study the effect of media on perception and air quality trends from internet searches.
3.8. Health risk perception based studies
Health risk perception studies use questionnaire surveys to understand how people perceive the health risks due to air pollution. The different health risk perception indicators and analysis methods used in these studies are listed in table 5. Oltra and Sala (2018) found that self-reported attention to air pollution levels caused worry, and despite perceiving the air quality to be poor, people do not necessarily take preventive actions. They suggested using vivid, concrete and personalized air pollution information to improve the public's attention to air pollution. Reames and Bravo (2019) studied the spatial distribution of PM2.5, ozone, perception and health concerns at individual and area level characteristics. They found that knowledge of ozone alerts increased the odds of worsening perception. Poor neighbourhood and personal experience with health conditions influence the negative perception of pollution. They argue that public awareness campaigns and alert systems are not suitable for everyone, and the data dissemination needs to be tailored to target the audience. Gu et al (2020) studied the effect of air pollution on mental health and found that the floating population had a high psychological impact due to air pollution. Air pollution did not have a significant psychological effect on higher-income groups. Meanwhile, middle- and lower-income groups had a significant positive correlation between air pollution and psychological effects. Pu et al (2019) studied the spatial distribution of public risk perception of air pollution, considering the individual and regional characteristics. In general, the public's knowledge and attention towards air pollution was low. People who experience more air pollution episodes have a higher risk perception. Media was found to amplify the air pollution risk. There were regional differences in risk perception. Another study examined the relation between risk perception and tourist's intention to visit a place (Yang et al 2022). It was found that risk perception and attitude towards risk had a mediating effect between knowledge and travel intention. Zhang et al (2022) studied the haze risk perception among college students and found that haze risk perception was influenced by personal emotion, media communication and government policy. College students were found to believe that industries/companies were primarily responsible for haze, and the government had an important responsibility as well.
Table 5. Overview of health risk perception studies.
| Indicators used | |||||||
|---|---|---|---|---|---|---|---|
| Study | Country | No of samples | Demography | Risk Perception | Knowledge | Other indicators | Analysis methods |
| Oltra and Sala (2018) | Spain | 1022 | X | X | Protective actions, Information | MLR | |
| Reames and Bravo (2019) | USA | 2689 | X | X | A.Q, health concern | MLR, Logit model, CMAQ | |
| Gu et al (2020) | China | 16 000 | X | X | PM10, NOx | OLS | |
| Pu et al (2019) | China | 10 653 | X | X | A.Q, PM2.5 | Hierarchical LM | |
| Yang et al (2022) | China | 402 | X | X | X | Attitude, Tourism | SEM |
| Zhang et al (2022) | China | 349 | X | X | Media | EFA, Reliability analysis | |
a Note: OLS—Ordinary Least Squares; MLR- Multivariate Linear Regression; LM—Linear Model; EFA—Exploratory Factor Analysis; SEM—Structural equation Modelling; NLP—Natural Language Processing; CMAQ—Community Multiscale Air Quality Modelling
3.8.1. Use cases of health risk perception studies
These studies were used to understand the (i) haze risk perception, (ii) spatial distribution of risk perception, (iii) effect of air pollution risk perception on mental health, and (iv) effect of risk perception on travel.
3.9. Summary of perception studies
Three of the above categories, namely Perception Vs Indicator studies, Precautionary measures studies and Health risk perception studies, use questionnaire-based study design. These three methods can be combined into a single questionnaire by optimally selecting the indicators. However, no past studies have combined two or more of these methods. These three methods can cover a large population with minimal resources. During the study design, the following things must be considered with utmost care: population size, sampling methods, representativeness of the sample, selection of indicators and analysis techniques. They rely on self-reporting, so the questions must be framed to be understood by a wide population.
Preference studies are in-person interviews focused on getting a qualitative understanding of perception. They are suitable for small populations and are mostly used in a focus group setting, as they are resource-intensive. Study design must ensure no biases in framing questions and conducting interviews. In-person interviews can be supplemented with questionnaire-based surveys to enhance the study.
Big data analysis studies rely on publicly available secondary data. It is very easy to cover a large area and can be used for global comparison studies. Since high spatial and temporal data are available, it is easy to compare different time periods, unlike the previous methods. There have been no studies which have combined questionnaires or preference studies with big data analysis. Developing a framework for supplemental use of these different methods can give interesting results.
4. Development of perception index
In general, air quality indices consider the likely health impacts and provide break points to classify air pollution into different categories, which are then communicated to the people. However, as discussed before, the effectiveness of air quality communication is influenced by many other factors and subjective measures like perception, knowledge, socio-demography, etc. To address this issue, few studies have developed perception-based indices using different methods for better air quality management.
4.1. Air quality perception index (AQPI)
Ryu and Min (2020) used the AQPI as a function of PM10, visibility, memory strength and memory decay (equation (1)). They used a power law function to model the memory from psychology studies and introduced a memory component to improve the model. They assumed that people would be concerned more with air quality when the temperature is mild rather than extremely cold or hot conditions, and so added a sigmoid function.
where t is time in days, d is the memory decay component, µ is people's sensitivity to temperature (τ), and Ti is air temperature. The coefficients p, v and d were estimated using internet search volumes. This perception index is unique as it incorporates a memory component and gives more weight to recent events. The model with the memory component outperformed the model without the memory decay.
4.2. Air pollution perception index (APPI)
Sun et al (2021) developed the APPI as a piecewise function of normalized complaint density (Aird ) and normalized complaint emotional intensity (Airs ) to evaluate perception (equation (2)), with range 0 to 1. The public perception is stronger if the APPI is closer to 1.
where,
This index could be used in real-time by collecting the details from complaint registration portals to have a spatial understanding of public perception. The use of big data has increased the application potential of this index, having a wide range of possible applications in various fields.
4.3. Haze psychological tolerance index (HPTI)
Lu et al (2022) developed the HPTI to quantitatively assess the public's psychological tolerance under haze. The index is a function of the air quality index (AQI), number of microblogs and emotional inclination (equation (3)). The larger the index, the higher the public's psychological tolerance.
where, WEp
is the number of positive microblogs, WEn
is the number of negative microblogs, AEn
is the mean negative sentiment score, AEp
is the mean positive sentiment score and  is the concentration of PM2.5.
They conducted a prefecture-level spatiotemporal study of perception, which could be very helpful to policymakers and urban management teams in effectively understanding people's perceptions, thereby enabling them to make better decisions.
4.4. Comparison of the perception indices
AQPI uses only the observed environmental parameters like PM10 and visibility, along with memory component. Thus, it can be used only for temporal analysis. It is easy to integrate with the existing AQI, as they are only a function of air pollutant levels. It can also help in deciding the frequency of air quality alerts. APPI is a function of complaint density and emotional intensity. So, they can monitor the real-time public sentiment and provide spatio-temporal analysis of perception. It can be very useful in understanding public behaviour after pollution accidents and episodes. HPTI is a function of PM2.5, number of microblogs and emotional intensity. It can also provide spatiotemporal analysis of perception.
5. Future perspectives
Many studies have found that people's perception of air pollution does not always correlate with pollution levels. Many factors like emotion, sentiment, demographic characteristics, knowledge, past experiences, etc highly influence them. Perception, being highly subjective, makes it difficult to tease out the underlying factors that affect perception and mediate different variables.
5.1. Need for tailored data dissemination
Data dissemination is a crucial component in urban management systems. This influences people's behaviour, participation and acceptance of management policies. The recent prevalence of different communication channels and the public's loss of trust in some of these mediums have made science communication and data dissemination very complex (Kim et al 2020). The underlying mechanisms that affect people's perception and trust, and the mechanisms that nudge them to be proactive, must be studied further to arrive at a consensus. Many studies (Brody et al 2004, Schmitz et al 2018) have highlighted the discrepancies between the data communicated, perception and the reactive actions taken by people. Boso et al (2019), Tan and Xu (2019)have suggested tailoring the information to target groups. Segmenting the population based on their demography, perception, and propensity to take action can help develop effective communication strategies.
5.2. Need for integrating big data
With the ever-increasing presence of people in social media, it has become imperative to integrate big data with conventional methods for a comprehensive understanding of public perception. The use of social media databases and search engine databases has made real-time perception analysis a possibility (Wang et al 2017, O'Leary et al 2022). Even though a large data set is available, the relatively less penetration of social media in rural areas is still a limitation. Integrating both conventional and big data methods can address some of the limitations of both methods and bring the best of both worlds. Currently, the big data methods have a city-level granularity and are mostly useful in urban areas due to the high internet usage (Lu et al 2018, Gurajala et al 2019). The granularity could become finer in the future, and these methods could help the urban planning authorities make better decisions. It also has a huge potential for interdisciplinary applications like air quality management (Min et al 2021), traffic management (O'Leary et al 2022), episode management (Gallagher and Dietrich 2014), etc
5.3. Need for robust frameworks
Many different approaches, some quantitative and some qualitative, have been used to understand the public's perception of air pollution. However, both these methods have some limitations when used separately. Using a combination of qualitative and quantitative methods can effectively address some of the limitations (Marquart et al 2021). More research is needed to develop frameworks to combine qualitative and quantitative perception measurements.
5.4. Need for perception index
The AQI is commonly used worldwide to disseminate data about air quality to the public. Some countries also suggest protective measures and behaviours corresponding to the AQI level to reduce exposure (CPCB 2015, DEFRA 2022). Even though AQI effectively communicates air quality information in a simplified manner, the findings in the study make us wonder if AQI, in its current form, is effective in nudging people to take preventive actions. Many studies (Oltra and Sala 2018, Reames and Bravo 2019, Barg et al 2022, Kramm et al 2022) have suggested using personalized science-backed air pollution information to improve public attention to air pollution. We believe that integrating perception as a component of AQI can make it more comprehensive and effective in promoting proactive behaviours in the public.
6. Conclusion
In this systematic review, we evaluated different methodologies used to understand people's perceptions of air pollution, and we classified them according to the methodology and variables used. More studies and novel methods have been used in the last couple of years, and there have been interesting insights regarding the effect of media, knowledge, gender and socio-economic conditions on air pollution perception. More robust frameworks integrating qualitative, quantitative and big data methodologies are needed to comprehensively understand the mechanisms influencing perception. The perception index, combining perception and AQI, can be used in data dissemination strategies to promote and encourage proactive behaviours among the public. The importance of authentic and tailored data dissemination has been emphasized in many recent studies. Effective communication can bridge the gap between the public and policymakers/scientists, which will help increase public participation and acceptance of urban management policies.
Data availability statement
No new data were created or analysed in this study.
CRediT authorship contribution statement
Aswin Giri J: Conceptualization, Investigation, Visualization, Writing—Original Draft. Shiva Nagendra SM: Supervision, Writing—Review & Editing.
Conflict of interest
The authors declare that they have no known competing financial interests or personal relationships that could have appeared to influence the work reported in this paper.
Funding
This research did not receive any specific grant from funding agencies in the public, commercial, or not-for-profit sectors.