

Abstract
Beavers strongly impact hydrology and ecosystems through their widespread dam building that creates ponds and wetlands. Monitoring the relative abundance of beavers and their waterbodies is needed to assess these effects and factors influencing population levels. However, the ability to do this over vast, remote regions is limited with conventional aerial or field-based surveying. To address this challenge, we developed a satellite remote sensing method to track beaver ponding changes over multiple decades and applied it to a 5127 km2 region of the coastal Hudson Bay Lowlands in Manitoba, Canada. Annual, sub-pixel surface water mapping using 30 m resolution Landsat satellite data, combined with a spatial database of beaver dams, permitted the mapping of 37 year (1985–2021) beaver ponding dynamics. We identified 1714 beaver dams and 1085 beaver pond complexes covering 31 km2, indicating that beavers have an important influence on stream hydrology in this high subarctic landscape. The total area of ponding decreased by 53% from 1986–1989 and by 80% by 1995, and then gradually recovered to initial levels by 2015. The early, steep drop in beaver ponding corresponded to a 13% decline in regional surface water area, while a similar wetness decline during 2015–2018 resulted in little change in beaver ponding. We suggest that strong beaver ponding dynamics were likely caused by the interaction between streamflow levels and beaver populations living near their northern range limit and cold tolerance. The pond mapping method can be applied to other regions if the long-term distribution of beaver dams is known, and ponds are large enough to be identified using a Landsat sub-pixel approach.
Export citation and abstract BibTeX RIS

Original content from this work may be used under the terms of the Creative Commons Attribution 4.0 license. Any further distribution of this work must maintain attribution to the author(s) and the title of the work, journal citation and DOI.
1. Introduction
The North American beaver, Castor canadensis, is a keystone species and ecosystem engineer that substantially modifies its environment by harvesting trees and building dams and canals (Naiman et al 1986, Rosell and Campbell-Palmer 2022). These modifications strongly influence local vegetation, hydrologic processes, biodiversity, and permafrost when present (Lewkowicz and Coultish 2004, Rosell et al 2005, Hood and Bayley 2008, Westbrook 2021). Monitoring beaver populations and their ponds is therefore needed at broad scales to assess these impacts, the potential causes for changes in beaver populations, including distributional shifts (Tape et al 2018), and the effects of beaver management actions.
Conventional beaver surveying involves aircraft with visual observers (Bergerud and Miller 1977, Payne 1981, Potvin et al 1992, Ribic et al 2017) or ground census methods (Hood and Bayley 2008, Hood 2020) to record signs of recent beaver activity, as evidenced by the creation of winter food caches or modifications to beaver lodges and dams. Aerial surveying has also been combined with habitat suitability modelling to interpolate beaver populations within a partially surveyed domain (Thompson et al 2022). A limitation with these survey methods is their expense and difficulty covering larger regions, especially remote ones. Frequent surveys are also required to reveal changes in dynamic beaver populations (McLaren et al 2022).
When conventional beaver surveys are not feasible, or researchers want to document long-term changes in beaver activity, the interpretation of aircraft-based photo archives has been used. In this case, the area or number of mapped beaver ponds serves as a proxy measurement for beaver populations (Broschart et al 1989, Johnston and Naiman 1990, Cunningham et al 2006, Hood and Bayley 2008, Johnston and Windels 2015, Kivinen et al 2020, Johnson-Bice et al 2022). More recently, high-resolution satellite imagery (e.g. from WorldView) has been employed in combination with air photos to document the expansion of beaver ponds in Alaska (Jones et al 2020, Tape et al 2022). A related study also used trends in multispectral indices derived from coarser resolution (30 m) Landsat satellite imagery (1999–2014) to identify new beaver pond complexes in a predominantly tundra region of northwest Alaska (Tape et al 2018).
The unique geological history, topography, and climate of the Hudson Bay Lowlands (HBL) in Canada likewise supports distinctive plant and animal communities (Abraham et al 2011), including portions of the northern range limit of beavers. As well, the subject of beavers recently extending beyond this traditional range has gained attention (Jung et al 2016, Tape et al 2022). Despite the widespread distribution of beavers in the HBL, few recent investigations have been conducted (Woo and Waddington 1990) and no comprehensive information is available on beaver occurrence or long-term changes (Abraham et al 2011). In the HBL and many subarctic regions of Canada, available air photo archives are limited to a few older collections of relatively coarse-scale (⩾1:60 000) panchromatic imagery that have limited utility for documenting changes in beaver ponding. Since 2000, a sparse temporal collection of commercial high-resolution (<1 m) satellite images has been available for such regions, but processing these data over large areas remains costly and challenging.
The 30 m resolution Landsat satellite archive, providing data from 1984 to present, has been used to map surface water changes at continental (Olthof and Rainville 2022) to global scales (Pekel et al 2016), although we have observed that the 30 m resolution of these binary products is generally insufficient for beaver pond mapping. In this study, we show that changes in relatively large, stream-connected beaver ponds in the high subarctic can be measured if a Landsat mapping approach is used that depicts the percentage of surface water in each pixel. We demonstrate the use of this sub-pixel approach for mapping long-term, interannual beaver ponding dynamics and investigate factors that may be linked to ponding changes.
2. Methods
2.1. Study area
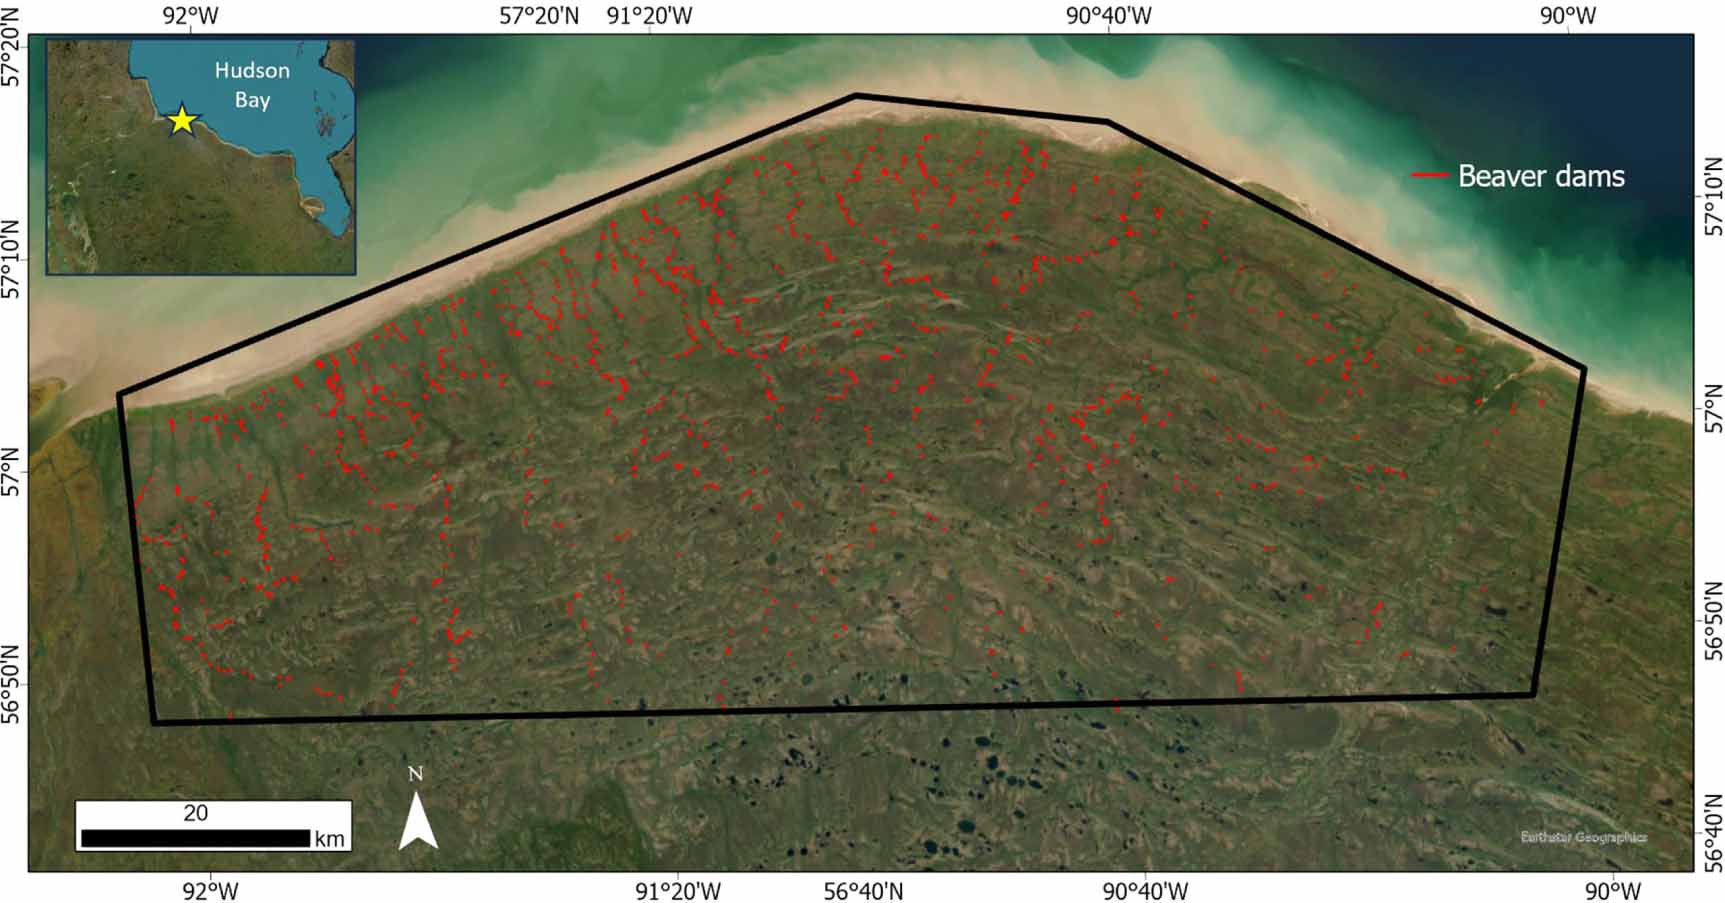
The study area is a 5127 km2 region in the Coastal Hudson Bay Lowland Ecoregion (Hudson Plains Ecozone) in northeastern Manitoba, Canada (figure 1) (Abraham et al 2011). This ecoregion is characterized by short, cool summers with 1991–2020 monthly average temperature exceeding 0 °C from June to September at Churchill, Manitoba, 250 km to the northwest. Winters are very cold with a 1991–2020 January mean temperature of −25.1 °C. It has a high subarctic ecoclimate and lies in the transition zone between tundra and forests composed of open stands of spruce and tamarack. The region's gently sloping (<1 m km−1) marine plain is interrupted by 1–3 m high beach ridges lying parallel to the coast that were formed by post-glacial isostatic rebound, where ground uplift continues at a rate of about 100 cm per century (Dredge and Dyke 2020). The raised ridges and permafrost peat plateaus occurring to the south are covered by spruce (Picea spp.), tamarack (Larix laricina), ericaceous shrubs, and reindeer lichen. Areas between these elevated features contain fen wetlands with sedge and shrub vegetation, and shallow lakes and ponds (Abraham et al 2011, Dredge and Dyke 2020). Narrow, low-gradient streams carry runoff from the wetlands and are frequently dammed by beavers (Woo and Waddington 1990). Notable in relation to beaver forage is that the area lies beyond the range limit of their favoured deciduous tree species such as trembling aspen (Populus tremuloides). Like in other high subarctic regions, beaver forage is provided by riparian willow shrubs (Salix spp.) and aquatic vegetation (Nash 1951, Novakowski 1965, Milligan and Humphries 2010). Recent permafrost modelling (Obu et al 2019) estimates that the study region contains primarily discontinuous permafrost with 50%–90% coverage and a narrow band of continuous permafrost (>90% coverage) along its western coastal zone. The nearest settlement is Shamattawa, a Cree First Nations community with a population of 1425, located 100 km south of the study area.

Figure 1. Study region in northern Manitoba lying within the Coastal Hudson Bay Lowland Ecoregion. Interior spruce and lichen-covered beach ridges lying parallel to the shoreline can be observed due to their brighter surface. Beaver dams (n = 1714) delineated using high resolution WorldView satellite imagery are shown in red. Background image source: Earthstar Geographics.
Download figure:
Standard image High-resolution image2.2. Beaver pond mapping approach
Our satellite-based technique to map the spatio-temporal distribution of beaver ponds is based on annual Landsat mapping of surface water bodies, combined with comprehensive delineation of beaver dams to identify bodies controlled by beaver engineering (figure 2). All beaver dams in the study area were manually identified and digitized using 0.5 m resolution pan-sharped WorldView imagery available in ArcGIS Pro v3.0.4 as the ESRI world imagery basemap (figures 1 and 2). In areas of cloudy or poor image coverage, we interpreted additional, post-2010 WorldView imagery available in ESRI World Imagery Wayback. As we wanted to document the area of beaver ponds present at any time during 1985–2021, we digitized actively maintained dams and abandoned, remnant dams that no longer strongly influence streamflow (figure S1). Remnant dams and adjacent regenerating beaver meadows identified in this region often corresponded to ponds last drained during the late 1980s or even before the 30 m Landsat record. We believe this approach should therefore also capture ponds active only during the early part of 1985–2021 Landsat record.

Figure 2. Major steps used to identify beaver ponds using Landsat and WorldView satellite imagery and then derive annual surface water area for each beaver pond complex and year.
Download figure:
Standard image High-resolution imageAll surface water bodies within the study region were mapped annually (1985–2021) using a sub-pixel classification technique that exploits the massive and freely available 30 m Landsat satellite image archive (Olthof and Fraser 2024). The method generates annual, clear-pixel Landsat image composites based on the median surface reflectance from a running three-year June 1 to September 30 collection of Landsat Collection 2, Tier 1, Level 2 images. A three-year collection is used to generate sufficiently high-quality, cloud-free composites covering the HBL. Percent water fraction within each 30 m pixel is derived by linear unmixing of the near-infrared band, where spectral land endmembers are adaptively sampled from local land surface pixels and a global water end member is used. The method was validated in Olthof and Fraser (2024) over the HBL using water body masks derived from WorldView satellite images and is further assessed here for its ability to map beaver pond sizes and changes.
A long-term, maximum water extent map was created by calculating the maximum percent water fraction for each 30 m pixel from the 37 annual water masks from 1985–2021 (figure 2(b)). Unique water objects were then created by spatially grouping connected pixels containing more than 15% water at any time during the analysis period (figure 2(c)). We specified a minimum 15% water fraction so that separate beaver ponds were less likely to be joined along narrow stream reaches or connected to dark riparian spruce forest that can produce erroneous, low water fraction predictions (Olthof and Fraser 2024). The water objects were then spatially filtered according to those that were larger than three pixels and located within one pixel (30 m) of a beaver dam, reducing their number from 99 263 to 1085 (figure 2(d)). The resulting multitemporal beaver pond analysis objects may contain more than one dam in succession, and likely represent either single beaver colonies or more than one colony sharing a longer ponded stream segment (figure 2(d)).
After multitemporal water objects spatially associated with beaver dams were identified, their sub-pixel Landsat surface water area was calculated for each year (figures 2(e) and S2). The potential number of occupied beaver ponds where dams were being actively maintained was also estimated for each year. Since no direct observations are available to determine beaver activity over such a large region and timespan, occupied ponds were defined as those exceeding an arbitrary proportion (0%, 20%, or 50%) of their 37 year maximum surface water area in any given year. A zero percent threshold was used to identify the number of ponds containing any detectable surface water. A 20% threshold was included based on the assumption that ponds falling below this would have a low probability of occupation, while if a 50% threshold was exceeded, ponds would have a higher probability of being occupied.
To assess the accuracy of Landsat-based beaver pond mapping, we compared spatial and temporal surface water area predictions with surface water derived using ∼2 m resolution satellite images (table 1). Surface water was mapped in three recent images (2016–2018) using interactive thresholding of the near-infrared band. The high-resolution pond areas were then extracted for 476 overlapping Landsat beaver pond objects after buffering them by 30 m to account for ponds potentially extending beyond the Landsat objects. To conduct a temporal comparison, surface water area was also mapped in overlapping areas from four earlier WorldView images (2010–2012) to yield high-resolution surface water changes for 185 of the Landsat-based pond analysis objects.
Table 1. Specifications for high-resolution satellite images used to assess the accuracy of Landsat-based beaver pond mapping.
| Satellite | Image date | Overlapping early image dates |
|---|---|---|
| Geoeye-1 | 10 July 2018 | 2 August 2011 |
| 10 August 2010 | ||
| WorldView-2 | 12 July 2017 | 22 August 2012 |
| WorldView-2 | 14 July 2016 | 17 July 2010 |
| WorldView-2 | 22 August 2012 | |
| WorldView-2 | 2 August 2011 | |
| WorldView-2 | 10 August 2010 | |
| WorldView-2 | 17 July 2010 |
2.3. Investigating factors related to beaver ponding changes
We examined several factors known to affect beaver populations to determine if they could explain the long-term variation in Landsat-measured beaver ponding (table 2). Although no ground-based climate or hydrological measurements were available from the remote study region for this purpose, published datasets could be used to explore certain factors (table 2, column 3). We also derived a measure of regional precipitation and background wetness (factor 1) from the annual Landsat-based surface water (Olthof and Fraser 2024) of all areas in the study region not associated with beaver ponds and streams, including shallow lakes, ponds, and patterned fens (Abraham et al 2011). Monthly stream discharge data (factor 1) were available from two hydrometric stations (04AB001 and 04AD002) lying within a different watershed (Hayes River basin) 70–110 km to the south of the study region. Only mean January discharge anomaly was examined since it provided nearly complete records of annual low-flow conditions for 1985–2021.
Table 2. Factors potentially causing changes in beaver populations and ponded area, and environmental measurements used to assess their role in the study region.
| Influencing factor | Biological significance | Measurements to assess role |
|---|---|---|
| Severe drought can reduce beaver pond levels and extents, while increasing the chance of exposure to predators and potentially restricting winter access to food caches (Hood and Bayley 2008, Gable et al 2018, Rosell and Campbell-Palmer 2022) | Regional non-stream surface water area from Landsat (Olthof and Fraser 2024), January stream discharge anomaly (1991–2020) for two hydrometric stations (data extracted from the Environment and Climate Change Canada Historical Hydrometric Data web site https://wateroffice.ec.gc.ca/mainmenu/historical_data_index_e.html), and annual total precipitation anomaly (1991–2020) in Churchill, Manitoba, 250 km to the northeast (Environment and Climate Change Canada) |
| Very cold winters can increase depth of pond freezing and beaver mortality (Bergerud and Miller, 1976) | Homogenized winter temperature anomaly (1991–2020) in Churchill, Manitoba (Environment and Climate Change Canada) |
| Low snowfall cover can reduce thermal insulation over beaver lodges and lead to deeper pond freezing (Novakowski 1965) | Maximum annual snow water equivalent anomaly (1985–2015) based on radar satellite data (Mudryk et al 2018) averaged over the study region |
| A continued supply of local forage is needed to sustain beaver colonies (Rosell and Campbell-Palmer 2022) | Annual average NDVI in a 30 m buffer surrounding each beaver pond analysis object |
| Overharvesting can deplete regional beaver populations | Reported beaver harvest data for Manitoba (1985–2021) and the Shamattawa Registered Trapline Section covering the study region (22 years from 1985–2016) from Manitoba Department of Economic Development, Investment, Trade and Natural Resources |
| Tularemia epizootics can cause rapid, regional beaver mortality (Labzoffsky and Sprent 1952; Lawrence et al 1956) | None |
| Predators (especially wolves) can impact beaver populations (Potvin et al 1992, Gable et al 2018, 2020) | None |
| Large fires can have negative short-term impacts (Hood et al 2007) yet be beneficial in the longer-term if they promote regeneration of broadleaf vegetation (Westbrook 2021) | None—although fires in our study region were mainly restricted to spruce-lichen upland areas that are likely not utilized by beavers |
Variation in beaver forage availability (factor 4) was represented by the normalized difference vegetation index (NDVI), which provides a measure of vegetation leaf area and phytomass (Riedel et al 2005). NDVI was computed for each annual Landsat composite and beaver pond analysis object within a surrounding single 30 m pixel buffer that excluded pixels where any Landsat surface water was detected during 1985–2021. This buffer was selected to reflect the overland distance that beavers will typically travel from their ponds to obtain forage (Novakowski 1965), in the absence of precise information from subarctic lowland areas. Simple Pearson correlations and visual inspection of time series and scatterplots were used to investigate relationships between annual values of these variables and total annual beaver ponding area. We also examined the correlation between annual ponded area and surrounding 30 m NDVI for each of the 1085 pond analysis objects.
3. Results
The beaver dams in our wetland study region appeared as low berms covered by vegetation, which typically extended beyond the narrow stream channels to span the surrounding flat floodplains (Karran et al 2018). The dams were frequently demarcated by raised beach ridges running perpendicular to the north flowing streams (figures S1 and S7). A total of 1714 beaver dams were digitized that had a mean length of 95 m, and combined length (164 km) that is longer than the east-west extent of the region. Several exceptionally large dams were identified, including 31 dams longer than 300 m and one potentially longer than 800 m (supplementary materials—appendix 1). Beaver lodges that were identified with high confidence using the WorldView imagery were also digitized (n = 916) and often approached a diameter of 15 m. Unlike beaver dams, lodges may be confused with other riparian features in the 0.5 m resolution imagery, especially if they are abandoned and covered by vegetation. The first author chartered a de Havilland DHC-2 Beaver floatplane from Thompson, Manitoba on July 12, 2023, to collect photographs for interpreting beaver dam, pond, and vegetation conditions within the study region (figure 3).

Figure 3. Aerial photographs of beaver pond complexes taken 12 July 2023, from a floatplane using a Sony a7R III digital camera. Panels (a)–(b) show active beaver ponds and (c)–(d) show regenerating meadows in beaver ponds that were last flooded in 2008 (c) and 1987 (d).
Download figure:
Standard image High-resolution imageThe time series of Landsat-derived beaver ponded area demonstrated a parabola shape, where it declined from 1985–1995, remained at low levels from 1995–2005, and then increased from 2005–2015 before remaining relatively stable (figure 4(a)). In addition to this annual time series, the regional decrease and increase in beaver ponding can be clearly observed in Landsat linear spectral trends (Fraser et al 2014) derived for the periods 1985–2001 and 2002–2021 (figure S3) and by comparing the Landsat composites from 1985, 1995, and 2015 (supplementary GIF file). Curves representing the number of potentially occupied beaver ponds (defined as ponds exceeding an arbitrary proportion of their maximum area) showed a similar pattern as total ponded area (figure 4(b)). Ponded area and the number of occupied ponds based on a liberal 20% threshold both declined by more than 80% from 1985–1995, before mostly recovering to 1985 levels by 2015. The number of ponds containing any Landsat-detectable surface water (>0% of maximum) declined by 60% from 1985–1999, and 76% of ponds had no water detected during at least one year of the analysis period.
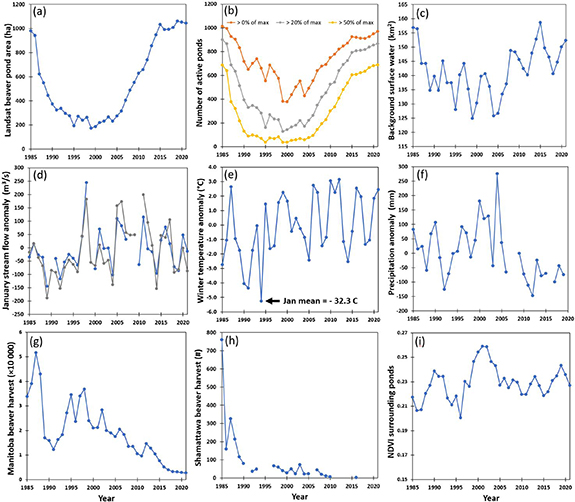
Figure 4. Time series line plots showing (a) total beaver pond surface water area derived using Landsat, (b) the potential number of active ponds where a pond is considered occupied in a year if its surface water area is larger than a certain percentage of its maximum, (c) background surface water area of non-beaver pond water bodies within the study region, (d) January streamflow anomaly for two hydrometric stations contained within the Hayes watershed that lies immediately the south of the study area watershed, (e) Churchill winter temperature anomaly, (f) Churchill annual precipitation anomaly, (g) preceding September to August beaver harvest in Manitoba, (h) beaver harvest in the Shamattawa Registered Trapline Section, and (i) average annual NDVI surrounding all beaver pond analysis objects.
Download figure:
Standard image High-resolution imageThe repeated cycles of beaver pond occupation and drainage since 1985, based on a 20% of maximum threshold, are summarized in figure 5. For the first 15 years of the time series, most beaver pond complexes experienced only one or two periods of ponding, but by the end of the regional 2005–2015 ponding increase, more than 40% of them had been active on three or more occasions (figure 5(a)). The number of years since inactive ponds were last ponded similarly increased during the 37 year Landsat time series (figure 5(b)). By 2015, when regional ponded area had stabilized at high levels, about half of inactive ponds had been drained for at least 25 years.

Figure 5. The repeated cycles of occupied or active beaver ponds and inactive, drained beaver ponds from 1985–2021, where active ponds are defined based on having an area larger than 20% of their maximum. The number of active ponds is shown in (a) classified by colour according to the number of times ponds have been active since 1985. The number of inactive ponds is shown in (b) classified by colour according to the number of years since they were last active. The graphs were styled after Kivinen et al (2020).
Download figure:
Standard image High-resolution imageMost environmental variables examined (table 2, figures 4(c)–(i)) showed no significant correlation (p > 0.05) with annual beaver ponding area, except for Landsat-measured background surface water, Churchill annual precipitation anomaly, and beaver harvest intensity (table 3). However, only background surface water area demonstrated a strong correlation (R2 = 0.61). The averaged NDVI values surrounding the 1085 pond complexes did not exhibit any long-term trend (p > 0.05, figure 4(i)) but more than 500 of them showed individual negative correlations (p < 0.05) with annual ponded area. This would be consistent with a decline in leafy vegetation forage surrounding ponds when they are increasing in area, although it is possible that NDVI was also reduced by expanding surface water that was not detected in the Landsat water predictions, along with any resulting needle-leaf tree mortality (figure 3(b)).
Table 3. Pearson correlations and significant levels between annual beaver pond area and potential explanatory variables. The influencing factor represented by each variable (table 2) is shown in parentheses.
| Pond change explanatory variable | Pearson correlation (r) |
|---|---|
| Background surface water (1) | 0.78 (p < 0.005, n = 37) |
| Stream discharge for station 04AB001 (1) | −0.05 (p > 0.05, n = 33) |
| Stream discharge for station 04AD002 (1) | 0.05 (p > 0.05, n = 36) |
| Snow water equivalent anomaly (1, 3) | −0.28 (p > 0.05, n = 31) |
| Churchill annual precipitation anomaly (1) | −0.46 (p < 0.005, n = 33) |
| Churchill winter temperature anomaly (2) | 0.13 (p > 0.05, n = 37) |
| Forage availability (NDVI) surrounding ponds (4) | −0.25 (p > 0.05, n = 37) |
| Manitoba beaver harvest (5) | −0.45 (p < 0.005, n = 37) |
| Regional Shamattawa beaver harvest (5) | −0.54 (p < 0.05, n = 22) |
A comparison of 476 Landsat beaver pond areas to corresponding areas derived from high resolution WorldView imagery showed a strong linear fit (R2 = 0.90, figure 6(a)). This indicates that the Landsat sub-pixel technique is effective for mapping the spatial variation in beaver pond size. WorldView pond areas were found to be on average 87% larger than Landsat areas. We believe the major reason for this Landsat underestimation is that all observed beaver ponds were relatively turbid (figures 3(a), (b) and S8), resulting in a higher near-infrared reflectance (Moore 1980) than the global water spectral end member used for linear unmixing. Rather than re-calibrate the linear mixture algorithm for beaver ponds and potentially increase the amount of commission error, we recommend that the Landsat-WorldView regression equation in figure 5(a) be used to calibrate Landsat beaver pond areas. Accordingly, the average maximum pond surface water area was 2.8 ha, and all ponds covered a total maximum of 30.7 km2.
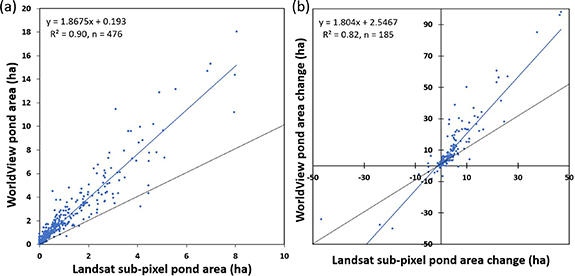
Figure 6. (a) Comparison of 476 beaver pond areas mapped using our Landsat-based method and 2 m resolution WorldView satellite data, and (b) comparison of 185 Landsat pond area changes with WorldView pond changes. The blue lines and coefficients of determination (R2) were derived from linear least-squares regression and the black lines represent 1:1 relationships.
Download figure:
Standard image High-resolution imageLandsat and WorldView beaver pond surface water changes over 5–8-year intervals during a period of beaver pond expansion also demonstrated a strong linear relationship (R2 = 0.82, figure 6(b)). Only 20 of 185 Landsat-based change estimates were opposite in sign, and 11 of these corresponded to WorldView pond changes of less than one hectare. Figures 7 and S4 show comparisons of beaver pond surface water changes that were derived using Landsat and WorldView. In all cases, construction of new dams or restoration of older dams can be observed in the WorldView image pairs.

Figure 7. Changes in a beaver pond (2010–2018) shown using WorldView near-infrared images (a)–(b), WorldView-based water masks (light blue) (c)–(d), and Landsat fractional surface water maps (e)–(f). The red polygon shows the area within which WorldView surface water was extracted.
Download figure:
Standard image High-resolution image
4. Discussion
Our analysis demonstrates that a new sub-pixel beaver pond mapping technique that uses the Landsat satellite archive can effectively track multidecade dynamics of beaver ponding in a large, subarctic region. It also shows that beavers have a major effect on stream hydrology in the northern HBL, which is highly variable over time. By mapping 1085 beaver pond complexes, we found that 759 km or 19% of stream lengths have been modified by beavers. Studies in other permafrost regions indicate that beaver ponds may rapidly degrade permafrost when flooding new sites (Jones et al 2021). Beaver ponds in Arctic tundra also represent methane hotspots that can be detected using hyperspectral airborne image spectroscopy (Clark et al 2023).
The annual surface water area of background shallow lakes, ponds, and fens in the study region was the only environmental variable strongly correlated with beaver ponding. This suggests that long-term variation in regional wetness was at least partially responsible for the early reduction in beaver ponding. Extended periods of drought can cause pond levels and extents to shrink, while a shallower or reduced cover of water may also make beavers more vulnerable to predation (Gable et al 2018). Low pond levels can also lead to food caches becoming frozen into the ice during winter, resulting in either starvation or a high risk of predation when beavers are forced to go onto land to obtain forage (Hood and Bayley 2008, Rosell and Campbell-Palmer 2022). However, note that we also observed increasing (2008–2012) or stable (2015–2018) beaver pond area (figure 4(a)) during subsequent periods that had multiyear reductions in background wetness but at higher regional surface water area (figure 4(c)). Indeed, beavers are noted for their ability to maintain water table levels and ponds during periods of low-flow or moderate drought (Westbrook et al 2006, Hood and Bayley 2008).
Significant beaver mortality from disease may provide a potential explanation for the rapid 1986–1987 ponding decline when precipitation, streamflow, and winter temperature were near average. The bacterium Pasteurella tularensis causing tularemia can spread quickly among beaver colonies and lead to rapid, regional mortality (Labzoffsky and Sprent 1952, Banfield 1954, Lawrence et al 1956) with accompanying declines in pond water levels when dams become unmaintained (Banfield 1954). In 1949, 33 dead beavers were reported in the York Factory and Shamattawa areas in and near our study region that had lesions consistent with tularemia, although the bacterium was not confirmed (Nash 1951). Several epizootics of tularemia in beavers were also reported in northern Ontario during the late 1940's and 1950's, including a severe one in 1949 in the Severn River watershed that extends to the northeast Manitoba border, 50 km east of the study region (Labzoffsky and Sprent 1952, Ontario Department of Lands and Forests 1955, Finch 2013, 2020). These observations thus provide a precedent for a broad-scale outbreak of tularemia in the northern HBL.
One argument against the tularemia hypothesis is a lack of recorded cases in our remote study region during the 1980's, although the disease was observed in some northern portions of Manitoba (Johnson 1990) and Ontario (Wobeser et al 2009). Another is the extended duration and slow recovery of the beaver pond decline. Nevertheless, several factors may have interacted during the 1986–2000 pond decrease, including anomalously cold winters (figure 4(e)) and low stream levels (figures 4(c) and (d)) that would cause deeper freezing of shallower ponds (Bergerud and Miller 1977, Hood and Bayley 2008, Ribic et al 2017). Note that these environmental factors may impact beaver populations in single years (leading to low long-term correlations), cause lagged effects, and could only be imperfectly measured using available data from mostly outside the study region. Replenishment of beavers from source populations might also be expected to be slow, as the study area lies near their northern range limit (Rosell and Campbell-Palmer 2022).
Predation is another source of beaver mortality that could be significant for a beaver population near its northern range limit. Wolves had been identified as a problem as early as 1951 for beaver trappers in Wabowden, west of the Shamattawa area (Nash 1951). Only recently has the importance of beavers to wolf diets been better understood for northern Manitoba. In the Churchill and Limestone Registered Trapping sections (immediately northwest of Shamattawa), Moayeri (2013) found using stable isotope analysis a 0%–40% credible interval (25% mode) for the proportion of beavers in wolf diet in summer to late fall. The importance of beavers as prey for wolves has also been demonstrated in southern boreal areas of Manitoba (Sallows 2007, Mocker 2015, Naaykens et al 2016), and Minnesota (Gable et al 2020). The northern Manitoba population of wolverines, another predator of beavers, began to recover in the 1950s and were being harvested in large numbers by 1980. No information is available, however, regarding the impact of these or other potential predators (e.g. black bears) on beaver populations in the Shamattawa study region.
It is unlikely that overharvesting of beavers had a major influence on populations and early ponding changes in the study region. Since 1987, there has been a long-term reduction in Manitoba beaver trapping (figure 4(g)) following a downturn in pelt prices and the number of trapping permits issued (Abraham et al 2011). While relatively high harvest levels occurred during the early drop in beaver ponding, available data for the Shamattawa Registered Trapline Section indicate smaller levels of trapping (figure 4(h)) that would be expected for a remote region with lower beaver density (Nash 1951). If the average harvest for the two years preceding the rapid ponding decline (460 beavers) is scaled to the 20% proportional area covered by the study region, an equivalent trapping intensity would be 92 beavers taken from more than 1000 pond complexes.
In this study, we tracked surface water changes related to beaver damming, but how well does this indirect measure represent shifts in beaver population size? Several studies have demonstrated a positive relationship between beaver populations and ponded area (Broschart et al 1989, Johnston and Naiman 1990, Hood and Bayley 2008, Johnston and Windels 2015, Johnson-Bice et al 2022), although at small populations the most favourable sites allowing for impounding larger ponds are selected first (Johnston and Naiman 1990, Cunningham et al 2006, Johnson-Bice et al 2022). The capacity for beaver dams to retain water also gradually decreases after they are abandoned (Woo and Waddington 1990, Karran et al 2018, Levine and Meyer 2019), leading to a lag in ponding reduction, which could be observed in our study area by the state of some beaver pond complexes in 2023 (figure S8). This can make interpreting regional beaver ponding changes more challenging (Johnston and Windels 2015, Johnson-Bice et al 2022) and likely contributed to the gradual ponding reductions between 1987 and 1995. It would be useful to measure annual changes in pond retention following abandonment for subarctic lowland dams and compare this to regions containing higher-gradient streams.
A limitation of our beaver pond change mapping technique is that ponds must be sufficiently large (∼0.3–0.5 ha) to reliably detect using Landsat sub-pixel surface water mapping. It should be well-suited to wetland landscapes where flat topography and gentle stream gradients typically lead to beavers creating longer dams and larger ponds (Johnston and Naiman 1987, Karran et al 2018). In other regions, the technique may be able to capture the dynamics only of larger ponds, and it will not apply to areas where beavers live in bank dens and do not modify water levels, such as in larger rivers and many lakes. For our study region, we assumed that when ponds drain to a relatively small size (i.e. either below 20% of their long-term maximum or the limit of Landsat sub-pixel water detection) they have likely been abandoned or are not viable for beaver survival during HBL winters. The validity of this assumption should be examined in future studies that measure direct indicators of colony presence, such as the construction of winter food caches.
Another requirement of the current technique is that beaver dams must be comprehensively mapped using high resolution aerial or commercial satellite imagery, and evidence of remnant dams must persist for several decades (e.g. Johnston 2015, Karran et al 2018) if long-dormant beaver ponds are also to be identified. Manual identification of dams performed in this study is time-consuming and not practical for very large regions. A promising solution for this is automated identification of beaver dams in high resolution imagery using convolutional deep learning models (Fairfax et al 2023) that also are trained to identify remnant dams.
5. Summary and conclusions
In this study we demonstrated that a satellite-based, sub-pixel surface water mapping technique and knowledge of beaver dam distribution can be used to measure regional-scale, annual changes in beaver ponding that have occurred from 1985–2021. While only an indicator of beaver populations, ponding dynamics can provide new information on beaver activity over vast, remote regions that are not easily monitored using conventional survey methods. We found that beaver ponding in the high subarctic HBL—lying near the northern range limit of beavers—demonstrated gradual yet large (>80%) long-term changes. Some hypotheses for the drivers of these changes were explored using available environmental datasets and a Landsat-based measure of regional wetness. This led to a conclusion that regional variability in wetness and streamflow, likely in combination with cold temperatures, are important factors affecting beaver populations and ponding in this region.
Acknowledgments
We thank Morgan McFarlane-Winchester (Natural Resources Canada) for assistance with GIS processing and graphics, Christa Law and Chunlong Li (Manitoba Wildlife Branch) for searching archival materials related to beavers in Manitoba, Julie Lovitt (Natural Resources Canada) for help with WorldView data acquisition, Dane Lafreniere (Wings over Kississing) for his skillful piloting during the photo survey, and Jean Thie (EcoInformatics International) for sharing knowledge about beaver engineering in Canada. Helpful reviews were provided by Richard Fernandes (Natural Resources Canada), Don Fraser, and two peer reviewers. The Northwest Territories Centre for Geomatics provided a Google Earth Engine script that was used to calculate Landsat linear Tasseled Cap trends. Funding for this project was provided by the Earth Observation for Cumulative Effects project that is part of Natural Resources Canada's Status and Trends Program.
Data availability statement
The data that support the findings of this study are available upon reasonable request from the authors.
Conflict of interest
The authors do not declare any conflict of interest.
Ethics statement
This research did not involve human or animal participants.
Supplementary data (4.4 MB PDF)
Supplementary data (2.7 MB GIF)