

Abstract
In the 20th century, with the intensification of human activities, the Earth is experiencing unprecedented warming. However, there are certain differences in the sensitivity of temperature changes to anthropogenic forcings in different regions and at different altitudes of the troposphere. The time of emergence (TOE) is the key point at which the anthropogenic climate change signal exceeds from the internal climate variability serving as a noise. It is a crucial variable for climate change detection, climate prediction and risk assessment. Here, we systematically analyzed the spatiotemporal characteristics of the TOE of temperature changes over the past century by calculating the SNR based on the selected CMIP6 multi-model outputs. The results show that the temperature TOE, particularly in the lower and middle troposphere, shows distinct latitude dependence, displaying an 'M-type' distribution from the Antarctic to the Arctic: it first appears in low-latitudes, followed by high-latitudes, and last appears in the two mid latitude bands. For the tropics, the TOE of tropospheric temperatures becomes earlier with increasing altitude: the TOE of air temperatures at the surface, mid-tropospheric 500 hPa and upper-tropospheric 200 hPa occurs in 1980 ± 15, 1965 ± 20, and 1930 ± 30, respectively. The TOEs of tropospheric temperatures in eastern equatorial Pacific are 10–30 years later than those in the western equatorial Pacific. For the regional TOEs of surface air temperature diverse differences exist on land and ocean in various latitudes of two hemispheres.
Export citation and abstract BibTeX RIS

Original content from this work may be used under the terms of the Creative Commons Attribution 4.0 license. Any further distribution of this work must maintain attribution to the author(s) and the title of the work, journal citation and DOI.
1. Introduction
Since the industrial revolution, the atmospheric concentration of CO2 has risen rapidly, exceeding 410 ppm today, the highest level in the past 2 million years (Connors et al 2022). Earlier climate modeling study (Manabe and Wetheral 1967) suggested that doubling CO2 level could cause a 2 °C–3 °C increase in atmospheric temperature. Currently, the global mean surface temperature has already risen by more than 1 °C relative to the pre-industrial period (Allen et al 2018). Previous studies attributed the global warming over the past century mainly to the increasing anthropogenic greenhouse gas emissions (Bindoff et al 2013, Haustein et al 2017, Gillett et al 2021). The latest IPCC Assessment Report (Eyring et al 2021) confirmed.
While most regions globally have presented an overall warming trend throughout the 20th century (Jones et al 1999, Solomon et al 2007), the contemporary climate warming trend varies spatially. Higher latitudes generally experienced more significant surface temperature increases than lower latitudes (England et al 2021, Rantanen et al 2022), with land warming surpassing ocean warming (Karoly and Wu 2005, Joshi et al 2008, Dong et al 2009). High-elevation regions like the Tibetan Plateau exhibited more pronounced warming than low-elevation areas at the same latitudes (Liu and Chen 2000, Pepin et al 2015). Regarding variations of atmospheric temperature in the whole troposphere, satellite observations indicated that temperature changes at the upper troposphere in the tropics exceeded those at the surface (Fu et al 2004, Santer et al 2005). More generally, the warming trend in the troposphere intensified with altitude in the tropics, with greater warming observed at higher altitudes than at the surface (Fu et al 2011, Mitchell et al 2013). Numerous modeling results from early atmospheric global circulation models (Manabe and Wetherald 1975) and state-of-the-art coupled atmosphere-ocean climate models (Vallis et al 2015, Santer et al 2017) consistently indicated that the warming in the tropical upper troposphere surpassed that in the lower troposphere, with the maximum warming occurring at approximately 200 hPa.
The global mean temperature change over the past century displayed non-monotonic warming, with notable multi-decadal fluctuations (Kosaka and Xie 2016, Dong and McPhaden 2017). Previous studies (Tett et al 1999, Stott et al 2000, Medhaug et al 2017) revealed that external forcings, including anthropogenic forcings and natural forcings contributed to the long-term trend in global mean surface temperature over the 20th century. Additionally, interdecadal variations in surface temperature were influenced by internal climate variability (such as the Interdecadal Pacific Oscillation, IPO, e.g. England et al 2014, Dai et al 2015, Meehl et al 2016 and the Atlantic Multidecadal Oscillation, AMO, e.g. Steinman et al 2015, Chen and Tung 2018, Wei et al 2019). At the multi-decadal scale, the internal climate variability and anthropogenic forcing are two major factors affecting climate change (Hulme et al 1999, Deser et al 2012a). By quantifying the signal-to-noise ratio (SNR) of the 'signal' (climate changes induced by the anthropogenic radiative forcing) relative to the 'noise' (internal climate variability), the time of emergence (TOE) method is increasingly being used to detect anthropogenic climate changes regionally (Hawkins and Sutton 2012). The TOE can not only clarify when climate change occurred in different regions in the past and identify regions affected by anthropogenic global warming, but it can also predict the timing of future climate change. It serves as a key indicator for conducting risk assessments and proposing adaptation strategies for future climate projections (Estrada et al 2021).
The TOE for various climate variables has been extensively studied over the past, including global annual mean air temperature (Chen et al 2021, Im et al 2021), seasonal mean air temperature (Mahlstein et al 2011, 2012, Deser et al 2016, Lehner et al 2017), annual mean precipitation (Zhang and Delworth 2018), seasonal mean precipitation (Chen et al 2021), GHGs-forced precipitation change hotspots (PSPOTs) (Giorgi and Bi 2009), and extreme climate indices (Fischer and Knutti 2014, King et al 2015). Surface temperature TOE patterns are inconsistent with warming patterns (Mahlstein et al 2012), in certain latitudes with the smaller (larger) signal probably exhibiting the earlier (later) TOE. However, several results are still somewhat different (Hawkins and Sutton 2012, King et al 2015, Chen et al 2021) due to the variations in signal and noise calculation methodologies, thresholds of SNR, and emission scenarios. The estimation of TOE is also subject to model parameterizations, statistical tests for the robustness, and the uncertainties of internal climate variability (Tebaldi and Knutti 2007, Hawkins and Sutton 2009, Deser et al 2012b, Lehner et al 2017). On the other hand, Santer et al (2019) examined the detection times in temperatures in the lower stratosphere and the troposphere for the globe, Northern Hemisphere (NH) and Southern Hemisphere (SH), suggesting that the global detection time in the lower stratosphere is earlier than troposphere. Whether TOE patterns for tropospheric temperature at different altitudes are consistent with global warming remains unknown, and few research has systematically analyzed the temporal and spatial differences in the TOE of air temperatures. In this study, we assess the spatial and temporal variations in the annual mean temperature TOE using multivariate statistical methods and to evaluate physical processes for these variations based on selected CMIP6 model outputs.
2. Data and methods
For simulated temperatures, we utilized monthly mean sea surface, surface air, 500 hPa and 200 hPa temperatures stem from the ensemble member (r1i1p1f1) of pre-industrial (piControl, ⩾500 years) and historical (1850–2014) experiments by 11 atmosphere-ocean general circulation models (AOGCMs) (table S1 in supplementary information part I) in CMIP6 (Eyring et al 2016). For observed temperatures, two monthly mean temperatures were used: (1) SSTs in National Oceanic and Atmospheric Administration Extended Reconstruction Sea Surface air temperatures Version 5 (ERSSTv5, 2° × 2°, 1854–2014, Huang et al 2017). (2) Tropospheric temperatures, including surface, 500 hPa, and 200 hPa temperatures in the fifth generation ECMWF atmospheric reanalysis of the global climate (ERA5, 0.25° × 0.25°, 1959–2014, Hersbach et al 2020). All model outputs as well as observed data were bilinearly interpolated into 1° × 1° resolution. Additionally, all monthly means were converted to annual means, calculated from January to December.
The Taylor Skill (TS) Score, which served as a metric for comprehensive evaluation of climate model simulation performance (Taylor 2001, Wang et al 2018), was used in this study to determine the extent to which simulations closely approximate actual observations (supplementary information part II). Based on the TS scores of 11 AOGCMs, 8 models were selected for the following multi-model ensemble mean (MEM) analysis. More information for model selection is provided in supplementary information part I.
Consistent with Hawkins and Sutton (2012), we initially calculated the SNR by estimating the signal and noise for temperatures and then identified the TOE for grid. To obtain the signal of annual mean temperature at a specific model grid point, we fitted the global annual mean temperature change sequence to a fourth order polynomial G(t) (t, time) to capture the long-term trend, and finally obtained the signal S(x,y,t) for each model. The annual mean temperature change (1850–2014) at grid point (x,y) is relative to the mean during the reference period (1850–1899), which served as a proxy for pre-industrial period.

Here, α represents the regression coefficient, indicating the response of the annual mean temperature at grid point (x,y) to global warming, and β is the intercept. The noise, i.e. the standard deviation of the annual mean temperature at each grid, using the piControl simulations (Stocker et al 2014). Finally, the first year in which the grid signal consistently exceeds the noise was identified as the TOE. The MEM TOE was calculated based on MEM signal and noise. The observed grid-point SST signal is relative to 1854–1899 mean and noise is derived by subtracting grid point SST series from signals. We used the bootstrap percentile method to evaluate the robustness of MEM TOE (supplementary information part III).
3. Results
3.1. TOE of tropical sea surface temperature
To demonstrate the simulating ability of MEM TOE, its comparison with the observation is essential. The MEMs of annual mean SST signal, noise, SNR and TOE spatial patterns respectively resemble those in observations. Both show pronounced warming signals (figures 1(a) and (b)) but relatively higher noise in the eastern equatorial Pacific (figures 1(c) and (d)). Thus, the corresponding TOE is delayed (emerging after 2000) in comparison with other tropical regions where TOE occurs around the 1970s or 1980s (figures 1(g) and (h)). These regional differences indicate that the magnitude of noise significantly affects the TOE. Furthermore, the SNR (figures 1(e) and (f)) is in good agreement with TOE spatially, with regions exhibiting a larger SNR showing earlier TOE.

Figure 1. Annual mean SST signals (°C), noise (°C), signal-to-noise ratio and TOE (first-to-fourth row) based on observations (a), (c), (e), (g) and MEM (b), (d), (f), (h) in the tropics over 1854–2014.
Download figure:
Standard image High-resolution image3.2. TOEs of tropospheric temperatures
Given the consistence between MEM and observation TOEs of tropical SSTs, we further investigated the MEM signal, noise, and TOE of tropospheric temperatures. The signal patterns at different levels mirror the corresponding warming trends. The signal varies distinctly across different altitudes. For surface air temperature, land shows a more pronounced warming signal than ocean at the same latitudes, particularly in the NH high latitudes where the changes are more intense (figure 2(f)). Low-to-mid latitudes of the SH have larger signals in the mid-tropospheric 500 hPa temperature (figure 2(e)). The upper-tropospheric 200 hPa temperature displays the most noticeable warming trend in the tropics and a cooling trend in the SH high latitudes (figure 2(a)). The noise (figures 2(g)–(i)) exhibits a certain degree of polar amplification, indicating significantly higher internal climate variability in mid-to-high latitudes than that in the tropics.
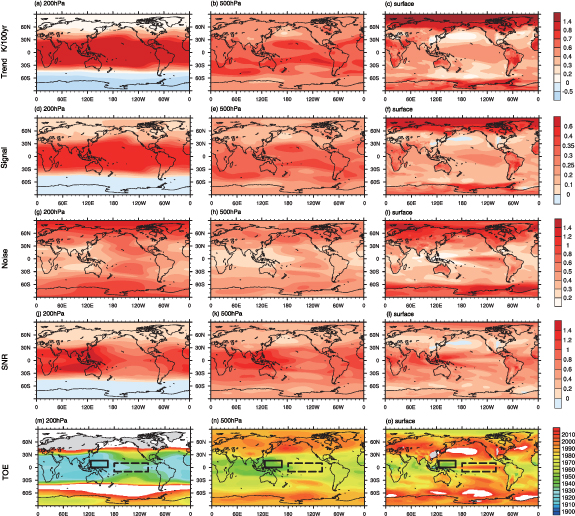
Figure 2. Global distributions of linear trends (K/100 yr), signals (°C), noise (°C), signal-to-noise ratio and TOE (first-to-fifth row) of annual mean temperature changes at 200 hPa (a), (d), (g), (j), (m), 500 hPa (b), (e), (h), (k), (n), and the surface (c), (f), (i), (l), (o), based on the MEM over 1850–2014. In panels (m), (n), and (o), solid and dashed boxes refer to WEP and EEP regions, respectively. For details, refer to section 3.4 in the main text.
Download figure:
Standard image High-resolution imageConsistent with SST SNR and TOE pattern, large SNRs for temperatures in the tropics always result in early TOE. For surface air temperature, the strong noise level (figure 2(i)) in the NH high-latitudes results in a delayed TOE (emerging after 1970) compared to the tropics (figure 2(o)). Conversely, despite the tropics displaying relatively smaller warming signals (figure 2(f)), they experience greater temperature changes relative to interannual noise compared to other regions, resulting an earlier TOE, commencing around 1940. The comparatively lower warming signals and higher interannual noise lead later TOEs in the mid-latitudes. Our observational analysis (supplementary information part IV) reveals earlier TOE in the tropics, aligning with Mahlstein et al (2012). However, the observational TOE in high-latitudes is later than that in the simulations. This discrepancy may be attributed to the sparser and possibly less accurate observational records in high-latitudes, necessitating further research.
Due to various reasons, previous studies showed some differences and similarities in the obtained surface air temperature TOE with this study. For example, there is a 40–60 year lag in the global temperature TOE from Hawkins and Sutton (2012) compared to our result, highlighting the impact of different baseline periods and emission scenarios. King et al (2015) applied the Kolmogorov–Smirnov (KS-) test revealed that the earliest TOE in tropical Africa and Indonesia emerged in the 1940s, which is consistent with ours. However, the different reference period in the KS-test (Mahlstein et al 2012) may lead different first emergences in the tropics. Chen et al (2021) distinguished anthropogenic climate change from internal climate variability and found that the TOE in tropics emerged around 1970s, which is later than ours. Christensen et al (2007) defined the change (internal variability) in 20 year means of annual mean temperature as the signal (noise). Despite the various calculations, the latitudinal distribution of TOE generally remains consistent with our results.
Our analysis (figures 2(m)–(o)) reveals TOE differences exist in different levels based on the SNR by Hansen et al (1988). We highlight lower and mid tropospheric 500 hPa temperature TOE in the tropics (around 1960s–1980s) occurs 30–50 years later than that in the upper tropospheric 200 hPa (around 1930s). The tropics exhibit more notable warming signals in the upper troposphere (figures 2(d)–(f)), which may be responsible for TOE variations with altitudes over the tropics in the troposphere.
The warming signals are largely driven by surface warming patterns, which is also related to the water vapor and lapse rate feedback (Soden and Held 2006, Po-Chedley et al 2018). In the tropics, the vertical temperature profile is predominantly determined by radiative-convective equilibrium. External forcings-induced surface temperature increasing leads to higher water vapor in the atmosphere, trapping more longwave radiation and enhancing radiative forcing at the top of atmosphere (Held and Soden 2000, Soden and Held 2006). Changes in the vertical lapse rate along with warming and increased tropical water vapor transport into the upper troposphere, releasing latent heat and causing greater upper atmospheric warming (Sherwood et al 2010). The warming intensifies the emission of longwave radiation to space, leading to a negative lapse rate feedback in the tropics (Colman 2001, Bony et al 2006), moderating global temperature changes under climate forcing. Despite some offsetting effects, the net feedback remains positive (Colman 2001, Bony et al 2006, Soden and Held 2006), resulting in greater warming signals at higher levels than at lower levels.
3.3. Zonal mean temperature TOE
Given that TOE of different-altitude tropospheric temperatures shows a certain latitudinal dependency, we presented the zonal mean temperature TOE variations with latitude for each 10-degree interval (figure 3). The MEM TOEs at different levels reveal that the earliest TOE occurs in the tropics, where temperature signals emerge around the 1930–1980s, consistently followed by higher latitudes in the 1990 s, and the latest in mid-latitudes in the 2000s. The TOE latitude variation of 500 hPa and surface air temperature approximately displays an 'M-type' pattern from the South Pole to the North. Sequentially, TOE emerges in the tropics, high-latitudes, and mid-latitudes. Also, there are differences between models lead to some uncertainties in the altitude-dependency TOE in the tropics. For instance, the TOE range for surface air temperature in the tropics falls in 1980 ± 15, while it occurs in 1965 ± 20 for 500 hPa temperature and 1930 ± 30 for 200 hPa temperature. Unlike the tropics, mid-to-high latitudes do not show the altitude-dependency TOE in tropospheric temperatures.
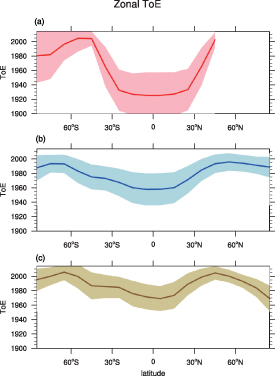
Figure 3. Variations of zonal mean tropospheric temperature TOEs with latitude for 200 hPa (a), 500 hPa (b) and the surface (c), with standard deviations in shading.
Download figure:
Standard image High-resolution image3.4. TOEs in regions with significant temperature changes in tropical oceans
As mentioned above, both observational evidence and model simulations indicate that the annual mean SST signals reflecting tropical warming emerge earlier in most equatorial Pacific regions, with the latest TOE occurring in the eastern Pacific, which is also noted by Ying et al (2022). To further investigate the contrasting features in the equatorial Pacific, we selected the western equatorial Pacific (WEP) (0–16° N, 125–165° E) and the eastern equatorial Pacific (EEP) (10° S–10° N, 180° W–100° W) as two representative regions (figure 2(o)) and showed the regional mean MEM signal and noise sequences of the temperature change at different levels (figure 4). When the signal and noise curves intersect and the former is always greater than latter, the year corresponding to the intersection point is designated as the regional TOE. Consistent with tropospheric temperature TOEs in the tropics, WEP and EEP show that 200 hPa temperature TOE is the earliest (1920–30s, figures 4(a) and (b)), surface air temperature is the latest (1960–90s, figures 4(e) and (f)), and 500 hPa temperature occurs between the two (1950–70s, figures 4(c) and (d)). The TOEs in WEP are generally 10–30 years earlier than those in EEP due to its greater noise. The robustness and uncertainty of the regional MEM TOE are in supplementary information part III.
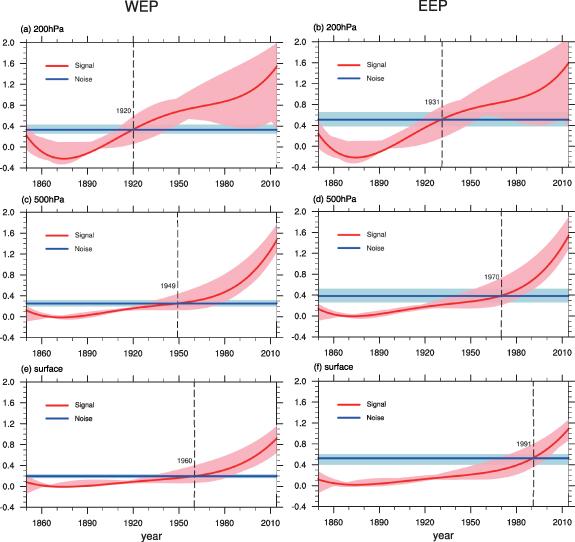
Figure 4. Signal (°C) and Noise (°C) sequences of annual mean temperature changes for the Western Equatorial Pacific (WEP, left) and Eastern Equatorial Pacific (EEP, right) at 200 hPa, 500 hPa, and surface based on the MEM over 1850–2014, with standard deviations in shading.
Download figure:
Standard image High-resolution image3.5. Surface air temperature TOEs in three major economies of the world
China, the European Union including 27 countries (EU27) and the United States (US) (figure 5(a)), as the three largest economies in the world, contributed to major global carbon emissions (Friedlingstein et al 2022, United Nations Statistics Division 2022). These three regions exhibited significant differences in the start timing of massive local carbon emissions. Since the early 19th century, the U.S. and the EU27 were significant contributors to CO2 emissions (figures 5(b) and (c)). The emissions of the EU27 peaked in the 1860s, maintaining until the late 19th century, before declining. In contrast, the U.S. peaked in the 1940s. Subsequently, China was a noteworthy contributor to CO2 emissions (figure 5(d)), with this upward trajectory persisting (Ritchie et al 2020). However, as shown in figures 5(e)–(g), the surface air temperature TOE in three economies showed consistency in the TOEs (the early 21st century). Notably, the U.S. and the EU27 exhibited strong warming but larger noise compared to China, resulting in similar TOEs (figures 5(e)–(g)). Analysis of the Detection and Attribution Model Intercomparison Project (DAMIP) single greenhouse gases (GHG) forcing only experiments (Gillett et al 2016) revealed earlier TOE over globe than all forcing-induced TOE (supplementary information part V). Three economic regions showed 20–30 year earlier TOE in GHG only experiment in comparison with those estimated in CMIP6 historical experiments. The latter TOEs in historical simulations than those in GHG only simulations are due to the fact that GHG induced warming are partially offset by the local aerosol induced cooling (Duan et al 2019). Regions at the same latitude demonstrated a consistent TOE of surface air temperatures, irrespective of variations in the initiation and peak timing of regional carbon emissions.
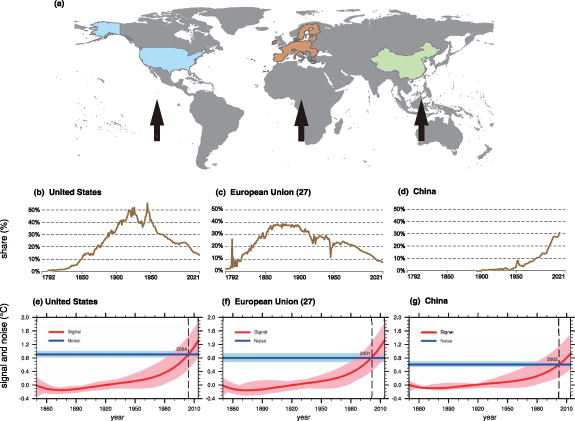
Figure 5. Locations (a), share of global CO2 emissions ((b)–(d), the sum of CO2 emissions from fossil fuels and industry (1792–2021), excluding land use change; figure source (Ritchie et al 2020) and data source (Friedlingstein et al 2022): Global Carbon Budget (GCB)), and surface air temperature signals (°C) and noise (°C, (e)–(g)) of the three largest economies (US, EU27 and China).
Download figure:
Standard image High-resolution image3.6. Surface air temperature TOE in land and ocean at various latitudes in the Northern and Southern Hemispheres
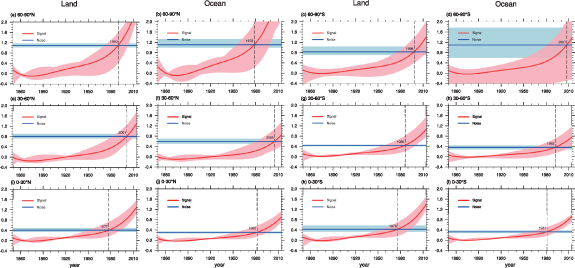
Divergences in the TOEs are evident both between ocean and land at the same latitudes and across the various latitudes within the Northern (NH) and Southern (SH) Hemispheres. For the differences between ocean and land, the land–ocean warming contrast driven by more rapid surface air temperature increase over land than the ocean (Joshi et al 2008, Dong et al 2009), results in earlier TOE in land at all latitudes except for the ocean at high latitudes in the NH. It is related to amplified Arctic warming (England et al 2021, Rantanen et al 2022), resulting in a larger signal in the NH high-latitude ocean (figures 6(a) and (b)). The SH high-latitude land and ocean (figures 6(c) and (d)) show similar signals, but TOEs are later over the ocean due to greater noise. The mid- and low-latitude lands in the NH and SH experience larger warming and relative larger noise, leading to earlier TOE. For the north–south differences across the various latitudes within the two hemispheres, the signal, noise and TOE in the low latitudes (figures 6(i)–(l)) are relatively similar, while the TOE in the SH middle latitudes (figures 6(g) and (h)) is earlier than that in the NH (figures 6(e) and (f)) due to lower noise in the former. Additionally, the signal in the NH high latitudes is significantly greater than that in the SH (figures 2(f) and 6(a)–(d)), resulting in an earlier TOE in the NH high latitudes. To assess the robustness of regional TOEs over different latitude bands over land and ocean, we estimated years of TOEs in those regions for each model (results not shown). All models indicate an earlier TOE over ocean than over land for the NH high-latitude. In other latitude band regions, only one model gives opposite TOE contrast between land and ocean in comparison with those in other models and MEM. These results indicate robust estimation of land–ocean contrast among different models.
Figure 6. Signal (°C) and Noise (°C) sequences (1850–2014) of annual mean surface air temperature changes for the northern hemisphere land, ocean area and southern hemisphere land and ocean area (first-to-fourth column), in three latitude bands of high latitudes (top), mid-latitudes (middle), and the tropics and subtropics (bottom) with the shade as the standard deviation.
Download figure:
Standard image High-resolution image
4. Conclusion and discussion
Based on the CMIP6 multi-model simulated air temperatures since the industrial revolution, we defined the TOE as the first year in which the SNR consistently exceeds the threshold value of 1. We systematically analyzed the spatiotemporal characteristics of the TOE for temperature changes, especially differences in different levels in the troposphere and over different regions. The main conclusions are summarized as follows:
- (1)Zonal means demonstrate the earliest TOEs for temperatures at different levels occur in the tropics, the latest in the mid-latitudes, and the variations in TOE from Antarctica to the Arctic exhibit an 'M-type' pattern, especially in the lower and middle troposphere.
- (2)Subject to the feedback effects of the temperature lapse rate change and deep convection changes in response to anthropogenic forcings, the signal in the tropical troposphere generally increases with altitude, the TOE becomes earlier there. Both the eastern and western equatorial Pacific regional TOEs emerge the earliest (1920–30s) for upper tropospheric temperature, followed by mid-tropospheric temperature (1950–70s), latest for surface air temperature (1960–90s). Western equatorial Pacific regional TOE is earlier, probably due to the larger internal climate variability in the eastern equatorial Pacific region influenced by ENSO.
- (3)For surface air temperature TOEs, there are some similarities in different countries and differences between oceans and lands at various latitudes. The three regions with large economy and carbon emissions—the EU27, the U.S. and China exhibit similar TOEs mainly due to that GHG induced warming are partially offset by the local aerosol induced cooling. The differences in TOE across ocean and land at the same latitudes, as well as between the two hemispheres at various latitudes, are influenced by anthropogenic forcings and regional climate dynamics. Aside from the high-latitude oceans in the NH where the surface air temperature TOE precedes that of lands, the TOE of lands at other latitudes consistently precedes that of oceans. In the low latitudes, both land and ocean exhibit relatively similar signal, noise, and TOE. In the mid-latitudes, TOE occurs earlier in the SH, attributed to lower noise. In contrast, the NH high latitudes display significantly greater signal intensity compared to SH, resulting in an earlier TOE.
The tropospheric temperature TOE in the tropics was the earliest compared to mid-and high-latitudes and became earlier with increasing altitude in the troposphere. Inconsistent with the decrease in SNR with increasing of the latitude (Hansen et al 1988), TOE follows an 'M-type' distribution with latitude between the South and North Poles. Differing from recent study (Santer et al 2019) reporting a close detection time in the lower and mid-to-high troposphere, we propose that in the tropics, the TOE of temperature advances with increasing altitude. The vertical profile of temperature change is an important fingerprint of climate change (Santer et al 2013). The earlier emergence of the TOE in the upper tropospheric temperatures may serve as an early warning signal and is of great significance in the context of global warming. Accurately estimating the tropospheric temperature TOEs in the tropics helps to understand the sensitivity of the tropical climate system to anthropogenic forcing. It is also crucial for studying climate feedback mechanisms like water vapor (Minschwaner and Dessler 2004), lapse rate (Keil et al 2021) and cloud (Saint-Lu et al 2020) feedbacks, which can either amplify or dampen the warming effect and are vital in projecting future climate. Changes in tropical tropospheric temperatures and associated meridional temperature gradient affect weather patterns far beyond the tropics, e.g. the pronounced warming in the tropical upper troposphere may drive the poleward shift of the jet streams (Lorenz and DeWeaver 2007, Archer and Caldeira 2008, Rivière 2011, Woollings et al 2023). Previous research also indicated that storm tracks typically migrate poleward with rising radiative equilibrium temperature and increased tropical convective stability (Mbengue and Schneider 2013).
There are notable regional TOE differences in the tropics. The east and west equatorial Pacific exhibit a 'seesaw' pattern in SST and thermocline depth, which is characteristic of the strongest ocean-atmosphere coupling process known as El Niño-Southern Oscillation (ENSO) (Tsonis et al 2003, McPhaden et al 2006, Wang 2018). We revealed difference between two regional tropospheric temperature TOE. Specifically, the TOE occurs 10–30 years earlier in the warm pool than that in the cold tongue. The possible causes of this phenomenon are as follows: Weller et al (2016) and Bai et al (2022) detected the influence of human activities in the rapid warming and expansion in the Indo-Pacific Warm Pool (IPWP) using the optimal fingerprinting method. During the warming process of the warm pool, SST anomalies have been shown to impact the ENSO cycle (Wang et al 1999). Previous studies showed that the formation of ENSO is closely related to the anomalous thermal state of the western Pacific warm pool (Clarke et al 2000, Solomon and Jin 2005), especially to the eastward expansion of the warm water in the warm pool (McPhaden and Picaut 1990). The frequency of central Pacific El Niño events (Kao and Yu 2009, Kug et al 2009, Lee and McPhaden 2010, Freund et al 2019) as well as extreme La Niña occurrences have gradually increased in recent decades (Cai et al 2015, Dieppois et al 2021). Reconstructions of paleo-ENSO also indicated that ENSO activity was significantly stronger in the twentieth century than in previous centuries (Li et al 2013, McGregor et al 2013). The EEP have shown higher interannual variability than WEP (Wang et al 2017, Hawkins et al 2020). Consequently, there are regional differences in the internal climate variability across the equatorial Pacific, with a delayed emergence in the eastern equatorial Pacific compared to the western.
Acknowledgments
This study was supported by the National Natural Science Foundation of China (41991254), the Strategic Priority Research Program of the Chinese Academy of Sciences (XDB40030100), and the Fund of Shandong Province (LSKJ202203300). We acknowledge the World Climate Research Programme's Working Group on Coupled Modelling, which is responsible for CMIP, and the climate modelling groups for producing and making available their model output.
Data availability statement
The data that support the findings of this study are openly available at the following URL/DOI: the CMIP6 data (https://esgf-node.llnl.gov/search/cmip6/), the ERA5 reanalysis data (www.ecmwf.int/en/forecasts/datasets/reanalysis-datasets/era5) and the ERSSTv5 (NOAA) data (https://climatedataguide.ucar.edu/climate-data/sst-data-noaa-extended-reconstruction-ssts-version-5-ersstv5).
Conflict of interest
The authors declare no competing interests.
Supplementary data (0.9 MB PDF)