

Abstract
Ride-hailing has expanded substantially around the globe over the last decade and is likely to be an integral part of future transportation systems. We perform a systematic review of the literature on energy and environmental impacts of ride-hailing. In general, empirical papers find that ride-hailing has increased congestion, vehicle miles traveled, and emissions. However, theoretical papers overwhelmingly point to the potential for energy and emissions reductions in a future with increased electrification and pooling. Future research addressing the gap between observed and predicted impacts is warranted.
Export citation and abstract BibTeX RIS

Original content from this work may be used under the terms of the Creative Commons Attribution 4.0 license. Any further distribution of this work must maintain attribution to the author(s) and the title of the work, journal citation and DOI.
Abbreviations
| VMT | vehicle miles traveled |
| VKT | vehicle kilometers traveled |
| TNC | transportation network company |
| DiD | difference-in-difference |
| EV | electric vehicle |
1. Introduction
Ride-hailing 3 has become a major mode of transit in many countries over the last decade, as new companies have entered the market and ridership has grown. Uber, which started in 2009, is now present in 10 000 cities worldwide 4 . Ola, founded in India in 2010, is available in over 200 cities 5 . DiDi Chuxing, which launched in China in 2012, now serves over 550 million riders in 16 countries 6 .
However, limited evidence exists on the impact of ride-hailing on energy use and the environment, and the studies that do exist are mixed. For example, while some studies have shown that ride-hailing has replaced public transportation market share to a certain extent [1], others have shown that ride-hailing have increased public transit use in certain contexts [2, 3] due to it helping solve the 'last mile' problem [4]. Ride-hailing could also impact energy use and emissions due to changes in ridership patterns, increased accessibility, changes in vehicle miles traveled (VMT), and changes in vehicle ownership. Hence impacts of ride-hailing on gasoline consumption are not obvious.
As ridership continues to increase globally and policy frameworks are developed for new transportation systems, it will be more important than ever to understand the impacts of ride-hailing. For example, fleets are expected to eventually become autonomous and driverless, substantially lowering per mile costs [5]. This could increase accessibility, ridership, and VMT, thereby increasing emissions. On the other hand, fleet electrification and pooling (i.e. sharing a ride with one or more passengers with different pick up and destination locations) could reduce emissions.
This study performs a systematic review of the existing literature on the environmental and energy impacts of ride-hailing. The goal is to better understand both the current state of ride-hailing, as well as how the future of ride-hailing may evolve. Using the systematic review methodology, we provide a comprehensive review of the relevant literature while minimizing bias in selection of studies to be reviewed [6], and synthesize the evidence.
2. Methodology
Our primary research question is:
- What are the energy and environmental impacts of ride-hailing?
Our secondary research question is:
- How will electrification, sharing (pooling), and automation affect energy and environmental impacts of ride-hailing?
In terms of our primary research question, there are various intermediate impacts of ride-hailing that could affect energy and environmental outcomes. First, ride-hailing offers an alternative modal choice. For example, as more people participate in ride-hailing, they could be substituting away from private vehicle ownership (in which case there would be positive environmental benefits) or alternatively away from public transit (in which case there would be negative environmental impacts). Second, if ride-hailing increases the number of automobiles on the road and/or changes traffic patterns, total VMT could increase, thereby potentially also increasing both traffic congestion and emissions (of both local air pollutants and greenhouse gases).
In terms of our secondary research question, transport experts have posited that these three factors (electrification, sharing/pooling, and automation) will jointly determine the sustainability of future transit [7]. Many policy makers around the world have been promoting electric vehicles (EVs) as a 'cleaner' alternative to internal combustion engine vehicles. Potential benefits of fleet electrification include less local air pollution and greenhouse gas emissions, but only to the extent that the electricity is generated from cleaner sources such as natural gas and renewable sources. The extent and pace of electrification of the ride-hailing fleet will be large determinants of the environmental impacts of ride hailing.
Meanwhile, auto makers have been developing ever more automated technologies, including adaptive cruise control and blind-spot assistance, and have begun to introduce self-driving, or fully autonomous, vehicles. Automated technologies may significantly alter drivers' and riders' travel behavior and usage patterns. For example, some experts are concerned that the convenience and eventual lower cost of ride-hailing self-driving cars will lead to large increases in miles traveled by cars, which could significantly increase energy use and pollution [7]. The sharing or pooling of rides, on the other hand, can temper increases in ride-hailing usage and miles driven, as passengers share one vehicle for (at least some segment of) their rides, reducing the number of ride-hailing vehicles needed to meet demand.
To answer these research questions, we employ the 'systematic review' methodology [6, 8]. By systematically searching the literature and applying precise criteria to determine inclusion of sources in the review, this methodology reduces unintentional bias (e.g. excessive citations of oneself or those in one's network) and reduces the likelihood of omitting relevant studies, relative to traditional literature reviews [6].
We applied our search to two broadly used scientific literature databases- Web of Science 7 and Scopus. To search for relevant grey literature, we also performed a 'secondary' search in Scopus to capture sources such as working papers or conference presentations that may not be fully indexed, and applied our search to WorldCat Dissertations to find relevant dissertations. First, we identified search terms to find sources relevant to our primary research question. Our search terms, which we developed iteratively, included 'ride hailing' or a synonym for 'ride hailing' (e.g. 'ride sourcing,' 'ride sharing') or a ride hailing company (e.g. 'Lyft,' 'Uber,' 'DiDi Chuxing'), plus an environmental or energy impact (e.g. 'gasoline consumption,' 'energy efficiency,' 'VMT,' 'public transport,' 'emissions'). These impacts could be direct (e.g. changes in air pollution) or indirect (e.g. decrease use of public transportation). We combined synonyms and various spellings of these terms using Booleans. Our full search strings can be found in the Supplementary Information.
We searched titles, abstracts, and keywords of sources on the three databases using the search string, which can be found in the
Table 1. Summary of search results.
| Number of results | |
|---|---|
| Academic literature | |
| Scopus | 3090 |
| Web of Science Core Collection | 2013 |
| Grey literaturea | |
| Scopus secondary | 691 |
| WorldCat Dissertations | 24 |
| Total | 5818 |
| Duplicates | 1690 |
| Total excluding duplicates | 4128 |
a While our grey literature searches cover conference abstracts and working papers, they do not cover all types of grey literature such as newsletters and government documents.
We followed the methodological guidelines of [9] and used their free online platform, CADIMA, to automatically detect duplicate citations, perform the screening, and document the entire process. We developed the following inclusion criteria for screening the results to determine which to include in the review:
- 1.Refers to a quantitative analysis of a ride-hailing market 8
- 2.Refers specifically to an environmental or energy use-related effect of ride-hailing
- 3.Contains primary research results
- 4.Is accessible at the time of review (e.g. may not be because it is behind a paywall or is not published)
Two graduate student research assistants assisted with source screening. First, all three individuals performing screening reviewed a random sample of 100 sources, determining whether each source met each of the four inclusion criteria. This was used as a 'consistency check' to ensure the criteria were interpreted similarly by all screeners. Indeed, there was agreement upon which of the 100 sources met all criteria. Then, the remainder of the sources were screened, with each source being screened by two different people, in order to reduce bias and errors. Finally, inconsistencies were resolved by review and discussion between the screeners. Figure 1 depicts the search and screening process, as well as the number of sources identified to include in the literature review. The Supplementary Information includes a table summarizing the 153 studies identified and selected for this review. Of the 46 studies screened out at the full text stage, 27 did not meet inclusion criteria 2, 22 did not meet inclusion criteria 1, one study was inaccessible, and one study was a duplicate. Of those that did not meet inclusion criteria 2, many of them researched something relevant to environmental or energy outcomes (e.g. cruising, congestion) without actually referring to, linking to, or estimating environmental or energy impacts. Of those that did not meet inclusion criteria 1, many studied carpooling but note ride-hailing.
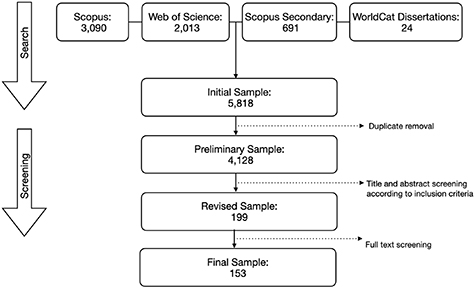
Figure 1. Search and screening process.
Download figure:
Standard image High-resolution image3. Results and discussion
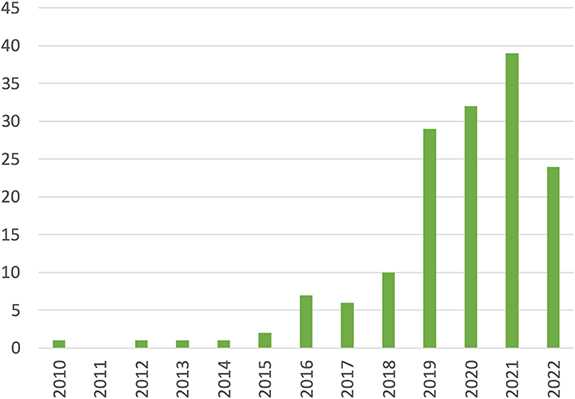
Of the 153 studies identified and selected for inclusion in the review, the vast majority of them were published in the last four years, with very few published prior to 2016. Figure 2 shows the number of sources included by year of study.
Figure 2. Number of sources by year of study.
Download figure:
Standard image High-resolution image
A clear delineation presented itself in the papers reviewed. Eighty-nine are empirical in nature, examining observed impacts (whether direct or indirect) on the environment or energy use. The remaining 64 are theoretical in nature. In other words, just over half of the literature looks at actual or observed impacts of ride-hailing, while just under half explores the potential impact of ride-hailing. Below, we summarize and compare the various methodologies in the reviewed studies. Then, we discuss the findings of the reviewed studies, with the discussion organized around the research questions and topical themes.
3.1. Summary of methodologies in reviewed studies
3.1.1. Theoretical methodologies
The 64 theoretical papers use a diverse set of methods. The most common methods are simulation and optimization. Some rely on machine learning models, principle-agent models, and/or structural economic models. While some quality comparisons of empirical methods (discussed below) can be made based on identification strategies and sample sizes, quality comparisons across the theoretical studies are challenging if not impossible.
3.1.2. Empirical methodologies
3.1.2.1. Causal empirical studies & impacts of transportation network company (TNC) entry
Thirty-nine percent (35) of the empirical papers examining impacts of ride-hailing utilize causal identification methods, with most analyzing the entry of a TNC, such as Uber or DiDi Chuxing, into a market. Of these, the majority (22) utilize a (often staggered) difference-in-difference (DiD) identification strategy. Generally speaking, these are the higher quality empirical studies, given that they are well powered and that they control for other factors and use methods for causal identification. In contrast, most other empirical papers (with the exception of those utilizing choice experiments) involve associational or correlational, not causal, analysis.
3.1.2.2. Surveys and stated preference studies
Just under one third of the empirical papers (25) utilize survey and stated preference methodologies, with 10 employing choice experiments. Stated preference methods allow for quantitative analysis when revealed preference data does not exist or is hard to collect, and choice experiments allow for clean causal identification. However, survey and stated preference methods can be subject to hypothetical bias [10]. Ten of the stated preference studies utilize choice experiments. In most of these, respondents choose their preferred mode of travel (e.g. ride-hailing, private car, transit), where the cost, travel time, and other attributes of the modes vary. The data is usually analyzed by estimating a mixed logit or random parameter logit model. While sample sizes are generally moderate, with 10 studies' sample sizes being between 1000–2000, only five studies have sample sizes larger than 2000. Ten studies have sample sizes of 1000 or less, three of which have sample sizes of 500 or less. These studies are generally not as robust as the causal studies above due to hypothetical bias and limited sample sizes, but are more reliable than associational studies.
3.1.2.3. Other/associational empirical studies
The remaining third of empirical papers (29) do not leverage ride-hailing entry or other events for causal identification, instead providing associational or correlational results. These studies utilize various sources of data, including ridership, GPS trajectory, and national household survey datasets, to investigate the impacts of ride-hailing. Because they are not causal studies, care must be taken in interpretation of results.
3.2. Energy and environmental impacts of ride-hailing
Here we address the primary research question: What are the energy and environmental impacts of ride-hailing? As discussed in section 2, ride-hailing has several potential intermediate impacts that could in turn influence energy use and environmental outcomes. We divide these into two themes: 1) impacts on modal choice, public transit, and vehicle ownership, and 2) impacts on VMT, deadheading, traffic congestion, and emissions. Within each theme, we first discuss related results from the theoretical literature (predicted impacts) and then related results from the empirical literature (actual, observed impacts).
3.2.1. Impacts on modal choice, public transit, and vehicle ownership
Ride-hailing offers another modal choice of transit, which could impact usership of public transit and/or ownership of private vehicles, with opposing implications for gasoline usage and environmental outcomes. If riders substitute away from public transit towards ride-hailing, transportation emissions are likely to increase. However, ride-hailing could also solve the 'last mile' problem, connecting more users to public transit. Therefore, ride-hailing could either be a substitute for public transit. If riders substitute away from private vehicle ownership, the associated change in transportation-related emissions would depend on ride-hailing usage (i.e. how many miles are ridden and what fraction of those are pooled). However, life-cycle emissions from private vehicle ownership would be likely to decrease.
3.2.1.1. Theoretical studies
Theoretical studies show a great potential for ride-hailing, under certain assumptions and with optimization, show a large fraction of private vehicles and private vehicle trips could be replaced by ride-hailing and/or public transit. Deshmukh [11] combine agent-based and travel demand models to simulate various scenarios. They find that under an 'improved' ride-sharing scenario, by 2050 the US national vehicle stock would decline by 1%.
Alemi and Rodier [12] combine MATSim data on commuting time and distance in the San Francisco, CA area with data on ride-hailing and public transportation travel times from Google and BART. They use a dynamic assignment model to identify that 31% of private vehicle commutes could be replaced by a combination of ride-hailing and BART at a lower 'generalized cost' that includes both travel time and monetary costs. They estimate this could avoid over half a million VMT. Ke et al [13] use an analytical model with a numerical case study to examine the relationship between public transit and ride-hailing. They find that the ride-hailing fleet size is an important determinant of whether the relationship is complementary or substitutive.
3.2.1.2. Empirical studies
3.2.1.2.1. Public Transit
Nine papers use a DiD methodology to examine the impact of TNC entry on public transit [2, 14–21], essentially assessing how transit ridership changed between the location where it entered versus a location it did not enter, before versus after entry.
Overall, evidence is mixed. Ward et al [14] find no significant impact of Uber and Lyft entry on transit use in US cities. Similarly [15], find no significant impact of Uber's entry on Colombian urban transit ridership. Li et al [16] find no significant impact of Uber's entry on US cities' transit ridership. However, they find that Uber's entry increased bus ridership in sprawling urban areas, but decreased it in compact urban areas.
Pan and Qiu [17], on the other hand, estimate a significant decline in bus ridership after the entry of Uber into US cities. Babar and Burtch [18] similarly find a 1.3% decrease in bus ridership, though a 3% increase in rail ridership, following Uber's entry. Dhanorkar and Burtch [19] also find evidence of Uber substituting for public transportation in California, though they find it may complement public transit for carpooling users. In a similar vein [20], find that after market entry in US urban areas, Uber reduced transit ridership by 2%–4% in the following four months. However, they find that Uber also led to a 1%–2% increase in ridership by people who used to drive private cars. Grahn et al [22] utilize Uber and Lyft price surge events in Pittsburg, Pennsylvania, as 'treatments' that increase fares. They compare bus ridership changes immediately following price surges to other times of day to determine the increase in bus boardings resulting from higher ride-hailing costs. They assume the treatment effect does not impact travelers not making decisions between the two modes, and they control for community events that might affect demand for both modes by controlling for local and network traffic speeds. They find a substitutionary effect for buses and ride-hailing in four of ten locations, and find that the relationship varies by time of day.
Hall et al [2], however, find the entry of Uber increases US urban public bus and rail ridership by 5% after two years. Shi et al [21] find entry of DiDi Chuxing in Chinese cities reduces bus ridership but increases passenger rail ridership.
Several papers find heterogeneity of impacts, with [14] finding reductions in transit ridership in higher income areas with more childless households, and [2] finding that the increase in ridership is larger in bigger cities, smaller bus transit agencies, and larger rail agencies. Pan and Qiu [17] find the drop in bus ridership is smaller in areas with an older population and larger in areas with higher rates of disability.
Seven additional studies use alternative empirical approaches to evaluate the impact of TNC entry on public transit [23–29]. Pan and Qiu [23] utilize causal estimators to improve upon the standard DiD methodology that does not account for time-varying unobserved cofounders. Their results suggest Uber's entry into US cities resulted in a 7%–8% decrease in bus trips. Diao et al [24] uses fixed effect panel regression models to investigate the impact of Uber and Lyft's entry into US cities. They find that entry decreased public transit ridership by 8.9%.
Ngo et al [25] use a natural experiment of the temporary ban on Uber service in Eugene, Oregon, to estimate the impact of Uber on bus ridership. They find that, relative to control cities and when Uber was banned, bus ridership was 5.4% lower when Uber was active.
Nelson and Sadowsky [26] use a staggered event study to examine the impact of a first TNC (usually Uber) and then a second TNC (usually Lyft) in US urban areas. They find that the first entry increased public transit use on average, but that this effect mostly dissipated after the second entry. While initially ride-hailing may more likely have been used for last mile travel, the prevalence of ride-hailing and decrease in price after the second entry likely led ride-hailing to be a substitute for transit, the authors conclude.
Malalgoda and Lim [27] estimate a fixed effect regression model to find that Uber and Lyft entry increased rail transit ridership in US cities by 7%–22% in 2015–2017 (relative to 2007–2009) but did not significantly impact bus ridership. Erhardt et al [28] estimate a similar model, comparing bus and rail ridership in the San Francisco Bay area in 2010, when ride-hailing was negligible, to 2015, after ride-hailing became common. While they find TNCs caused a 10% decrease in bus ridership, they found no significant impacts on light rail ridership.
Zheng [29] employs a regression discontinuity research design, leveraging Uber's introduction to New York City in 2011 and subsequent suspension of new vehicle license issuance in 2018. The author estimates that Uber's entry to New York City increased public transit trips by 3%.
Studies utilizing choice experiments generally find greater disutility associated with transit than ride-hailing and that while ride-hailing can be a complement to public transit, it is often more of a substitute to public transit. Zhang et al [30] find that in Beijing, when ride-hailing is absent, private vehicle, public transport, and taxi ridership increase by 17%, 10%, and 10%, respectively. Oviedo et al [31] estimate reallocation of modal choice upon introduction of ride-hailing in Bogotá, Columbia, finding roughly one third of public transit trips are shifted to ride-hailing. Half of these are complementary and half substitutionary. The authors find the introduction of ride-hailing increases VKT by 1- to 14-fold. Dong [32] find that in Philadelphia, PA, waiting for transit is 4–5 times costlier to respondents than waiting for ride-hailing. Longer walking time to and from transit also decreases probabilities of choosing transit, with each additional minute reducing odds by 6%–7%. A modest reduction in transit wait time (15%) is almost five times more impactful than a large fare reduction (40%) in increasing respondents' odds of choosing transit. Dong et al [33] find ride-hailing substitutes transit more than complements it in Philadelphia and that ride-hailing allows customers to delay or forgo purchasing a private vehicle. The authors also find the cost of waiting for transit around three times higher than waiting for ride-hailing vehicle. Unlike the above studies [34], find that in the US, the total share of transit is not very sensitive to the introduction of ride-hailing, even as ride-hailing cost decreases, suggesting limited competition between the two modes.
Thirteen papers survey ride-hailing users, either online or in person, and directly ask about alternative travel modes. Tang et al [35] and Yang et al [36] survey frequent DiDi Chuxing users in China, asking which mode they would choose were ride-hailing unavailable. Tang et al [35] finds that more than 35% would have taken a taxi, while 37% would have taken public transit. Over 6% stated they would not purchase a private vehicle if ride-hailing services were permanently available [36]. (which limit their study area to Chengdu) find that over half would have chosen public transit and 27% a taxi. A face to face survey in Chengdu, China, found the highest proportion of respondents would have used public transit, followed by taxi, if ride-hailing were unavailable [37]. The authors also found that ride-hailing increased frequency of trips by almost 17%. Yi and Yan [38] combine DiDi Chuxing ridership data from across China with a survey of riders (co-designed by DiDi Chuxing) and find that roughly a third or riders would have otherwise taken a taxi, and a third the public bus. A similar study using DiDi Chuxing ridership data combined with survey data from Beijing finds that 50% of respondents would have used the subway or a bus and 29% a taxi or private car had ride-hailing not been available [39].
Similar studies focusing on Brazil [40] and Ghana [41] both find that around half of riders would have chosen a taxi, and about a third public transit, were ride-hailing not available. Furthermore, though 70% of the respondents in [40] declared they would be interested in pooling, over a fifth said they would never use UberPool, and over a fifth said they would never share a trip with an unknown passenger. An intercept survey in Boston showed that 41% of riders would have otherwise used public transit and 40% a private vehicle [42]. Surveys at major California airports showed that in 2015, 21% and 30% of travelers who used ride-hailing to get to the San Francisco and Oakland airports, respectively, would have used shared transit (mostly BART) were ride-hailing not an option [43]. An intercept survey in Santiago de Chile also finds ride-hailing replaces public transit (37%) and taxis (39%) the most, with 11 riders substituting public transit for every one rider who combines it with transit [44].
The remaining studies are associational. Wang et al [45] use panel data regression analysis to estimate the relationship between modes of transportation using three waves of a transit survey in Seattle, WA, including travel logs. They find that ride-hailing appears to be a substitute for private vehicle use, but not public transit.
Two studies use the Transportation Tomorrow Survey (TTS) from Toronto with similar methodologies as the National Household Travel Survey (NHTS) papers. Young et al [46] analyze the 2016 TTS data and find that a third of ride-hailing trips 15 min or less have public transit alternatives of a similar duration, but that a quarter of ride-hailing trips would take at least a half hour longer by transit. Loa et al [47] combines the 2016–2018 TTS data with ride-hailing trip data and finds a positive association between ride-hailing and public transit. Li et al [48] estimate panel regression models on detailed ride-hailing trip data from Toronto from 2016 to 2018 to find a positive association between ride-hailing trips and subway ridership, and a negative correlation between these trips and surface transit ridership (i.e. bus and street car).
Ma et al [49] combine DiDi Chuxing trip data for the Beijing–Tianjin–Hebei area with survey data in which respondents indicate their alternative modes of transport to conduct a lifecycle analysis. They find that while ride-hailing does not lead to an increase in travel demand, in Beijing and Tianjin, riders substitute away from the subway and bus, respectively. Kong et al [50] combine DiDi Chuxing data from Chengdu, China, with Baidu Map and Google Distance data to identify that 33% of the DiDi Chuxing trips could potentially be substitutes for public transit.
3.2.1.2.2. Vehicle ownership
Six papers using a DiD strategy to investigate the impact of TNC entry on vehicle ownership [14, 51–55]. Ride-hailing could decrease vehicle ownership if drivers substituted away from private vehicles. Ward et al [51] indeed estimate a 3% decrease in US state-level per-capita vehicle registrations following Uber and Lyft entry. However, in a subsequent city-level analysis [14], estimate an 0.7% increase in vehicle registrations in urban US areas following the entry of Uber and Lyft, with a larger increase in vehicle ownership in 'car-dependent' cities. This is likely due to potential drivers purchasing vehicles. Despite the apparent advantages of ride-hailing drivers using more fuel efficient vehicles, the authors find no significant impact of entry on fuel economy.
Zhong et al [52] find that the entry of Uber and DiDi Chuxing led to decreased ownership of private vehicles in Chinese cities. Specifically, private car ownership declined 11.5% and 4.2% the first and second years after entry, respectively. They also estimate a larger effect in eastern than in western cities. Similarly [53], find that the entry of Gojek and Grab, two ride-hailing companies, into Indonesian cities resulted in a 1.1% decline in per capita vehicle ownership. Wadud and Namala [54] find that Ola and Uber have jointly reduced vehicle ownership in various Indian cities by 7.7% since their introduction.
Paundra et al [55] investigates the entrance of Gojek, Grab, and Uber on province-level Indonesian vehicle registrations. The analysis distinguishes between motorcycle sharing and car sharing. The authors find that the entrance of motorcycle ride-hailing led to a decrease in vehicle registrations, likely because drivers already had their own vehicles. However, the entrance of car ride-hailing services led to an increase in vehicle registrations as prospective drivers invested in new cars.
Two studies use alternative methodologies. Diao et al [24] find no significant impacts of TNC entry on vehicle ownership in the US. Naidu et al [56] performs regression analysis, examining the relationship between GDP and vehicle sales in India before and after the introduction of Ola, finding a weaker relationship in the second period.
3.2.1.2.3. Summary
A few patterns emerge. In the causal studies, ride-hailing appears to be a substitute for some riders, especially bus riders, but a complement for other riders. In particular, ride-hailing seems to solve the 'last mile' problem for some commuters, making public transit, particularly rail, more accessible and convenient. The studies using choice experiments and surveys find evidence of ride-hailing being sometimes a complement but more often a substitute for public transit, with 37%–50% of riders across numerous countries reporting that they would have taken transit if ride-hailing were not available.
The associational studies, on the other hand, find more evidence on the complementarity between ride-hailing and public transit (particularly subway ridership). This could, however, be due to selection in which those who already ride public transit are more likely to also ride-hail. Overall, there is no clear net impact of ride-hailing on public transit usage, and the net impact is likely to vary across regions and types of riders.
As for private vehicle ownership, results for the US are mixed. There does not appear to be a clear reduction in private vehicle ownership as a result of ride-hailing. There is more evidence for substantial reductions in private vehicles in China and Indonesia. However, the entry of ride-hailing in some cases increase vehicle registrations from prospective drivers.
3.2.2. Impacts on VMT, traffic congestion, deadheading, and emissions
If ride-hailing leads to an increase in vehicles on the road or miles traveled, there could be substantial energy and environmental implications. Ride-hailing can impact VMT both through an extensive margin (more users, such as those substituting away from public transit) and an intensive margin (riders take more trips due to convenience, for example). Furthermore, ride-hailing vehicles drive miles without passengers, whether the driver is driving between a drop off and a new pickup, or cruising waiting for the next ride to be ordered. This is known as 'dead-heading.' These could all in turn impact traffic congestion and emissions of air pollutants and greenhouse gases.
3.2.2.1. Theoretical studies
Theoretical studies show great promise of ride-hailing for reducing deadheading, VMT, and ultimately emissions. Wang et al [57] perform an optimization with deep learning neural network to minimize deadheading. Simulations with DiDi Chuxing data from Chengdu, China, show the system can reduce picking up distance by 7.5%. Similarly [58], use a machine learning model combined with RideAustin and DiDi Chuxing data from Chengdu to show that deadheading can be reduced by 53%–82%.
Tikoudis et al [59] use calibrated discrete choice model preference parameters from a choice experiment about transportation modes in 29 OECD countries to simulate 'synthetic trips' through 2050. They find that, with substantial policy support, CO2 emissions will be 6% lower on average due to ride-hailing with pooling, though they find geographic variation. Kawaguchi et al [60] find in a life-cycle analysis that full-scale ride-hailing reduces CO2 emissions by just over 30%, as well as reduced copper usage, due to higher utilization resulting in up to 70% fewer vehicles being produced.
A couple of theoretical studies show more nuanced results. Huang [61] develops a simple theoretical model showing that different combinations of ride-hailing prices and price elasticities could lead to either decreases or increases in congestion. Benjaafar [62] model vehicle ownership under two different ride-hailing models, peer-to-peer and business-to-customer services, using a game theoretic approach. They find that introduction of ride-sharing can decrease vehicle ownership but may also increase traffic. They also identify conditions under which both ownership and traffic could increase.
Ward et al [63] perform Monte Carlo simulations based on publicly available ride-hailing data from several US cities to evaluate the impact of replacing private vehicle travel with ride-hailing systems. They find that local air pollutants would decrease by 50%–60% due to a decline in 'cold starts' and to the ride-hailing fleet being composed of newer, lower emitting vehicles. However, they also find that deadheading would lead to an increase in VMT resulting in a 20% increase in fuel consumption and CO2 emissions.
3.2.2.2. Empirical studies
3.2.2.2.1. Traffic Congestion and VMT
Nine papers using a DiD strategy to investigate the impact of TNC entry on traffic congestion [2, 16, 19, 20, 64–68]. While substitution from transit to ride-hailing and general increase in demand due to convenience of ride-hailing could lead to increased congestion, decreased private vehicle usage, pooling, and operational efficiencies versus taxis (i.e. matching algorithms reducing cruising time searching for passengers) could decrease congestion.
Hall et al [2] find that while commuting time for transit riders decreased after Uber's entry into US urban areas, commuting time for private vehicle drivers increased. They interpret this as evidence of an increase in congestion. Lee et al [20] find that traffic increased upon Uber's entry, particularly in more urban areas, with nearly a 5 min increase to a 20 min ride with a 10% increase in baseline transit ridership. Tarduno [64] finds that Uber and Lyft increase traffic in Austin, Texas, decreasing daytime traffic speeds by about 2.3%. Dhanorkar and Burtch [19] explore differences in congestion impacts in California by weekday versus weekend. They find that Uber's entry increases congestion more on weekends, particularly in higher population density areas and on interior (versus highway) roads. They find that it decreased weekday congestion in areas with low population density, but increased weekday congestion in more population dense areas. Choi [65] finds Uber and Lyft's entry into US urban areas caused a 1% increase in travel delay times, with a larger increase for 'large' metropolitan areas with populations greater than one million.
Li et al [66] find that Uber's entry into US cities did not significantly affect travel time in general, but did decrease travel time in peak directions during peak periods. However [16], find that Uber entry significantly increased traffic in compact US cities, though decreased it (marginally significantly) in sprawling urban areas. This is a result of ride-hailing substituting for transit in denser urban areas, but solving the last mile problem in less dense areas.
The majority of the above empirical evidence points to an increase in traffic congestion in the US following Uber and Lyft's entries. However, the one study on Europe has the opposite conclusion. Fageda [67] investigates Uber's entry into European cities from 2008 to 2016, finding entry reduced congestion by an average of 3.5% points, with effects only being statistically significant in denser cities. Furthermore, the study finds that the reduction in congestion is greater in cities that did not impose strong regulatory restrictions, such as quantitative restrictions, to Uber and other ride-hailing firms.
Taking advantage of various periods of ride-hailing unavailability in three Indian cities during Uber and Ola driver strikes [68], use real-time traffic and route trajectory data from Google Maps to find that in the absence of ride-hailing, travel times fell by 10%–14% in the most congested areas and during the most congested times. The authors provide suggestive evidence that the reductions were caused by reduced deadheading and substitution to public transit.
Five studies use alternative empirical approaches [24, 29, 69–71], with findings consistent with those above. Zheng [29] finds Uber's entry into New York City decreased average travel speed by 0.13 mpg while not affecting traffic volume. Diao et al [24] find that Uber and Lyft's entry in US cities increased congestion, increasing travel time and congested hours by 0.9% and 4.5% on average. Dong [69] compares in-vehicle wait time data from taxi trips Philadelphia, Pennsylvania, before and after the entry of Uber and Lyft, finding increases in weekday wait times, particularly during morning commute hours. Erhardt et al [70] estimate a fixed effects panel regression comparing San Francisco traffic in 2016–2010, when ride-hailing was negligible, using the city's own traffic demand model to produce a counterfactual for 2016 assuming no ride-hailing. They find that ride-hailing caused half of the 13% increase in VMT and a third of the 30% and 62% increases in vehicle hours traveled and vehicle hours of delay between these two years, respectively. Furthermore, average travel speeds over the timeframe decreased 13%, versus 4% in the counterfactual scenario with no ride-hailing.
Choi et al [71] compares VMT for the Atlanta, Georgia, area before TNC entry (2012) to after TNC entry (2018) using the empirical Bayes approach for constructing counterfactual VMT for 2018 assuming no ride-hailing. Their counterfactual combines cross sectional analysis for regional peers with time-series analysis based on Atlanta. They find ride-hailing led to an increase in VMT, with TNCs contributing an additional 0.6% to average annual VMT growth. This is consistent with the increase in US congestion found by the above studies.
Several associational papers utilize the 2017 US NHTS data to identify correlations between transit behavior, mostly using regression analysis or binary choice models and controlling for other socio-demographic variables and built environment characteristics. Wang et al [72] find that regular and active ride-hailing users own fewer vehicles than occasional users. Zou and Cirillo [73] find ride-hailing users are less likely to be primary drivers of a car and that ride-hailing does not have a significant impact on annual VMT. Wu and MacKenzie [74] find that amongst households with vehicles, frequent ride-hailing users tend to have lower annual VMT, but amongst households without a vehicle or respondents without a driver's license, greater ride-hailing use is associated with higher VMT. They estimate that ride-hailing increased net national daily VMT by 7.8 million. Sabouri et al [75] uses machine learning methods in an attempt to capture non-linearities and finds a negative correlation between ride-hailing usage and private vehicle ownership. They also find a negative correlation between vehicle ownership and the number of years Uber has operated in a county.
Roy et al [76] use Uber and Lyft Application Programming Interface data with a travel demand model to decompose contributors to worsening congestion in San Francisco between 2010 and 2016. They find that ride-hailing was the biggest contributor, relative to road and transit network changes and population and employment growth, and that ride-hailing accounted for 47% of the increase in VMT.
Gao et al [77] perform regression analysis on DiDi Chuxing trip level data from Chengdu, China, to investigate the impact of subway proximity from ride origin and destination on trip VKT and emissions. They find that closer proximity is associated with lower VKT and CO2 emissions.
Due to the lack of causal identification in the associational studies, their results are best interpreted in the context of understanding which types of households are more likely to use ride-hailing and in which built environments.
3.2.2.2.2. Deadheading
Most of the empirical evidence points to deadheading being a significant source of ride-hailing VMT and emissions. One of the authors from [78] collected primary data by driving for Lyft and Uber in the Denver, Colorado, area. In addition to collecting data about the trips and deadheading/occupancy rates, a survey was administered to riders, including questions about modal choices if ride-hailing were not available. Using this data, the authors estimate that deadheading miles accounted for more than 40% of VMT, and that ride-hailing led to 83% more VMT than would have been driven if ride-hailing were unavailable. Bekka et al [79] surveyed Uber riders in Paris, France. They estimate changes in VMT due to changes in private vehicle ownership resulting from ride-hailing usage (not factoring in deadheading or other modal substitutions). They estimate that less than 5% of riders gave up their private vehicle in the past 4 years as a result of Uber service. Netting this change with the associated miles generated by ride-hailing, the authors estimate a net impact of −0.6%–0.9% change in city-wide VKT. Tirachini and Gomez-Lobo [80] similarly interview Uber users in Santiago, Chile. Around 40% and 30% of riders would have taken a taxi or public transportation, respectively, if ride-hailing were not available. The authors use the survey data to parameterize a modal transportation choice model. Simulations show that each ride-hailing trip is associated with an average increase of 1.7 km (netting out VKT changes from all modes), and that the probability of ride-hailing reducing VKT is zero.
The remaining deadheading-related studies are associational. Bansal et al [81] calculate deadheading emissions based on detailed trip data from RideAustin. They find deadheading accounted for 59% of VMT and emissions by the ride-hailing fleet from June 2016 to July 2017. Wenzel et al [82] perform a similar analysis on this data, finding that driver commutes and deadheading account for 45% of ride-hailing VMT. Tengilimoglu and Wadud [83] also examines deadheading from a subset of the RideAustin data, focusing on the 200 drivers with the highest number of trips and examining heterogeneity and uncertainty in driver behavior. They estimate that deadheading ranges from 28.4% to 55.7% of VMT. These three studies consistently find that deadheading in this context accounts for close to if not more than half of the miles driven in ride-hailing vehicles.
Schaller [84] combine published estimates from a variety of sources and Uber and Lyft surveys across several US cities to estimate the impact of ride-sharing on VMT from 2014 to 2020. Back of the envelope calculations incorporate average estimates of pooling rates, modal shifts, and deadhead miles to find that total VMT during this time was roughly double what it would have been without ride-hailing, based on average rates of self-reported secondary mode choice.
Sun and Ertz [85] inputs actual traffic data for residents in Toronto and Beijing into a 'bottom-up' life cycle analysis. They find that the decrease in 2016 greenhouse gas emissions relative to 2011 was mostly a result of car sharing, not ride-hailing, and that ride-hailing increased emissions over this period in Beijing, mostly due to deadheading, which accounted for 30% of vehicle lifecycle emissions.
Sui et al [86] combine taxi trajectory data with DiDi Chuxing trajectory from Chengdu, China, and order data to compare fuel consumption and emissions. They find that taxi trips have longer idle distance and shorter delivery distance, and that DiDi Chuxing drivers tend to park more and deadhead less than taxis. This results in fuel consumption and local air pollution from taxi trips to be 1.3–1.5 times greater than those of DiDi Chuxing trips.
Chen [87] use DiDi Chuxing GPS records from Chengdu, China, to estimate the share of distance driven without passengers. They find that deadheading accounts for up to 45% of miles and decreases when demand is high.
3.2.2.2.3. Emissions
Al Balawi [88] employs a DiD on UberX entry using EPA measured air pollutants. They find that UberX's entry into US cities led to an increase in local air pollution—specifically, 2% and 18% increases in maximum nitrous oxide and volatile organic compounds. Barnes et al [89] find the entry of DiDi Chuxing in China led to a short term decrease in PM2.5 pollution in the early months. However, after three months pollution increased above pre-entry levels as the number of ride-hailing vehicles and trips rose.
Kitchel [90] uses state-level fuel consumption data from the Energy Information Administration and a DiD approach to find that the entry of Uber into US urban areas reduced excess fuel consumption by 4.6% between 2004 and 2014, though this effect is marginally significant.
Other empirical research has shown that existing ride-hailing systems are associated with increased air pollution. Qian et al [91] develop a data crawler to collect high-frequency trajectory data in New York City from Uber's API, allowing the authors to convert the trajectories to space-time paths and separate stationary from moving activities, identifying stop-and-go traffic states. Using this data as a measure of actual traffic states, the authors compare traffic conditions between 2017 and 2019. They find that average daily speeds decreased more than 22% over this time period. The deteriorated traffic conditions also caused a 21 g increase in gasoline consumption per kilometer, and a 1 g, 0.15 g, and 0.04 g increase in carbon monoxide, hydrocarbon, and nitrogen oxide emissions per kilometer. However, the authors do not control for other factors that might also have been changing and impacting traffic in the city during this time period.
Wang et al [92] utilize a spatial econometric model to estimate the impact of DiDi Chuxing ride orders on various air pollutants in Shenzhen, China. They find that an increase in orders was associated with an increased in measured air pollutants, but that pollution has decreased following government regulations restricting ride-hailing. Wang et al [93] use cross-sectional data from different cities in China in 2017 to estimate the impact of ride-hailing on haze utilizing a generalized spatial two-stage least squares model. They find that lower levels of ride-hailing are associated with decreases in haze, but that as the ride-hailing markets grow, they lead to higher levels of haze. However, external validity is limited given that the study relies on annual level pollution and ride-hailing measures and does not exploit variation across time or fully account for other differences across location.
In a life cycle analysis [94], calculate CO2 emissions for ride-hailing versus private car ownership under various assumptions. They find that if riders do not own private cars and rely solely on high fuel economy ride-hailing vehicles, emissions would be significantly reduced, whereas emissions are highest when riders spilt travel between a private vehicle and an Uber. This study has several major limitations, including assuming perfect substitutability between ride-hailing and private vehicle ownership.
3.2.2.2.4. Summary
Most of the causal empirical research on the US finds that ride-hailing increases traffic congestion and travel times, lowers average speeds, and increases VMT. More limited evidence suggests ride-hailing caused an increase in congestion in India, but a decrease in Europe. Empirical studies also suggest deadheading leads to significant increases in VMT as a result of ride-hailing. As ride-hailing increases the number of vehicles on the road and miles driven in these vehicles, studies have demonstrated actual, causal increases in measured air pollution as a result of ride-hailing.
3.3. Interactions with electrification, pooling, and automation
Here we address the secondary research question: How will electrification, sharing (pooling), and automation affect energy and environmental impacts of ride-hailing? Electrification and automation are two trends that, while not specific to ride-hailing, could have significant implications for ride-hailing's energy and environmental impacts. Pooling, or ride-sharing, on the other hand, is one avenue to mitigate VMT and congestion impacts of ride-hailing.
3.3.1. Ride-hailing and electrification
Eight theoretical papers focus on electrification of ride-hailing fleets. This research suggests electrification of ride-hailing fleets is feasible and could significantly reduce C02 emissions.
Three assess the potential for electrifying the ride-hailing fleet, with findings suggesting EVs could satisfice the majority of miles in a cost competitive manner. Taiebat et al [95] uses 2019 US Lyft driving data to find that daily travel needs for 86% of drivers can be met by a fully charged EV with at least 250 miles of range, and that such a vehicle would generally be cost competitive given annual mileage. Combining Uber and Lyft data from New York City and San Francisco with agent-based simulations [96], show EVs can provide the same level of ride-hailing service with only three to four 50 kW chargers per square mile. Tu et al [97] performs a similar analysis using GPS trajectories of DiDi Chuxing drivers in Beijing. They find a 200 km range EV would satisfy the needs of more than half of drivers, assuming slower home charging is fully available. With widely available level-2 charging, such a vehicle would suffice for 91% of drivers and 80% of ride-hailing distance traveled.
Two others focus on EV charging scheduling [98, 99]. An agent-based model is used in [98] to simulate driving, parking, and charging behaviors in the San Francisco Bay area. Then, a hybrid algorithm is used to site and size charging stations to meet charging demand. Based on the existing California grid and daily load profile, authors estimate electrification could reduce CO2 emissions by more than 75% in this setting. Iacobucci et al [99] develop an approach to optimize ride-hailing fleet smart charging in an environment with dynamic electricity prices. Their optimization-simulation approach leads not only to 50% lower charging costs, but also about 20% lower CO2 emissions.
Li et al [100] simulates a shared autonomous EV fleet, comparing various adoption levels, occupancy rates, and charging strategies. They find that in California, this fleet would be about five times less carbon intensive per mile relative to ICEVs. Bruchon et al [101] optimize the ride-hailing fleet composition across internal combustion engine, hybrid, and EVs, satisfying demand and minimizing cost. In the majority of future scenarios, hybrids and EVs satisfy the majority of miles, with conventional vehicles used mostly during peak demand periods. They find this could lead to 10% and 22% reduction in air pollution externalities (including both local pollutants and greenhouse gas, or GHG, emissions).
In a life-cycle analysis [102], find that an electrified and autonomous ride-hailing fleet could reduce energy use and GHG emissions by upwards of 60%, with most of the reductions coming from electrification.
One empirical paper assesses emissions reductions potential of electrification of ride-hailing. Jenn [103] combines Uber and Lyft ridership data from California with data from household surveys to find that switching from an internal combustion engine vehicle to an EV is associated with three times more emissions reductions for ride-hailing versus private vehicles, mostly due to the higher utilization factor of the former. In this case, the empirical findings support the theoretical findings that electrification of ride-hailing fleets holds great promise for greenhouse gas emissions reductions.
3.3.2. Ride-hailing and pooling
3.3.2.1. Theoretical studies
Almost 60% (37) of the theoretical papers examine potential impacts of pooling. These papers, summarized in table 2, are overwhelmingly positive in terms of energy and environmental impacts. Methods include designing vehicle dispatch systems, optimization, and algorithms to match riders for pooling. Simulations show pooling can reduce VMT by 4%–57%, reduce fuel consumption by 7%–21%, reduce vehicles in use by 30%–60%, thereby reducing traffic by 37%–50% and reducing both local air pollution and CO2 emissions by around 10%. Many studies show these effects can be achieved with only minimal to moderate increases in waiting and trip times and/or while maintaining or improving passenger fares and/or driver profit.
Table 2. Energy/environmental impacts of pooling.
| Paper | Method | Location | Energy/environmental impact of pooling |
|---|---|---|---|
| [104] | Algorithm to minimize fleet fuel consumption | Ann Arbor, MI, USA | Reduce fuel consumption by 7%, pooling is a major contributor |
| [105] | Propose commute trip-sharing problem to maximize ride sharing, solved with route-enumeration and branch-and-price algorithms | Ann Arbor, MI, USA | Reduce vehicle use and VMT by up to 57% and 46%, respectively |
| [106] | Integer programming model to maximize greenhouse gas savings for dynamic ridesharing system | Atlanta, GA, USA | 1%–3% participation reduces daily CO2 emissions and VMT by 0.025–0.115 million Kg and 0.06–0.28 million miles, respectively |
| [107] | Use taxi data, match riders | Beijing, China | Reduce VMT by 33% |
| [108] | Full-stack transportation simulation using an insertion-based algorithm | Berlin | Reduce VKT by 15%–20% |
| [109] | Use mobile phone data, match trips | Boston, MA, USA | Some scenarios show modest increases in VMT (1.8%) and congestion (7%), other scenarios show large potential decreases (11.5% in VMT and 37% in congestion) |
| [110] | Optimization using genetic algorithm, objective function is shortest route | Dalian, China | Reduce empty-load rate from 35% to 8% |
| [111] | Use DiDi data, match riders. Objective is to maximize VKT reduction. | Haikou, China | Pooling reduce VKT by 8.21% compared to standard ride-hailing |
| [112] | Use taxi data, match riders | Kuwait | Reduce local air pollution by nearly 10% |
| [113] | Use license plate recognition data, match riders | Langfang, China | With 100% ride-sharing and car-sharing, one SAV could replace 3.8 private vehicles and reduce VKT by about 15%. |
| [114] | Optimal ride-sharing problem solved using clustering method | Lyon and Paris, France | Reduce VMT by 25% to 36% |
| [115] | Use call description records and social network data, match riders | Madrid and Barcelona, Spain and New York City and Los Angeles, USA | Reduce number of cars in city by up to 31% |
| [116] | Assume optimal 20% ride sharing participation rate, applied transport model VISUM | Milan, Italy | Reduce VKT by 3.8% |
| [117] | Graph-based approach for trip matching. | New York City, USA | Reduce CO2 emissions by 12.4%–15.5% with shared trip discounted tariff of $0.15–0.10/minute |
| [118] | Propose ride-sharing framework using weighted graph coloring optimization | New York City, USA | Reduce vehicles in use by over 60% |
| [119] | Clustering- based request matching and route planning algorithm | New York City, USA and Beijing, China | Reduce VMT by up to 50% |
| [120] | Use student residential addresses and course schedules, match riders | Ontario, Canada | Reduce total trips by 30% |
| [121, 122] | Integrated transportation and land-use model, incorporating feedback such as modal changes, route and distance changes, and relocating further from urban centers | Paris, France | While pooling reduces VMT, VMT reductions are 30% less due to rebound effects. Assuming average vehicle occupancy of 1.5, they find that CO2 emissions are reduced by about 11%, versus 33% not accounting for the rebound effect. |
| [123] | Travel demand model, use census and survey data, match trips | Prague, Czech Republic | Reduce VMT by 40% |
| [124] | Propose dynamic ride pooling method | San Francisco, New York City, and Los Angeles, USA | Nearly 50% of rides can be pooled, which would reduce fuel consumption by 15% and total vehicle count by 30% |
| [125] | Shareability networks applied to survey of trips | Santiago de Chile, Chile | Reduce VMT by 50% or more |
| [126] | Propose improvements over dynamic ride-sharing (DRS) using existing model, including recommending locations, transfers, and cooperation with other transportation systems | Shanghai, China | Reduce VMT by 44% relative to DRS |
| [127] | Propose large-scale bus ridesharing solved by capacitated clustering and location-allocation problems | Shanghai, China | Reduces number of vehicles and oil use by 96% and 92% compared with no ridesharing |
| [128] | Formulate NP-hard route calculation and solve with various algorithms | Shenzhen, China | Reduce VMT by 33% |
| [129] | Centralized and decentralized optimization algorithms to match passengers and drivers | Sioux Falls, SD, USA | Multi-passenger rides reduce VKT more than single-passenger rides |
| [130] | Mobile-cloud architecture-based system that enables real-time ride-sharing | Sunway City, Malaysia | 2%–10% ride-sharing can reduce fuel consumption by 4%–16% |
| [131] | Genetic Algorithm to assign taxis and match riders | Tehran, Iran | Reduce taxi vehicles by 69% |
| [132] | Deep learning model using GPS travel records | Tokyo, Japan | Reduce VKT by almost 27% |
| [133] | Routing optimization of ride-sharing taxis, minimize operation cost and maximize passenger satisfaction, simulated annealing algorithm | Theoretical | Reduce VMT by 19% |
| [134] | Late acceptance metaheuristic optimization | Theoretical | Reduce VMT by 34% |
| [135] | Propose cluster-based algorithm to dispatch vehicles to serve passengers, using similarity of passengers' demand | Theoretical | Reduce total travel distance |
| [136] | Propose algorithms for passenger transfer with pooling | Theoretical | Passenger transfer can reduce travel distance by 30% |
| [137] | Nonlinear bipartite matching problem | Theoretical | Reduce vehicle traffic by 50% |
| [138] | Aggregate traffic flow model to compare the equilibrium states of a ride-hailing market with pooling to one without | Theoretical | Identify scenarios in which both the time cost to the riders and traffic congestion decrease with pooling |
| [139] | Propose dynamic taxi-sharing system based on intelligent transportation systems. | Theoretical | System saves time and fuel compared to existing solutions. |
| [140] | Design an autonomous taxi ride-sharing system (using a directed network) for commuting | Theoretical | Ride-sharing reduces fuel consumption by 21% relative to regular taxi service |
3.3.2.2. Empirical studies
Empirical studies show that price differentials can induce more riders to share and also show the promise of pooling in terms of reduced emissions. Abkarian et al [141] leverage a change in taxation in Chicago in early 2020 that effectively made solo ride-hailing more expensive, and shared ride-hailing less expensive. Using an interrupted time series methodology, the authors find this effective $1.75 price difference led to a 27% increase in the count of shared trips, and a 12% decrease in the count of private trips. Li et al [142] estimate CO2 and local air pollutant emissions factors for solo versus shared ride-hailing trips based on GPS trajectory data of DiDi Chuxing trips in Chengdu, China. They find pooling reduces emissions by around 30%. Liu et al [143] analyze DiDi Chuxing trip data from pooled rides in Chengdu. They estimate counterfactual travel distances assuming the rides were not pooled. Accounting for detour distance, they find that almost 91% of pooled rides reduce distance traveled, and they calculate associate emissions reductions.
Zheng et al [144] and Chen et al [145] survey recent ride-hailing users in Hangzhou, China and combine the results with DiDi Chuxing ridership data, with a focus on pooling (i.e. users of DiDi Chuxing Hitch and DiDi Chuxing Express). Zheng et al [144] finds that pooling reduced the number of vehicles on the road by an amount equivalent to 2.6% of the vehicle ownership in the city. Chen et al [145] quantify VKT changes resulting from pooling. Though pooling reduces ride-hailing VKT, if users switch from public transit, it could still increase VKT. They find a net decrease in VKT, though it is small since 37% of riders would have otherwise used public transit.
Nevertheless, empirical studies also show that riders prefer not to pool, and actual pooling rates are quite low. Using choice experiments [146–149], examine the choice between private versus pooled ride-hailing trips in the US, as does [150] in the Netherlands. All find riders prefer private rides. Asgari et al [146] also find that public transit users are more open to pooled rides. References [147–149] find that a higher pooling discount is needed for leisure versus commuting trips. Lazarus et al [148] also find riders are least likely to pool when starting a trip from home. Lavieri and Bhat [149] and Alonso-González et al [150] conclude that the disutility of pooling stems more so from the additional time associated with it, rather than sharing per se.
Young et al [151] examine ride-hailing data from 2016 to 2017 in Toronto (including all providers) in an associational analysis and find that while 15% of trips for which riders selected the pooled option (e.g. UberPool), only 52% of these riders were actually matched with an additional rider along their route. They find that longer trips and those during higher demand times increase the probability of matching.
Li et al [152] create an algorithm to identify pooled trips using data from DiDi Chuxing in Chengdu, China, from November 2016. They find that pooling rates are low, at 6%–7%, and are associated with a 10 min delay and 1.5 km detour, on average. Tu et al [153] build on the data and methods from [152] to examine the gap between actual and potential pooling. While 7.85% of trips were pooled, a ridesplitting trip identification algorithm based on a shareability network suggests that 90.69% of rides could have been pooled. The authors estimate observed cost savings from pooling to be only 1.22% with average time delay of just under 10 min. Under their optimized algorithm, cost savings could exceed 18% with an average delay of just under 5 min.
Overall, empirical evidence shows the number of riders choosing the pool is quite low in both geographies studied (Toronto and China) and actual cost savings are low despite travel delays of around 10 min. Two studies on China show pooling reduced vehicles on the road slightly but that the reduction on VMT from pooling was small since over a third of pooled riders substituted from public transit. This research also reveals inefficiencies in current matching algorithms.
3.3.3. Ride-hailing and automation
Nine theoretical papers focus on shared autonomous vehicles (SAVs). SAVs can be operated more efficiently and at a lower cost per mile (no labor costs for paying driver). Overtoom et al [154] simulate traffic in the The Hague, Netherlands, finding that while the autonomous abilities of SAVs could reduce congestion, curbside stops lead to a net increase in congestion due to bottlenecks and deadheading.
Six studies use agent-based models and simulations. Gurumurthy et al [5] determine that SAVs would increase VMT in the Austin, TX, area by 4.5%, despite average vehicle occupancy of nearly 1.5. Levin et al [155] proposes a more realistic method for implementing SAVs in existing traffic simulation models, finding that without pooling, the introduction of SAV ride-hailing could increase congestion. Yan et al [156] explore how SAVs could satisfy trip demand in the Minneapolis–Saint Paul region, finding that without pooling, VMT would increase by 13%, but with pooling, VMT would fall by 17%. Gurumurthy and Kockelman [157] find increasing pick up and drop off spacing for SAVs could increase average occupancy by up to 20% and decrease VMT by up to 27%. Javanshour et al [158] simulate an autonomous mobility on demand system in Melbourne, Australia, showing that while the current fleet could be reduced by 84% to meet existing travel demand, VKT would increase by 29% under a pooled ride-hailing system. Oh et al [159] use a similar model for Singapore and find that VKT in 2030 would be 13% higher with 'moderate' adoption of autonomous mobility on demand, and 32% higher with 'high' adoption, in large part due to deadheading.
Agent-based simulations of a ride-hailing market in Hangzhou, China, however, show that introducing a small share of autonomous vehicles (AVs) into a ride-hailing market can reduce not only average rider waiting times, but also reduce exhaust emissions and VKT by 12.3% [160]. Zhu et al [161] proposes public vehicles (PVs), autonomous and possibly electric high occupancy vehicles, and develop a system model, which combined with traffic flow simulations, show PVs could reduce total travel distance by 34% relative to a conventional vehicle system, and 14% relative to UberPool.
One empirical study, [34], utilizes a choice experiment choice experiment to investigate AVs, or driverless vehicles, which can substantially lower ride-hailing cost. They find a larger increase in ride-hailing share when the ride-hailing vehicles are autonomous, and an associated decrease in transit. However, respondents exhibit a strong preference for private rather than pooled rides.
Overall, the research is mixed on the impacts of automation on ride-hailing VMT. Lower per mile costs could increase VMT while automation technology could reduce congestion. The research also suggests a crucial interaction between automation and pooling. Autonomous technology could facilitate pooling, and pooling can mitigate or reverse potential VMT increases. Studies also indicate that there is scope for improvements in programming.
4. Conclusion
4.1. Focused conclusions
We perform a systematic review of the literature on the energy and environmental impacts of ride-hailing. Of the studies included in our review, just over half are empirical papers that estimate actual impacts, while the rest explore future or potential impacts.
Table 3 shows this review's research question and distills the literature's answers to these questions. In terms of the first research question, theoretical studies have overall optimistic findings, showing that ride-hailing has the potential to increase public transit, decrease private vehicle ownership, reduce VMT and congestion, and ultimately reduce emissions to decrease energy use and improve environmental outcomes. In contrast, the empirical studies are decidedly more pessimistic, showing ride-hailing has increased congestion and travel times in many cases, and also leads to higher VMT (in part due to deadheading), which increases emissions and air pollution.
Table 3. Summary of results.
| Theoretical studies | Empirical studies | |
|---|---|---|
| What are the energy and environmental impacts of ride-hailing? (primary research question) | ||
| Impacts on modal choice, public transit, and vehicle ownership | A large fraction of private vehicles and private vehicle trips could be replaced by ride-hailing and/or public transit. | Higher quality studies (causal and survey-based) show ride-hailing is more often a substitute than a complement to public transportation, though evidence is mixed. There is evidence of a decrease in private vehicles in Asia but not necessarily in the US. |
| Impacts on VMT, traffic congestion, deadheading, and emissions | Ride-hailing has significant potential for reducing deadheading, VMT, and therefore emissions. | Ride-hailing increases traffic congestion and travel times, lowers average speeds, and increases VMT (partially due to deadheading), thereby increasing emissions and air pollution. |
| How will electrification, sharing (pooling), and automation affect energy and environmental impacts of ride-hailing? (secondary research question) | ||
| Ride-hailing and electrification | Electrification of ride-hailing fleets is feasible and could significantly reduce C02 emissions. | Electrification of ride-hailing vehicles reduces emissions more than electrification of private vehicles. |
| Ride-hailing and pooling | Pooling has the potential to reduce VMT by 4%–57%, reduce fuel consumption by 7%–21%, reduce vehicles in use by 30%–60%, thereby reducing traffic by 37%–50% and reducing both local air pollution and CO2 emissions by around 10%. | Riders prefer not to pool, and actual pooling rates are quite low. |
| Ride-hailing and automation | Lower per mile costs could increase VMT while automation technology could reduce congestion. Autonomous technology could facilitate pooling, and pooling can mitigate or reverse potential VMT increases. There is scope for improvements in programming. | Autonomous vehicles could increase ride-hailing and decrease public transit use. Potential riders show a strong preference for private rather than pooled rides. |
In terms of the second research question, once again, theoretical studies are more optimistic about pooling and automation, showing how they (especially pooling) could lead to lower VMT and emissions. However, the (limited) empirical studies show riders do not want to pool and automation could increase ride-hailing usage without increasing pooling. The theoretical and empirical studies agree only on electrification, which both find could substantially reduce ride-hailing emissions.
The disconnect between the empirical and theoretical research on the energy and environmental impacts of ride-hailing is likely caused by the overly-optimistic assumptions of the theoretical models. For example, many assume that all trips that could be replaced by ride-hailing would be or that all riders who could feasibly share a ride would do so. Such optimal assumptions not being realized given actual consumer preferences and behavior in part drive the gap between 'engineering estimates' and observed performance (e.g. of energy efficiency programs [162]). For example, one of the theoretical papers [63] estimates that replacing private vehicle travel in six US cities with ride-hailing would decrease local air pollution by 50%–60% due to a reduction in 'cold starts' and more fuel efficient vehicles. However, two empirical papers [89, 91] find that TNC entry in various US increased local air pollution by as much as 18%. The theoretical papers pointing to the substantial potential benefits of pooling do not factor in consumers' behavior, such as the fact that many riders are quite reluctant or even unwilling to share rides. This suggests that optimistic future projections of ride-hailing should be taken with a grain of salt by practitioners and policy makers alike.
4.2. Gap analysis and future outlook
The reviewed literature on ride-hailing exhibits several notable weaknesses and gaps that merit attention. Firstly, theoretical models' assumptions are overly optimistic, often diverging significantly from the observed outcomes in empirical studies. Unrealistic assumptions, such as the expectation that all potential ride-hailing trips would be adopted or that riders would readily embrace ride-sharing, contribute to a substantial disconnect between theoretical projections and real-world impacts. This emphasizes the need for theoretical models to incorporate more nuanced and realistic behavioral considerations to better align with empirical findings.
Secondly, empirical studies themselves face limitations, particularly in terms of generalizability. The majority of research has focused on ride-hailing's impacts in the United States, with fewer studies examining diverse global contexts. Regional variations in infrastructure, urban planning, and consumer behavior may influence ride-hailing outcomes differently. Additionally, a notable gap exists in the absence of a comprehensive understanding of ride-hailing's environmental and energy impacts in developing economies. Future research should address these geographical gaps to provide a more global understanding of ride-hailing's implications across diverse settings.
Lastly, the literature reveals a scarcity of longitudinal studies capturing the evolving nature of ride-hailing impacts over time. Many studies provide snapshots of the situation at a specific point, but fail to explore how ride-hailing dynamics change in response to external factors, regulatory shifts, or technological advancements. Longitudinal studies would offer valuable insights into the dynamic nature of ride-hailing's influence on traffic patterns, emissions, and consumer behaviors, helping policymakers and industry stakeholders adapt strategies in response to changing conditions. Addressing these weaknesses and gaps will contribute to a more comprehensive and nuanced understanding of the multifaceted impacts of ride-hailing.
Ride-hailing has in many cases increased VMT, congestion, and emissions. Ride-hailing has the potential to decrease energy use and emissions, with pooling and electrification being key drivers of reductions. The impact of automation leads to future uncertainty. We suggest two major themes for future research. First, as test beds for automation arise, it will be important to assess the impact of automation of ride-hailing systems, particularly factoring in consumer behavioral responses. Second, future research should seek to identify why current pooling rates are so much lower than many studies suggest would be optimal, as well as develop policies that incentivize consumer behavior to better align with engineers and planners' goals.
Data availability statement
No new data were created or analysed in this study.
Appendix:
Search Strings
Scopus:
TITLE-ABS-KEY(('ride hail*' OR ride-hail* OR ridehail* OR 'ride shar*' OR ride-shar* OR rideshare* OR UberPool OR 'ride split*' OR ridesplit* OR 'ride sourc*' OR ride-sourc* OR ridesourc* OR TNC OR 'transportation network companies' OR Uber OR Lyft OR Didi OR Ola OR Gojek) AND ('gasoline consum*' OR 'gas consum*' OR 'fuel consump*' OR 'fuel demand' OR 'oil consum*' OR 'oil demand' OR 'energy use' OR 'energy demand' OR 'energy consum*' OR 'fuel economy' OR 'energy efficien*' OR 'fuel efficien*' OR pool* OR VMT OR 'vehicle miles travel*' OR VKT OR 'vehicle kilometers travel*' OR 'vehicle use' OR 'travel demand' OR 'vehicle own*' OR 'car own' OR 'vehicle stock' OR 'car stock' OR congest* OR traffic OR transit OR 'public transport*' OR bus OR subway OR 'mode shift*' OR 'last mile' OR environment OR emission* OR CO2 OR GHG OR 'air pollut*')) AND PUBYEAR > 2007
A Scopus Secondary document (searched for using same string as above) 'is a document that has been extracted from a Scopus document reference list but is not available directly in the Scopus database since it is not indexed by Scopus.' Results include conference proceedings, government, business, and industry reports.
Web of Science Core Collection:
Search String ('topic' search includes titles, abstracts, and keywords):
('ride hail*' OR ride-hail* OR ridehail* OR 'ride shar*' OR ride-shar* OR rideshare* OR UberPool OR 'ride split*' OR ridesplit* OR 'ride sourc*' OR ride-sourc* OR ridesourc* OR TNC OR 'transportation network companies' OR Uber OR Lyft OR DiDi Chuxing OR Ola OR Gojek)
AND
('gasoline consum*' OR 'gas consum*' OR 'fuel consump*' OR 'fuel demand' OR 'oil consum*' OR 'oil demand' OR 'energy use' OR 'energy demand' OR 'energy consum*' OR 'fuel economy' OR 'energy efficien*' OR 'fuel efficien*' OR pool* OR VMT OR 'vehicle miles travel*' OR VKT OR 'vehicle kilometers travel*' OR 'vehicle use' OR 'travel demand' OR 'vehicle own*' OR 'car own' OR 'vehicle stock' OR 'car stock' OR congest* OR traffic OR transit OR 'public transport*' OR bus OR subway OR 'mode shift*' OR 'last mile' OR environment OR emission* OR CO2 OR GHG OR 'air pollut*')
With Date Range: 2008–01-01–2023–12-31
WorldCat Dissertations and Theses subject (su:) (8) and title (ti:) (16) searches
((su: ride and su: hail*) OR su: ride-hail* OR su: ridehail* OR (su: ride and su: shar*) OR su: ride-shar* OR su: rideshare* OR su: UberPool OR (su: ride and su: split*) OR su: ridesplit* OR (su: ride and su: sourc*) OR su: ride-sourc* OR su: ridesourc* OR su: TNC OR ((su: transportation and su: network and su: companies) OR su: Uber) OR su: Lyft OR su: DiDi Chuxing OR su: Ola OR su: Gojek) AND ((su: gasoline and su: consum*) OR (su: gas and su: consum*) OR (su: fuel and su: consump*) OR (su: fuel and su: demand) OR (su: oil and su: consum*) OR (su: oil and su: demand) OR (su: energy and su: use) OR (su: energy and su: demand) OR (su: energy and su: consum*) OR (su: fuel and su: economy) OR (su: energy and su: efficien*) OR (su: fuel and su: efficien*) OR su: pool* OR su: VMT OR ((su: vehicle and su: miles and su: travel*) OR su: VKT) OR ((su: vehicle and su: kilometers and su: travel*) OR (su: vehicle and su: use) OR (su: travel and su: demand) OR (su: vehicle and su: own*) OR (su: car and su: own) OR (su: vehicle and su: stock) OR (su: car and su: stock) OR su: congest*) OR su: traffic OR su: transit OR (su: public and su: transport*) OR su: bus OR su: subway OR (su: mode and su: shift*) OR (su: last and su: mile) OR su: environment OR su: emission* OR su: CO2 OR su: GHG OR (su: air and su: pollut*)) not mt: juv and yr: 2008–2023 and la = 'eng' and ((dt = 'bks') or (dt = 'ser') or (dt = 'art')) and mt: deg.
((ti: ride and (ti: ti and ti: hail*)) OR ti: ride-hail* OR ti: ridehail* OR (ti: ride and ti: shar*) OR ti: ride-shar* OR ti: rideshare* OR ti: UberPool OR (ti: ride and ti: split*) OR ti: ridesplit* OR (ti: ride and ti: sourc*) OR ti: ride-sourc* OR ti: ridesourc* OR ti: TNC OR ((ti: transportation and ti: network and ti: companies) OR ti: Uber) OR ti: Lyft OR ti: DiDi Chuxing OR ti: Ola OR ti: Gojek) AND ((ti: gasoline and ti: consum*) OR (ti: gas and ti: consum*) OR (ti: fuel and ti: consump*) OR (ti: fuel and ti: demand) OR (ti: oil and ti: consum*) OR (ti: oil and ti: demand) OR (ti: energy and ti: use) OR (ti: energy and ti: demand) OR (ti: energy and ti: consum*) OR (ti: fuel and ti: economy) OR (ti: energy and ti: efficien*) OR (ti: fuel and ti: efficien*) OR ti: pool* OR ti: VMT OR ((ti: vehicle and ti: miles and ti: travel*) OR ti: VKT) OR ((ti: vehicle and ti: kilometers and ti: travel*) OR (ti: vehicle and ti: use) OR (ti: travel and ti: demand) OR (ti: vehicle and ti: own*) OR (ti: car and ti: own) OR (ti: vehicle and ti: stock) OR (ti: car and ti: stock) OR ti: congest*) OR ti: traffic OR ti: transit OR (ti: public and ti: transport*) OR ti: bus OR ti: subway OR (ti: mode and ti: shift*) OR (ti: last and ti: mile) OR ti: environment OR ti: emission* OR ti: CO2 OR ti: GHG OR (ti: air and ti: pollut*)) not mt: juv and yr: 2008–2023 and la = 'eng' and ((dt = 'bks') or (dt = 'ser') or (dt = 'art')) and mt: deg.
Footnotes
- 3
Ride-hailing (sometimes called ride sourcing) is one mode of shared personal transit. Ride-hailing specifically refers to the hiring of a private driver. Carpooling or pooling refers to the sharing of car journeys by multiple riders. Carpooling typically refers to unpaid arrangements between riders in one of their own automobiles, while pooling (also called ride sharing and ride splitting) is often used to refer to multiple riders with different destinations sharing a ride-hailing vehicle. Car sharing, on the other hand, typically refers to a model of short term car rentals by a network of drivers.
- 4
- 5
- 6
- 7
Technically, Web of Science is a platform to access other databases. We search their 'Core Collection' of databases.
- 8
A market as a group of buyers and sellers- in this case, riders and drivers, interacting. We use this broad term to essentially include any use or test case of ride-hailing, including both real and simulated ride-hailing markets.
Supplementary data (2.4 MB XLSX)