

Abstract
Northern Europe and Northeast Asia, which are climatologically mild and temperate in early summer, both witnessed record-breaking heat extremes in June 2023. With a focus on the subseasonal time scale, this study highlights a teleconnected relationship in historical early-summer heat extremes between Northern Europe and Northeast Asia. By diagnosing the thermal budget and wave activity flux, we show that over one third of historical Northeast Asian heat extremes are initialized by Eurasian mid-latitude Rossby wave packets. The wave packets manifest as strong anticyclonic anomalies over subpolar North Atlantic, cyclonic anomalies over Ural region and anticyclonic anomalies over Northeast Asia, which directly cause coexisting heat extremes in Northern Europe and Northeast Asia. Such wave packets are strongly modulated by the Eurasian jet stream. By carrying out numerical experiments, we further explain why the wave packet is significant in early summer. We find that the quasi-stationary response of the Eurasian midlatitude Rossby wave packets to a specified heating in subpolar North Atlantic is dependent on the background jet structure. In early summer, the double-jet state over Eurasia favors Rossby wave propagation. This is of great practical importance for accurate prediction of Northeast Asian heat extreme amplitude and location.
Export citation and abstract BibTeX RIS

Original content from this work may be used under the terms of the Creative Commons Attribution 4.0 license. Any further distribution of this work must maintain attribution to the author(s) and the title of the work, journal citation and DOI.
1. Introduction
Heat extremes describe events in which air temperatures are excessively higher than normal, which directly affect various systems, including human health, energy demand, ecosystems and forests (Auffhammer et al 2017, Albergel et al 2019, Ebi et al 2021). Multiple studies, including those summarized in the Sixth Assessment Report of the Intergovernmental Panel on Climate Change (IPCC), have suggested that the frequency and intensity of heat extremes have increased globally under climate change (Chen and Sun 2017, Sun et al 2022). Northern Europe and Northeast Asia, which are climatologically mild and temperate during early summer, both witnessed record-breaking heat extremes in June 2023. In UK, June 2023 has been confirmed as the hottest month on record since 1884 (Met Office 2023). At the same time, the daily maximum temperature was greater than 40 ∘C for weeks in most stations of Northern China, causing high energy demand and heatstrokes in several places (Qian et al 2023).
Previous studies have suggested that heat extremes are driven by horizontal advection of air from climatological warmer regions, adiabatic warming from subsidence and diabatic heating owing to radiation and surface sensible heat fluxes (White et al 2022, Domeisen et al 2023). The soil moisture variation and urbanization may also play a role in exaggerating the heat extreme amplitude and prolong the heat extreme persistence (Wang et al 2015, Sun et al 2016, Seo et al 2019, Jiang et al 2023, Zhang et al 2023a). The relative contributions of these physical processes to the build-up of heat extremes are dependent on the region where the heat extreme occurs. In the extratropics, heat extremes are typically associated with long-lived quasistationary anticyclonic anomalies that are often identified as blocks. These anticyclonic anomalies are formed mainly through large-scale or circumglobal Rossby wave packets (Ding and Wang 2005, Xu et al 2019, 2020, Ding et al 2020), and enhanced by thermal and orographic forcing (Jimenez-Esteve et al 2022). For instance, over half of the temperature anomalies of the strong 2010 Russian heatwaves, unprecedented European heatwave in June 2019 and North America heatwave in June 2021 were suggested to be associated with summertime blocking circulation (Drouard and Woollings 2018, Xu et al 2021, Neal et al 2022, Zhang et al 2023b). The circumglobal wave pattern contributed to the 2018 European heatwave and a concurrent heatwave in California (Kornhuber et al 2019, Domeisen et al 2022). Extreme heat events over Northwest China were driven by Silk Road Pattern teleconnection (Zhou et al 2024). On the interannual time scale, East Asian heatwaves were suggested to be driven by Arctic–Siberian warming (Kim et al 2022) and amplified by ENSO (Luo and Lau 2019). In the subtropical regions, the heat extremes are often associated with persistently strong subtropical high. During June to August 2022, a record-breaking heatwave hit southeast China, which persisted for 79 d. This long-lasting heatwave was suggested to be associated with abnormally strong western Pacific subtropical high and south Asian high (Zhang et al 2023b). The literature described above has extensively examined the physical processes responsible for several large-impact heatwave events over different regions on multiple time scales.
In this study, with a focus on the subseasonal time scale, we aim to systematically examine the dynamical processes responsible for the formation of historical Northeast Asian heat extremes during early summer when the specific humidity is relatively low and the Eurasian jet structure is unique compared to late summer. The paper is organized as follows. The data, heat extreme detection algorithm and experiment setup are introduced in section 2. Physical processes responsible for the early-summer Northeast Asian heat extremes and dependence of Rossby wave packets to jet stream are presented in section 3. Summary and discussion are provided in section 4.
2. Data and method
2.1. Reanalysis data
In this study, we use the daily maximum surface air temperature, sea surface temperature (SST) and zonal wind, meridional wind, vertical velocity, air temperature, geopotential height on pressure levels from the fifth generation of atmospheric reanalysis in European Centre for Medium-Range Weather Forecasts (ERA5 reanalysis) (Hersbach et al
2020). The data analyzed are on the  longitude-latitude grids for the period of June 1979–2023.
2.2. Identification of heat extremes
The early-summer Northeast Asian heat extremes are identified if the daily maximum surface air temperature averaged over Northeast Asia (110∘ E–130∘ E, 35∘ N–50∘ N) is above the 95th percentile of historical daily value during June 1979–2023. The results are robust if daily mean/minimum temperature is used. 69 heat extreme days have been detected for the total 45 yr. The thermal budget and circulation characteristics associated with heat extremes are investigated through lagged composites of these fields. Daily anomaly data of all fields are used throughout this paper by removing the daily climatology and long-term trend. All significance testing of composite analysis is conducted with a two-tailed t test.
2.3. Thermal budget
To help understand the local temperature evolution associated with the heat extremes, the thermal budget analysis at 850 hPa is employed as in Nie et al (2022), which we present below.
where T is the temperature, V is the horizontal wind vector, ω is the vertical velocity in pressure coordinates, cp
is the specific heat capacity of air at constant pressure, Rd
is the gas constant for dry air,  , and Q is the diabatic heating. By equation (1), the local temperature change is determined by the horizontal advection of temperature, changes in temperature due to adiabatic expansion or compression due to vertical motion, and diabatic processes. Note that the diabatic heating term is estimated as a residual of equation (1).
2.4. Wave activity flux
To examine the wave propagation associated with the Northeast Asian heat extremes, the horizontal component of the wave activity flux derived by Takaya and Nakamura (2001), hereafter TN01 is diagnosed.
where  is the deviation of the stream function from the daily climatology, U and V are the climatological background flow. The wave activity flux measures the eddy propagation in accordance with the background flow, with its direction parallel to the local group velocity of Rossby waves. Through this diagnostic, the source and sink of wave packets and the wave energy propagation relative to/in accordance with the mean flow associated with Northeast Asian heat extremes can be explicitly identified.
2.5. Model description and experiment setup
To examine the roles of jet stream in modulating the Northeast Asian heat extremes, we perform two sets of idealized experiments using the Geophysical Fluid Dynamics Laboratory (GFDL) spectral dynamical core. The model is run at T42 resolution with 40 vertical sigma levels and a time step of 800 s. The model is forced by the Newtonian relaxation to zonally asymmetric equilibrium temperature Teq and damped by the Rayleigh friction in the planetary boundary layer. The model also uses realistic topography that allows for the excitation of a rather realistic planetary-scale stationary wave pattern. Model parameters are identical to those used in Wu and Reichler (2018), except where noted.
The first family of experiments uses the model default configuration. We optimize Teq to let the simulated temperature climatology converging toward that of the reanalysis in early summer (June) and late summer (August) respectively. These experiments are referred to early-summer control experiment and late-summer control experiment. In the second set of experiments, a thermal forcing experiment (heating) is performed. We add a simple gaussian-like thermal forcing in the subpolar North Atlantic region centering at (20∘ W, 55∘ N) as follows:
where F0 is the amplitude of heating (2 K day−1), λ and φ denote the longitude and latitude. For all experiments, the model is integrated under perpetual conditions for 2000 days with the first 500 days of spinup discarded.
3. Results
3.1. Characteristics of Northern European and Northeast Asian heat extremes in June 2023
A series of record-breaking heatwaves hit Northern China during June 2023. Figure 1(a) shows the daily evolution of surface maximum air temperature in Beijing from June 1 to June 30, 2023. There were three typical heatwaves with air temperature exceeding 35 ∘C. The longest and strongest heatwaves were observed from June 21 to June 30, with the maximum temperature even exceeding 40 ∘C, which broke the historical record since 1961. The regional-averaged temperature anomalies over Northeast Asia (110–130∘ E, 35–50∘ N) exceeded 3 ∘C from June 21 to June 27 (figure 1(b)). During the same period, the UK experienced the hottest June on record (Met Office 2023). The Northern European surface maximum air temperature during June 2023 break the historical record as shown in figure 1(c). The daily maximum air temperature anomaly exceeded 3 ∘C from June 10 to June 25 (figure 1(d)).

Figure 1. (a) Evolution of daily maximum air temperature in Beijing during June 2023. (b) Evolution of regional-mean daily maximum air temperature anomalies over Northeast Asia (110-130∘ E, 35–50∘ N) during June 2023. (c) Interannual variation of monthly-mean maximum air temperature over Northern Europe (10∘ W–10∘ E, 45–60∘ N) during June from 1960 to 2023. (d) As in (b) but for Northern Europe. (e) Anomalous surface air temperature (shading, with unit of (K), 250 hPa geopotential height (contour, with contour interval (CI) of 50 (m) and wave activity flux (arrows, unit: m2 s−1) averaged during 21–30 June 2023. (f) as in (e) but for the 250 hPa zonal wind (contour) and its anomalies (shading, unit: m s−1). Stippling in (e)–(f) indicates the regions where the values are significant at the 95% confidence level based on the Student's t test..
Download figure:
Standard image High-resolution imageFigures 1(e) and (f) further display the geographical distribution of surface air temperature anomalies and circulation characteristics during 21–30 June 2023. It is clear that the surface air temperature shows strong warm anomalies over Northern Europe, east Siberia and Northeast Asia. Such clustering warm anomalies in different regions may be related to planetary Rossby wave packets (Ding and Wang 2005). The upper-tropospheric geopotential height displays positive anomalies over Northern Europe, negative anomalies over Ural region and positive anomalies over east Siberia and Northeast Asia, which matches well with the surface air temperature anomalies. Such alternatively positive and negative geopotential height anomalies are associated with Rossby wave packets originating from the subpolar North Atlantic (see the arrows in figure 1(e)), indicating an important role of Rossby wave packets in forming the Northeast Asian heat extremes. As suggested by previous studies (Nie et al 2022), the early summer Rossby wave packets are often organized by the jet waveguide. As shown in figure 1(f), the zonal wind displays a stronger Eurasian jet during the heatwave period, which provides a favorable guide for the wave packets.
3.2. Physical processes responsible for historical Northeast Asian heat extremes
We next systematically explore the formation mechanisms responsible for the historical heat extremes over Northeast Asia during early summer by diagnosing the thermal budget and examining the evolution of circulation anomalies. Figure 2 shows the 3 d averaged composite maps of each term in the 850 hPa thermal budget of equation (1) prior to the peak dates of Northeast Asian heat extremes. As shown in figure 2(a), the temperature tendency exhibits strong positive values over Northeast Asia (black box), indicating a strong warming tendency. Decomposition of temperature tendency shown in figures 2(b)–(d) illustrates that horizontal temperature advection plays an important role in the western region of Northeast Asia. The horizontal advection of temperature is mainly determined by the anomalous flow advection on mean temperature (figure S1). Adiabatic term makes a major contribution to the warming over the eastern region of Northeast Asia. Diabatic heating acts to warm the central Northeast Asia. This indicates that anticyclonic circulation anomalies above the warm anomalies dominate the heat extreme formation over Northeast Asia. On the one hand, the anticyclonic wind anomaly acts to blow the warm air from the upstream to Northeast Asia. On the other hand, maintenance of anticyclonic flow anomalies leads to subsidence, which acts to exaggerate the surface warm anomaly through adiabatic process (figure S2). The diabatic heating exerts a direct heating effect to the region mainly through clear-sky conditions and increased incoming solar radiation.

Figure 2. 3-day averaged composite maps of the thermal budget anomaly before the peak dates of Northeast Asian heat extremes. (a) Temperature tendency, (b) horizontal advection of temperature, (c) adiabatic term due to vertical motion, (d) diabatic term (estimated as a residual) of the thermodynamical equation. The unit of each term is K day−1. The black box in (a) denotes the key region for Northeast Asian heat extremes (110–130∘ E, 35–50∘ N). Stippling in (a)–(d) indicates the regions where the values are significant at the 95% confidence level based on the Student's t test.
Download figure:
Standard image High-resolution imageSince the anticyclonic anomaly over Northeast Asia is crucial for the formation of heat extremes, we next explore its formation processes. Figures 3(a)–(c) show the lagged composites of anomalous surface air temperature, 250 hPa geopotential height and wave activity flux associated with the evolution of Northeast Asian heat extremes. Prior to the heat extremes by 4 to 6 days, the 250 hPa geopotential height displays alternating positive and negative anomalies from subpolar North Atlantic to Northeast Asia (figure 3(a)). It is characterized with an anticyclonic anomaly in the subpolar North Atlantic, a cyclonic anomaly in the Ural region and an anticyclonic anomaly in Northeast Asia. This well corresponds to the warm-cold-warm anomalies of surface air temperature over the same regions. The anomalous wave activity flux shows Rossby wave packets originating from the subpolar North Atlantic and propagating downstream toward the Northeast Asia with a curved pathway, suggesting an important role of Rossby wave train in the initial formation of Northeast Asian heat extremes. Then at lags −3 to −1 days, the Z250 exhibits much stronger positive anomalies in Northeast Asia (figure 3(b)), suggesting a rapid growth of the preexisting anticyclonic high. The anomalous wave activity flux displays a relatively weaker horizontal wave propagation in the Eurasian continent. Following the peak date of heat extremes by 0–2 d (figure 3(c)), the anticyclonic anomalies in the Northeast Asia are maintained and stayed.
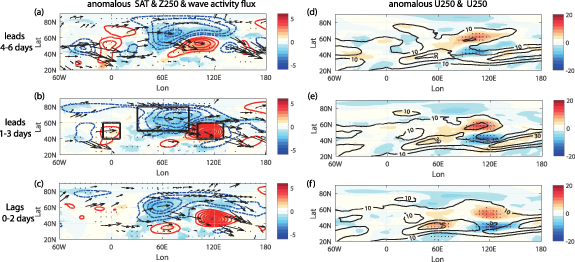
Figure 3. Left, composites of surface air temperature anomalies (shading, unit: (K), 250 hPa geopotential height anomalies (contour, interval: 20 (m) and anomalous wave activity flux (arrows, unit: m2 s−1) at lags −6 to −4 d, −3 to −1 d and 0 to 2 d associated with the Northeast Asian heat extremes. Right, as in left but for the composites of 250 hPa zonal wind (contour) and its anomalies (shading, unit: m s−1). Stippling in (a)–(f) indicates the regions where the values are significant at the 95% confidence level based on the Student's t test. Only the significant wave activity fluxes at the 65% confidence level are plotted. The black boxes in (b) denote the wave packet center.
Download figure:
Standard image High-resolution imageThe above thermal budget and wave activity flux diagnostics suggest that the Northeast Asian anticyclonic anomaly, which dominantly drives the Northeast Asian heat extremes, is primarily initialized and maintained by midlatitude Rossby wave packets over the Eurasian continent. According to the classical stationary wave theory, the Rossby wave train is often organized by the jet waveguide (Hoskins and Karoly 1981, Held et al 2002). The right column of figure 3 shows the lagged composite maps of 250 hPa zonal wind and its anomaly associated with the evolution of Northeast Asian heat extremes. It is evident that preceding the heat extremes by 4–6 days, the Eurasian jet stream is relatively stronger and wave packets propagate along the jet stream. Meanwhile, the zonal wind over Northeast Asia exhibits a north-south dipolar structure in the whole life cycle of heat extremes, with westerly anomaly in the north and easterly anomaly in the south. Such dipolar zonal wind anomalies are in favor of the maintenance for the anticyclonic anomaly.
To quantify the contribution of Eurasian Rossby wave packets to the formation of Northeast Asian heat extremes, we also count the occurrence of wave packets prior to the heat extremes by 1–3 days. Figure 4(a) shows the scatter plot between the geopotential height anomalies averaged over Northeast Asia and those over subpolar North Atlantic and Ural region preceding the heat extremes. 97% of the Northeast Asian heat extremes are associated with the Northeast Asian anticyclonic anomalies. 60% of anticyclonic-type Northeast Asian heat extreme formation are preceded by positive height anomalies over subpolar North Atlantic and negative height anomalies over Ural region. The correlation between geopotential height anomalies over Northeast Asia and those in subpolar North Atlantic and Ural region are 0.28 and −0.61 respectively, which passes the 95% significance level. Furthermore, we define the occurrence of wave packet as the days when the geopotential height in these three key regions (the black boxes in figure 3(b)) are greater than 0.5 times daily standard deviation respectively. 36% of anticyclonic-type Northeast Asian heat extreme formation are preceded by the Eurasian midlatitude Rossby wave trains. The heatwaves in early summer 2023 were extreme events with unusually stronger wave-packet influence (denoted by the bigger circles).

Figure 4. (a) Scatterplot of the 250 hPa geopotential height anomalies (unit: (m) in Northeast Asia ( –
– ,
,  –
– ) versus those in subpolar North Atlantic (red circle, 10∘ W–10∘ E, 40∘ N–60∘ N) and Ural region (blue circle,
  –
– ,
,  –
– ) 1–3 days preceding the Northeast Asian heat extremes. The geopotential height anomalies in Ural region is multiplied by −1 for comparison. The larger circles denote the 2023 Northeast Asian heat extreme cases. (b) Lagged correlation between the Eurasian jet speed (
 ) and SAT anomalies over Northeast Asia (
 ). The negative lag denotes the jet leads SAT. The dashed lines denote the corresponding values of 95% significance level, which are estimated from the autocorrelations of each time series (Sciremammano 1979). (c) Composite maps of SST anomalies (unit: (K) 1–10 days preceding the peak date of Northeast Asian heat extremes. Stippling indicates the regions where the values are significant at the 95% confidence level based on the Student's t test.
Download figure:
Standard image High-resolution imageThe importance of Eurasian jet stream in affecting the Northeast Asian heat extremes is further examined by calculating the lagged correlation between the Eurasian midlatitude jet speed anomalies averaged over (50–120∘ E, 45–60∘ N) and Northeast Asian surface air temperature anomalies averaged over ((110-130∘ E, 35–50∘ N)). As shown in figure 4(b), the daily correlation between the two fields reaches 0.31 when the jet leads SAT by 1 d, confirming the strong modulating effect by jet stream.
In addition to the modulation effect by jet stream, the formation of Rossby wave packets is triggered by a wave source (strong anticyclonic anomaly) in the subpolar North Atlantic. As suggested by previous studies (Nie et al 2019), the anticyclonic anomaly over subpolar North Atlantic may result from an active two-way coupled ocean-atmosphere interaction (e.g. North Atlantic sub-polar gyre). Figure 4(c) shows the composite maps of detrended SST anomalies preceding the heat extremes by 10 d. The SST shows a significant warm anomalies centered at 20∘ W, 55∘ N, well matching the strong anticyclonic anomaly over subpolar North Atlantic. On the one hand, warm subpolar North Atlantic SSTs can be driven by the high pressure via a reduction in clouds and an increase in downwelling shortwave radiation. On the other hand, warm SST anomalies in subpolar North Atlantic could strengthen the meridional temperature gradient to the north of 55∘N and decrease the temperature gradient to the south of 55∘N, which may help to form a anticyclonic anomaly. Such two-way interaction between warm SST and atmospheric anticyclonic anomaly may provide a persistent wave sources for the Eurasian wave packets. Note that the North Atlantic ocean experienced record-breaking high temperatures during 2023 spring, and strong marine heatwaves in early summer (Madeleine Cuff 2023). This led to a maintenance of strong wave sources, which may partially explain the strongest Eurasian wave packets during early summer 2023.
3.3. Modulation of Rossby wave packets by jet stream in GFDL model
The above observational diagnostic results suggest that the Northeast Asian heat extremes are formed through midlatitude Rossby wave packets that originate from subpolar North Atlantic and propagate along the Eurasian jet. In this subsection, we carry out numerical experiments to understand the wave packet response to a heating forcing in the subpolar North Atlantic and try to explain why the wave packets are significant only in early summer. As suggested by previous studies, changes to the jet stream waveguide structure for planetary waves are hypothesized to modulate the frequency of quasi-resonance amplification of planetary waves (Kornhuber et al 2017, Mann et al 2017). Figures 5(a) and (b) show the horizontal and vertical distribution of heating forcing in the heating experiments. We add a gaussian-shaped shallow heating centered at 20∘ W, 55∘ N, which is roughly consistent with the observed SST anomalies shown in figure 4(c). The vertical profile of heat source is determined based on the observed vertical structure of temperature anomalies above the warm SST anomalies, where the temperature anomalies are largest in the boundary layer (figure not shown). For simplicity, we maximize the heat source at the surface.

Figure 5. (a) and (b) Horizontal and vertical distribution of heating in the GFDL model. The unit of heating forcing is K day−1. Climatology of 275 hPa zonal wind (unit: m s−1) during (c) June and (d) August in the model control runs. (e) and (f) Quasi-stationary response of geopotential height anomalies (shading, unit: (m) and wave activity flux (arrows, unit: m2 s−1) in corresponding heating experiments.
Download figure:
Standard image High-resolution image
Figures 5(c) and (d) show the 275 hPa zonal wind distributions in early-summer and late-summer control experiments. In the early-summer experiment, the zonal wind displays a split-jet structure in the Eurasian continent. The Northeast Asia is located to the east of the midlatitude jet exit. The weak zonal wind here is in favor of energy accumulation (Nie et al 2022). The convergent wind in the jet exit region also facilitates the conversion of kinetic energy from mean flow to anomalies, thereby fostering the development of stationary waves (Lau and Lau 1992, Wang et al 2023). In the late-summer control experiment, the zonal wind shows a single subtropical jet structure in the Eurasian continent and the jet center moves westward. figures 5(e) and (f) display the corresponding quasi-stationary response of 275 hPa geopotential height anomalies and wave activity flux. Here the quasi-stationary component of geopotential height anomalies is calculated as the departures from the zonal-mean component. In the early-summer heating experiment (figure 5(e)), the geopotential height shows strong positive anomalies in the subpolar North Atlantic, weak negative anomalies in the Ural region and weak positive anomalies in the central and East Asia. The wave activity flux shows evident wave packets from subpolar North Atlantic to Asia. This is consistent with the observed circulation pattern associated with historical Northeast Asian heat extremes shown in figure 3(a). In the late-summer heating experiment (figure 5(f)), the geopotential height anomalies show much weaker amplitudes and the wave activity flux anomalies almost disappear. These results suggest that the Eurasian jet structure plays a key role in modulating the wave packet.
4. Conclusion and discussions
Northern Europe and Northeast Asia, which are climatologically mild and temperate during early summer, both witnessed record-breaking heat extremes in June 2023. With a focus on the subseasonal time scale, this study highlights that over one third of the early-summer historical Northeast Asian heat extremes are teleconnected with the Northern European warm anomalies through Eurasian Rossby wave packets. By systematically examining the formation mechanism of historical Northeast Asian heat extremes, we show that the Northeast Asian heat extremes are predominantly formed through horizontal temperature advection in the upstream, adiabatic warming in the downstream and diabatic heating in the central region. These processes are directly related to strong anticyclonic anomalies over Northeast Asia which are formed through midlatitude Rossby wave packets originating from the subpolar North Atlantic. The heatwaves in June 2023 were extreme events with unusually stronger wave-packet influence.
While the Rossby wave packets are important in affecting Northeast Asian heat extremes, their sensitivities to jet stream waveguide are not well understood in the literature. By employing an idealized AGCM, we show that Eurasian Rossby wave packets are dependent on the background jet structure. In early summer, the split-jet structure over Eurasia favors the Rossby wave packets propagating from Atlantic to Asia. Meanwhile, the Northeast Asia is located to the east of midlatitude jet exit. The weak wind here favors more energy accumulation. In contrast, during late summer, the Eurasian zonal wind shows a single jet and the jet center moves westward, which is not in favor of wave propagating reaching Asia.
Our results reveal that both the wave source over subpolar North Atlantic and the Eurasian jet stream structure are crucial for the formation of Northeast Asian heat extremes during early summer. This is of great practical importance for accurate prediction of heatwave amplitude and location. The wave source in subpolar North Atlantic can be resultant from active air-sea interaction (Nie et al 2019), and thus the status of spring and early-summer SST and atmospheric circulation anomalies are important for the initialization of early-summer heat extremes. For example, a negative North Atlantic Oscillation response to the sudden stratospheric warming in spring may reduce heat loss from the ocean and then lead to persistent warm SST anomalies over subpolar North Atlantic (Dunstone et al 2023). The Eurasian jet stream is determined by both transient eddy forcing and meridional thermal contrast (Messori et al 2021), and may manifest different characteristics during different periods of the whole summer. During early summer, the climatological midlatitude Eurasian jet extends from Northern Europe to Northeast Asia, which is in favor for Rossby wave train propagating along the jet. During late summer, however, the Eurasian midlatitude jet almost disappears, and thus not favor for wave packet propagation. Such different jet configuration may partially explain why the Northeast Asian heat extremes are most frequent in early summer and why it can be teleconnected with the Northern European hot days. Future studies are needed to figure out the relation of Eurasian jet stream variabilities and Rossby wave packets using a hierarchy of models with different complexity.
Acknowledgments
The authors thank the two anonymous reviewers for their constructive suggestions, which help improve the quality of the manuscript. This work was jointly supported by the National Key Research and Development Program of China (2021YFA0718000), NSF of China under Grant 42175075, U2242206, 41975102, the Joint Research Project for Meteorological Capacity Improvement (22NLTSY008, 22NLTSZ002), and Key Innovation Team of China Meteorological Administration (CMA2023ZD03).
Data availability statement
The ERA5 reanalysis is available at https://doi.org/10.24381/cds.bd0915c6. The GFDL dynamical core code can be found at www.gfdl.noaa.gov/idealized-spectral-models-quickstart/#Acquire_the_Source_Code_and_Runscripts.
All data that support the findings of this study are included within the article (and any supplementary files).
Supplementary data (0.7 MB PDF)