

Abstract
China is highly susceptible to landslides and debris flow disasters as it is a mountainous country with unique topography and monsoon climate. In this study, an efficient statistical model is used to predict the landslide risk in China under the Representative Concentration Pathway 8.5 by 2050, with the precipitation data from global climate models (GCMs) as the driving field. Additionally, for the first time, the impact of future changes in land use types on landslide risk is explored. By distinguishing between landslide susceptibility and landslide risk, the results indicate that the landslide susceptibility in China will change in the near future. The occurrence of high-frequency landslide risks is concentrated in southwestern and southeastern China, with an overall increase in landslide frequency. Although different GCMs differ in projecting the future spatio-temporal distribution of precipitation, there is a consensus that the increased landslide risk in China's future is largely attributed to the increase in extremely heavy precipitation. Moreover, alterations in land use have an impact on landslide risk. In the Huang-Huai-Hai Plain, Qinghai Tibet Plateau, and Loess Plateau, changes in land types can mitigate landslide risks. Conversely, in other areas, such changes may increase the risk of landslides. This study aims to facilitate informed decision-making and preparedness measures to protect lives and assets in response to the changing climate conditions.
Export citation and abstract BibTeX RIS

Original content from this work may be used under the terms of the Creative Commons Attribution 4.0 license. Any further distribution of this work must maintain attribution to the author(s) and the title of the work, journal citation and DOI.
1. Introduction
Landslides, a severe geological hazard, have resulted in substantial loss of human life and property over the years (Petley 2012, Kirschbaum et al 2016, Ward et al 2020). The expansion of human activities and population since the 1950s has led to increased disturbances in both climate system and geological environment, driven by development pursuits. As a result, geological disasters, particularly landslides and debris flows, are on the rise (Yin et al 2002, Huang 2007, Mukherjee et al 2018). China, whose diverse terrain encompasses 69.4% of the total land area, is highly susceptible to landslides, debris flows, and collapses (Cui 2014). Undoubtedly, comprehending disaster mechanisms and improving predictions are crucial for the development of effective prevention and mitigation strategies (Yu et al 2022).
Combining climate models with statistical or dynamic landslide models enables the projection of future landslide distribution patterns (Gariano et al 2017). Previous studies have indicated that some areas face an increased risk of landslides in the future. Kirschbaum et al (2020) applied the landslide hazard assessment for situational awareness with global climate models (GCMs) and found that the increase in heavy precipitation would exacerbate the likelihood of landslide hazards over high mountains in Asia. Focusing on two typical geomorphologic regions in Portugal, Araújo et al (2022) explored the extreme precipitation scenarios that could induce landslides for two future scenarios through combining regional climate models (RCMs) with precipitation thresholds, and found that models predicted an increase in extreme precipitation values under the Representative Concentration Pathway (RCP) 4.5 scenario while a decrease under the RCP 8.5 scenario. Mamadjanova and Leckebusch (2022) used the GCMs and cyclic weather types, and projected an elevated landslide risk in the foothills of Uzbekistan by the end of the century. In China, He et al (2019) pioneered the use of the RCM version 4.0, which projected an increased landslide risk in the mountainous regions in China. Subsequent studies have come to the same conclusion that the landslide risk area expands as future precipitation increases (Lin et al 2020, 2022).
Landslide susceptibility is determined by many factors, including the basic land surface characteristics such as slope, elevation, soil type, and land cover type (Sidle and Ochiai 2006, Daif and Lee 2002). Human activities have significantly impacted land use since the Industrial Revolution (Kalnay and Cai 2003, Foley et al 2005, Ma et al 2019), and this influence will persist in the foreseeable future (Hurtt et al 2020). Furthermore, temperature and precipitation under the global warming scenario will also affect vegetation growth and coverage (Zhang and Zhai 2022), potentially leading to a shift in land cover.
Previous studies on future landslide risks have mainly focused on changes in precipitation. However, the specific influence of land-use change on landslide risk remains poorly understood. Concurrently, the High-Resolution Model Intercomparison Project (HighResMIP) provides enhanced simulation capabilities (Haarsma et al 2016, Wang et al 2019, Hu et al 2021, Li et al 2022). The integration of high-resolution climate models and land-use changes in landslide risk assessment can provide valuable insights into future landslide patterns in China, complementing the findings of previous studies (He et al 2019, Lin et al 2020, 2022).
This study utilizes a landslide prediction and forecasting system (Wang et al 2016) to estimate future landslide risk in China. Firstly, the impact of changes in land use driven by social development scenarios on landslide susceptibility across various regions in China is investigated. Secondly, we use high-resolution GCMs to assess the spatio-temporal distribution of future landslide risk and compare the results among different climate models. Thirdly, we analyze the underlying reasons for changes in landslide risk by comparing future projections with historical data, considering factors such as precipitation patterns, land use practices, and environmental conditions.
The remainder of this paper is organized as follows. Section 2 presents the data and methods used in this study. Section 3 analyzes the results. Finally, the discussion and conclusions are provided in section 4.
2. Data and methods
2.1. Landslide projection framework
Landslides can be influenced by two categories of factors: basic factors (terrain, soil conditions, land cover, and hydrology) and triggering factors (precipitation, glacial melt water, earthquakes, and human activities) (Li et al 2008). This study specifically focuses on precipitation-induced landslides owing to their predictability. Effective landslide forecasts and estimates can be achieved by integrating land surface characteristics with triggering factors. In this study, an enhanced statistical model-based framework (Wang et al 2016) is utilized for landslide prediction and forecasting, as depicted in figure 1.
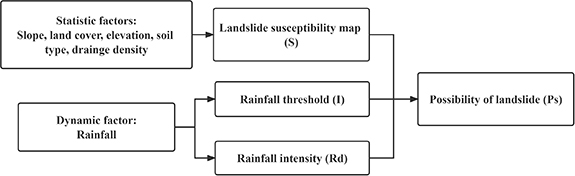
Figure 1. Conceptual framework of landslide projection.
Download figure:
Standard image High-resolution imageThe framework comprises two aspects. One is a landslide susceptibility map, which includes slope, land cover type, elevation, surface soil texture, and river network drainage density. The other is a statistical quantity, which includes actual precipitation intensity and precipitation threshold obtained through empirical statistical methods. The landslide susceptibility map is calculated using a multiple linear regression method, whose calculation formula is as follows:
where  represents the sensitivity corresponding to the susceptibility factor,
  represents the weight corresponding to the susceptibility factor
  ,
,  represents the number of
  th factor, and
  represents the total number of susceptibility factors. The assignments and detailed information on the susceptibility factors are shown in tables A1 and A2, and the basic geographic data is shown in figure A1.
When assessing the triggering effect of precipitation on landslides, both the intensity and duration of precipitation are important. If the average precipitation in a specific area surpasses a certain threshold over a particular period, it indicates the potential occurrence of landslides. Numerous studies have explored the intensity–duration (I–D) threshold formula for precipitation-triggered landslides (Caine 1980, Hong et al 2006, Li et al 2017, Peruccacci et al 2017, Wang et al 2021a). He et al (2020b) developed a suitable precipitation threshold for landslides in China, thereby improving the accuracy of landslide prediction models. The threshold formula proposed is as follows:

where  (in millimeters) is the precipitation threshold that triggers landslides for a single precipitation event and
  (in hours) is the duration of precipitation event. Note that this formula is the precipitation event duration (E–D) threshold formula, which can be converted to the I–D formula (Peruccacci et al
2017). In this study, the daily precipitation-driven model is used, and the precipitation duration (
(in hours) is the duration of precipitation event. Note that this formula is the precipitation event duration (E–D) threshold formula, which can be converted to the I–D formula (Peruccacci et al
2017). In this study, the daily precipitation-driven model is used, and the precipitation duration ( ) in the formula (2) is set to 24. Accordingly, the threshold for precipitation intensity is 2.18 mm h−1 (52.4 mm d−1). Combining the susceptibility value
  of the landslides, the final landslide risk can be characterized by the following formula:
where  is the actual precipitation intensity (mm h−1) during a single precipitation event,
  is the precipitation intensity threshold, which is equal to E divided by the duration of a precipitation event, and
  is the landslide risk index. The larger the value of
  , the higher the probability of landslide occurrence. In this study,
  indicates a possible occurrence of landslides, while
  indicates a very high probability of landslides.
2.2. Observed and modeled precipitation data
The China Meteorological Forcing Dataset (CMFD) (Yang and He 2019) that demonstrates good observational representativeness is utilized in this study (He et al 2020a, Ge et al 2023). For historical simulations and future precipitation estimations, the hist-1950 and highresSST-future experiments from the HighResMIP of the sixth Coupled Model Intercomparison Project (CMIP6) are adopted. These experiments encompassed models with horizontal resolutions of less than 50 km, as detailed in table 1.
Table 1. Information about three High-Resolution Model Intercomparison Project (HighResMIP) global climate models (GCMs).
| Model name | Modeling center | Horizontal resolution | Abbreviation (in the following text) | Variable | Temporal resolution | Forcing fields |
|---|---|---|---|---|---|---|
| CMCC-CM2-VHR4 | Euro-Mediterranean Centre, Italy | 25 km | CMCC | Precipitation | 1 d | RCP8.5 |
| FGOALS-f3-H | Chinese Academy of Sciences, China | 25 km | FGOALS | Precipitation | 1 d | RCP8.5 |
| HiRAM-SIT-HR | Research Center for Environmental Changes, Taiwan, China | 25 km | HiRAM | Precipitation | 1 d | RCP8.5 |
2.3. Historical and future land cover data
This study aims to analyze the changes in landslide risk under future land cover changes in China. The global land projection dataset for land-use and land-cover (LULC) based on plant functional types with a 1 km resolution under socio-climatic scenarios (Chen et al 2022) is used. This dataset was produced by integrating the top-down land demand constraints afforded by the CMIP6 official dataset and a bottom-up spatial simulations executed by cellular automata. Based on the climate data, the land types in the simulated products were further divided into 20 plant functional types. Moreover, this dataset also released the results of the International Geosphere-Biosphere Program land classification, which well meets the requirements of susceptibility maps in landslide statistical models for input data. The evaluation on LULC has proven that LULC has good accuracy in comparison with historical land use (ESA 2017) and future simulation data (Popp et al 2017). To align with GCMs, this study utilizes land use data from shared socioeconomic pathways (SSPs) SSP5-8.5 scenario.
2.4. Methods
This study is conducted at grid scale in China. Initially, the landslide susceptibility maps are calculated at a horizontal resolution of 1 km, with the specific data files detailed in table A1. The study consists of the following steps.
Firstly, this study validates the effectiveness of the landslide prediction framework. The period from 2001 to 2015 is taken as the historical period, and the CMFD daily precipitation data is input into the statistical model to simulate the historical distribution of landslides.
Secondly, a bias correction is applied to the HighResMIP model data to mitigate the systematic bias of the GCMs compared with observations (Piani et al 2010, Yang et al 2010). Quantile mapping (QM) has been demonstrated to effectively reduce model bias and improve mean values, interannual variability, and extreme event biases (Tong et al 2017, Han et al 2018). As landslides are often triggered by heavy precipitation, this study employs the QM to correct the biases in the HighResMIP precipitation data using the CMFD historical data. This method computes the cumulative distribution functions for the observed and simulated values separately and constructs a transfer function between them as follows:

where  represents the transfer function,
  is the original value of the model, and
  is the corrected value of the model.
To predict the spatial distribution pattern of future landslide risk in China, two time periods (2021–2035 and 2036–2050) are considered. The land cover under the SSP5-8.5 scenario in 2035 and 2050 represents the future land cover scenario, while other factors remain constant. The bias-corrected precipitation data from each HighResMIP is input into the model, and the output results are compared with the historical base period (2001–2015) to analyze the changes in future landslide risk. Nine sub-regions in China are studied based on climate and geographical features, referencing the Resource and Environmental Science and Data Center (www.resdc.cn/), as depicted in figure 2. This approach enables a better understanding of the spatial heterogeneity of future landslide risk in China.
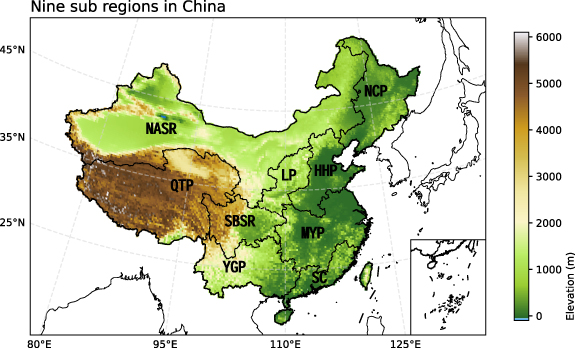
Figure 2. Nine sub-regions and elevation in China, including Northeast China Plain (NCP), Yunnan-Guizhou Plateau (YGP), Northern arid and semiarid region (NASR), Southern China (SC), Sichuan Basin and surrounding regions (SBSR), Middle-lower Yangtze Plain (MYP), Qinghai Tibet Plateau (QTP), Loess Plateau (LP), and Huang-Huai-Hai Plain (HHP).
Download figure:
Standard image High-resolution imageTo assess landslide risk at the spatial scale of the susceptibility map, precipitation data was evenly interpolated to a horizontal resolution of 1 km. Additionally, to visualize the spatial patterns of landslide risk clearly, the results are plotted on a 0.25° × 0.25° grid. Each grid represents the average value of landslide risk at a 1 km × 1 km spatial scale.
3. Results
3.1. Validation of landslide simulation
The effectiveness of the landslide statistical model is validated by overlaying an inventory of 593 landslide points recorded from 2001 to 2015 onto the layer of historical landslide simulation (figure 3). The simulation of historical landslides is driven by the CMFD daily precipitation data using a statistical model. Grid points with  indicate the areas with potential landslide occurrence, and the frequency sum is calculated over multiple years. Analysis of the recorded landslide inventory reveals that the landslides are mainly distributed in the Sichuan Basin and surrounding regions (SBSR), as well as in the Middle-lower Yangtze Plain (MYP), Yunnan-Guizhou Plateau (YGP), and Southern China (SC). Despite potential high false-positive rates due to incomplete landslide inventory and historical monitoring, the model successfully simulates 503 landslides during the selected historical period (figure 3). Consequently, this statistical model can be deemed suitable for simulating the spatial and temporal pattern of landslide risk.

Figure 3. Landslide frequency simulation and inventory in China from 2001 to 2015, where black triangles represent landslide records that are successfully simulated by the model and red triangles represent landslide records that are not captured by the model.
Download figure:
Standard image High-resolution image3.2. Performance assessment of bias-corrected HighResMIP data in the historical period
This study utilizes the simulation data from three HighResMIP models. To assess the effectiveness of model simulation and the impact of bias correction, the daily precipitation data from 2001 to 2015 before and after bias correction are respectively input into the statistical model. The results for  and
and  are calculated, and the spatial correlation coefficient (SCC) is used to evaluate the consistency of model simulation with observation data. Figures 4 and 5 display the results for
  and
and  , respectively. The original model data from each model captures the concentrated distribution of landslides, with the SCC being above 0.5 for
  . For
. For  , except for the model of the Euro-Mediterranean Center for Climate Change (CMCC), the SCCs of the other two models with observation are around 0.6. However, compared with the observations (figure 3), the two models generally overestimate the landslide frequency. After bias correction, the model simulation results align closely with the observation, with the SCC being above 0.9. Consequently, the study will employ the bias-corrected model simulation to estimate future landslide risk.

Figure 4. Simulated landslide distribution in China ( ) by three HighResMIP models over the period from 2001 to 2015. Subplots (a)–(c) show the results of the output of the raw model data, while (d)–(f) depict the corrected results using quantile mapping (QM). The spatial correlation coefficient (SCC) of landslide simulation with the observation (figure 3) is indicated in the title of each subplot.
Download figure:
Standard image High-resolution image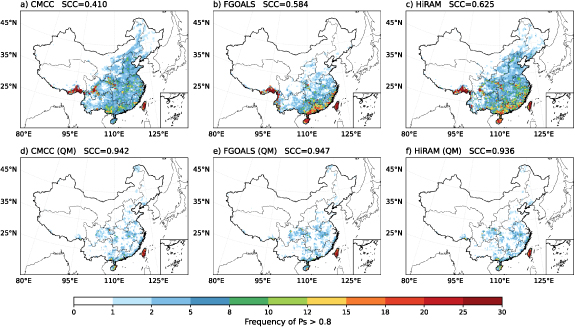
Figure 5. Same as figure 4, but for  .
.
Download figure:
Standard image High-resolution image3.3. Projection of landslide susceptibility and distribution in the near future
Calculating landslide susceptibility ( ) for future and historical periods enables the analysis of potential changes resulting from land use. As depicted in figure 6, the findings reveal high susceptibility areas in the southeastern Qinghai Tibet Plateau (QTP), the southwestern region surrounding the SBSR, and the Tianshan, Altai, and Kunlun Mountains in NASR. Some areas with high susceptibility are also observed in the MYP and SC. Analyzing susceptibility changes in the future periods reveals both increases and decreases in different regions, but the overall change is not significant. Increased susceptibility is witnessed in the southwestern, central, southern, and eastern parts of China, while decreased susceptibility is found in the northeastern and northern parts of China, the Huang-Huai-Hai plain (HHP), and the southern Himalayan Mountains of the QTP.

Figure 6. Landslide susceptibility in (a) 2015, (b) 2035, (c) and 2050. Subplots (d) and (e) show the susceptibility value for 2035 and 2050 minus 2015, respectively.
Download figure:
Standard image High-resolution imageThe bias-corrected HighResMIP model precipitation is used in the statistical model to calculate the  values for two future periods, 2021–2035 and 2036–2050. Subsequently, the results for
  and
and  are derived. The results are compared with the historical period, as shown in figures 7 and 8. For the possibility of either landslides (
 ) or high-risk landslides (
 ), all three models show an obvious increasing trend in estimating the landslide risk for China in the future. Specifically, the Flexible Global Ocean-Atmosphere-Land System model (FGOALS) demonstrates the most obvious increase, exhibiting a large increase in the frequency of landslide risk in the surroundings of the SBSR, HHP and Northeast China Plain, as well as in most southeastern areas of MYP and SC (except Hainan Island). The frequency of
  generally increases by more than ten times (figures 7(b) and (e)), while the frequency of
  also increases by up to eight times in many regions (figures 8(b) and (e)). In contrast, the CMCC and High Resolution Atmospheric Model (HiRAM) exhibit a high degree of similarity in estimating the future landslide risk. The areas where the landslide risk increases are mainly distributed in the central, eastern, and southern parts of China.
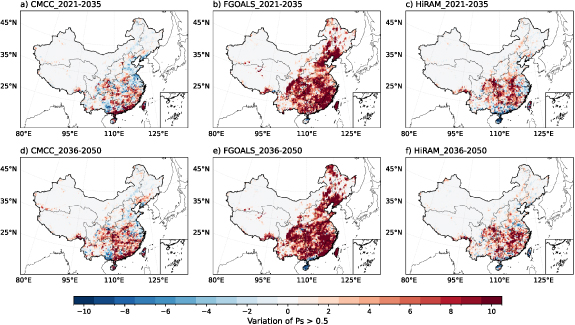
Figure 7. Variations in the frequency  for HighResMIP models. Subplots (a)–(c) show the variations of 2021–2035 compared to 2001–2015, while (d)–(f) depict the variations of 2036–2050 compared to 2001–2015.
Download figure:
Standard image High-resolution image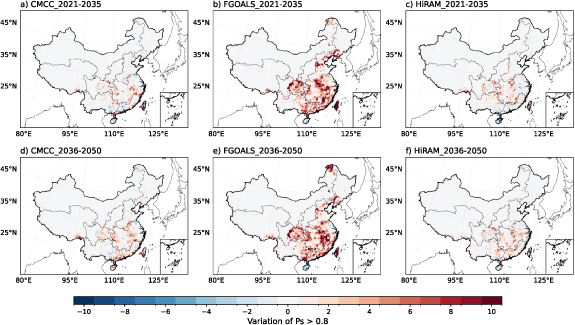
Figure 8. Variations in the frequency  for HighResMIP models. Subplots (a)–(c) show the variations of 2021–2035 compared to 2001–2015, while (d)–(f) depict the variations of 2036–2050 compared to 2001–2015.
Download figure:
Standard image High-resolution imageThe geographic zoning layer is overlaid with the map of future estimates from the HighResMIP model to analyze the changes in future landslide risk across different regions. The change rate of landslide risk frequency is calculated for each region, focusing on  for the period of 2036–2050 in comparison to the historical period (2001–2015). Furthermore, the results of future landslide risk are computed based on unchanged land use scenarios using the landslide susceptibility values of 2015. These results are illustrated in table 2 and figure 7. Overall, the models indicate an increasing trend in future landslide risk estimations for China in the near future. The model of FGOALS exhibits the highest increase, with the frequency of
  rising by 121% and 117% under the changing and unchanged land use scenarios, respectively. The models of CMCC and HiRAM exhibit an increase of approximately 30%. The change in landslide risk due to land cover varies across regions. Elevated landslide susceptibility contributes approximately 5%–10% to the incremental landslide risk in SC, MYP, and YGP, while the land cover changes reduce the landslide risk in HHP, Loess Plateau, and QTP.
Table 2. Variability in the frequency of  across different regions in China, where 'nLC' represents the scenarios when land use remains unchanged.
| CMCC | CMCC (nLC) | FGOALS | FGOALS (nLC) | HiRAM | HiRAM (nLC) | |
|---|---|---|---|---|---|---|
| China | 32.22% | 29.46% | 121.16% | 117.68% | 34.58% | 31.64% |
| HHP | 19.10% | 21.34% | 134.07% | 137.17% | 18.95% | 20.91% |
| LP | 13.14% | 14.69% | 119.55% | 121.30% | 41.42% | 42.52% |
| NCP | 62.73% | 58.30% | 450.49% | 438.06% | 47.45% | 43.59% |
| NASR | 62.22% | 61.09% | 477.17% | 470.29% | 47.34% | 46.80% |
| QTP | 79.06% | 83.89% | 150.10% | 155.25% | 67.06% | 71.10% |
| SBSR | 18.15% | 18.34% | 85.20% | 85.02% | 34.01% | 33.98% |
| SC | 46.61% | 39.41% | 71.47% | 64.05% | 10.78% | 4.80% |
| MYP | 29.22% | 25.83% | 91.72% | 87.35% | 52.51% | 47.70% |
| YGP | 20.66% | 17.21% | 88.33% | 85.23% | 31.95% | 28.72% |
3.4. Attribution of future changes in landslide risk
The simulation results of different models exhibit some variations, as analyzed in the previous section. The future precipitation characteristics from the three models are analyzed to explain the differences in the model simulation results and the underlying reasons for the future changes in landslide risk. Three annual precipitation indexes calculated from daily data are selected to compare the future changes in precipitation characteristics of each model with those in the historical period. They are the total precipitation of wet days (PRCPTOT), the number of heavy precipitation days (the days with daily precipitation exceeding 20 mm, R20mm), and the frequency of the daily precipitation exceeding the threshold of 52.4 mm (Rth).
Figures 9–11 depict the spatial distribution and changes in the multi-year average values of the three indexes for the historical period (2001–2015) and the future period (2036–2050). For PRCPTOT and R20mm, the CMCC model shows a decrease in the future period in East China, while the FGOALS model exhibits a noticeable decrease in the future period in the entire Southeast China. The HiRAM model shows an increase in PRCPTOT and R20mm in China mainland except for Hainan Island and Taiwan. The HiRAM simulated precipitation patterns correspond to the simulation results of landslide risk. Specifically, the reduced future landslide risk estimated by the CMCC model in certain areas of YGP aligns with the decrease of PRCPTOT and R20mm (figures 7(a), (d), 9(c) and 10(c)). The decrease of HiRAM-estimated future landslide risk in SC especially in Hainan corresponds to a reduction in precipitation (figures 7(c), (f), 9(i), 10(i) and 11(i)). The simulations of Rth by all three models are relatively consistent. In central-eastern China, the frequency of extremely heavy precipitation is increasing, with the FGOALS model exhibiting the highest increase. This explains why the landslide risk estimated by these models is generally increasing in Southeast China.

Figure 9. The multi-year averaged PRCPTOT in (left column) the historical period and (middle column) the future period of HighResMIP models, as well as their difference (right column; the middle column minus the left column).
Download figure:
Standard image High-resolution image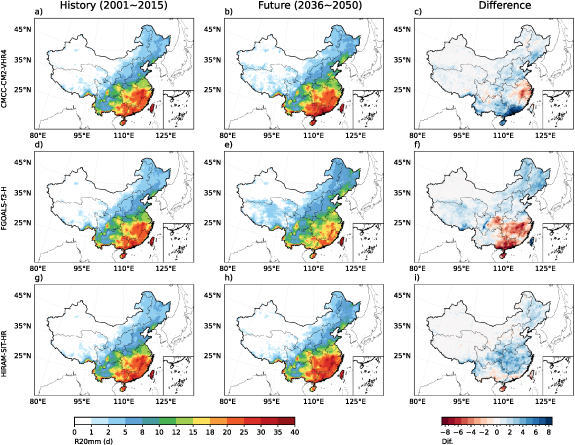
Figure 10. The multi-year averaged R20mm in (left column) the historical period and (middle column) the future period of HighResMIP models, as well as their difference (right column; the middle column minus the left column).
Download figure:
Standard image High-resolution image
Figure 11. The multi-year averaged Rth in (left column) the historical period and (middle column) the future period of HighResMIP models, as well as their difference (right column; the middle column minus the left column).
Download figure:
Standard image High-resolution imageCombined with the discussions in section 3.3, it can be inferred that much of the general increase in future landslide risk in China is attributed to the changes in future precipitation. The model simulations share commonalities in the increase of extremely heavy precipitation in southeastern China and in the increase of total precipitation in northeastern and northern China. The changes in land use impact landslide susceptibility and indirectly alter landslide risk, which varies across different geographic regions, although this 'contribution' is not as substantial as the changes in precipitation.
4. Discussion and conclusions
In this study, we assess the future landslide risk in China using a prediction framework based on the HighResMIP precipitation and land cover data. Focusing on the SSP5-8.5 scenario, we find a general increase in landslide risk, which is consistent with previous studies (He et al 2019, Lin et al 2020, 2022). The main results are as follows.
We introduce a new approach to assess the landslide disaster risk by isolating landslide susceptibility from the driving factors. Research indicated that with climate warming, the increase in atmospheric water vapor content will play a dominant role in enhancing future precipitation variability (Zhang et al 2021). This implies that extreme precipitation events in China will intensify, which is consistent with the results from climate models (Qin et al 2021). This aligns with our research findings, which suggest that by 2050, the intensification of extreme heavy precipitation will generally increase landslide risks in China. Furthermore, the changes in land use will also impact landslide risks. Particularly in different regions, the transformation of land types can either increase or decrease landslide risks, albeit less significantly than precipitation.
The inconsistency in landslide risk estimation among the models can be attributed to the differences in climate models themselves. Liang et al (2023) attributed disparities in future precipitation projections among the HighResMIP to the model horizontal and vertical resolutions. By using higher vertical resolution models, their study projected decreased precipitation in SC, which aligns with our research findings. However, Yu et al (2023), using multi-model ensembles of CMIP6 (not HighResMIP), found increased precipitation in southeastern China by the mid-century under the SSP5-8.5 scenario. The uncertainty from climate models poses a challenge in future disaster assessment. We recommend using multiple models to comprehensively understand potential disaster scenarios, particularly utilizing numerous high-resolution RCMs (Tapiador et al 2020). Additionally, conducting multi-model evaluations is an essential step, as the ensemble average of selected and optimized multi-model sets can effectively improve model errors (Zhou and Han 2018, Ward et al 2020, Wang et al 2021b, Yang et al 2021, He et al 2022). Incorporating this method of improving model accuracy into disaster assessment work would be a more effective approach for policymakers.
The landslide susceptibility map is calculated at a horizontal resolution of 1 km, limiting the precision of disaster risk estimation. As the prediction work is conducted at a national scale, increasing the spatiotemporal resolution results in significantly higher computational demands. Therefore, employing a hierarchical strategy (Günther et al 2013) may be a preferable approach in practical sensitivity studies or disaster forecasting. This strategy involves utilizing coarser spatial resolutions (e.g. 0.25°× 0.25°) at the national or continental scale and subsequently employing finer grids for analysis in more vulnerable regions. This allows for a trade-off between computational efficiency and prediction accuracy. Additionally, landslides are complex dynamic processes that statistical models struggle to capture. High-precision landslide prediction and forecasting still rely on physical models, which have been applied and validated in many regions (e.g. Lacasta et al 2015, Alvioli and Baum 2016, Huang et al 2022, Jiang et al 2023, Liu and He 2023). This requires a comprehensive inventory of landslide hazards, including detailed data on terrain, soil, rock types, vegetation root systems, etc. Nevertheless, this demands substantial human and financial resources, and the efficiency of running physical models relies on computer performance. The framework we envision for landslide or other hydrogeological hazard risk prediction could utilize efficient statistical models on a large scale (national or continental), followed by physical models for accurate prediction of vulnerable areas.
Besides direct casualties and economic losses, landslides can cause vegetation destruction, disrupt existing biodiversity patterns, and trigger ecological succession (Yunus et al 2020, Rasigraf and Wagner 2022), leading to some changes in ecosystem services within a specific area (Chen et al 2021). Landslides are also closely linked to geomorphological evolution, landscape changes, and material transport in rivers. Landslides contribute sediment to river systems, causing short-term alterations in suspended concentrations in river transport (Juez et al 2021). In future research, we can develop integrated modeling approaches that incorporate ecological, geological, and hydrogeological factors. This requires combining data and knowledge from different disciplines to establish comprehensive models that simulate landslide dynamics, assess broader consequences (such as changes in biodiversity, hydrological systems, and geomorphology), and provide insights for strategies to mitigate disaster risk (Löbmann et al 2020). It is also important to facilitate the integration of interdisciplinary knowledge into policy and decision-making processes (Wang et al 2024). This may involve engaging decision-makers, stakeholders, and experts from various disciplines in collaborative discussions, workshops, and review processes to ensure that the broader consequences of landslides are considered when developing comprehensive strategies to reduce disaster risk.
Acknowledgments
This paper is Supported by the National Natural Science Foundation of China (Grant Nos. 41991283 and 42175170) and supported by the National Key Scientific and Technological Infrastructure project "Earth System Science Numerical Simulator Facility" (EarthLab). We thank Nanjing Hurricane Translation for reviewing the English language quality of this paper.
Data availability statement
The data that support the findings of this study are openly available at the following URL/DOI: https://github.com/ElenathGe/Ge_SL/tree/7ea4d14ebe8beb2d61f9baf750d09bb45d035664/ResearchData_LandslideProjection.
Authorship contributions
Shilong Ge: methodology, software, formal analysis, visualization, writing—original draft. Jun Wang: conceptualization, methodology, writing—review & editing, funding acquisition. Chao Jiang: conceptualization, methodology, writing—review & editing.
Conflict of interest
The authors declare that they have no known competing financial interests or personal relationships that could have appeared to influence the work reported in this paper.
Appendix:

Figure A1. Basic geographic data used in landslide susceptibility map: (a) Slope in degrees calculated from the DEM. (b) Land cover type in 2015. The color-filled map indicates IGBP land classification, and the land cover type represented by each ordinal number can be referred to table A2. (c) Soil classification based on drainage capacity. Smaller numbers indicate longer soil exposure to wetter environments; (d) Relative density of first- to third-order rivers in China.
Download figure:
Standard image High-resolution image
Table A1. Input parameters, assignments and data sources for the landslide susceptibility map.
| Parameters | Assignments | Data sources (Data URL) |
|---|---|---|
| Slope | 0.45 | catalog.data.gov/dataset/srtm30-global-1-km-digital-elevation-model-dem-version-11-land-surface |
| Land use | 0.25 | geosimulation.cn/download/1km_LULC_SSP_RCP/ |
| Elevation | 0.1 | catalog.data.gov/dataset/srtm30-global-1-km-digital-elevation-model-dem-version-11-land-surface |
| Soil type | 0.1 | https://doi.org/10.11888/Soil.tpdc.270578. |
| Drainage density | 0.1 | (www.resdc.cn/DOI), 2018. DOI: 10.12078/2018060101 |
Table A2. Landslide susceptibility assignment for land use types.
| IGBP code | IGBP classification | Assignments |
|---|---|---|
| 0 | Undefined | 0 |
| 1 | Evergreen needleleaf forests | 0.1 |
| 2 | Evergreen broadleaf forests | 0.1 |
| 3 | Deciduous needleleaf forests | 0.2 |
| 4 | Deciduous broadleaf forests | 0.2 |
| 5 | Mixed forests | 0.3 |
| 6 | Closed shrublands | 0.4 |
| 7 | Open shrublands | 0.4 |
| 8 | Woody savannas | 0.5 |
| 9 | Savannas | 0.5 |
| 10 | Grasslands | 0.6 |
| 11 | Permanent wetlands | 0.1 |
| 12 | Croplands | 0.3 |
| 13 | Urban and built-up lands | 0.1 |
| 14 | Cropland/natural vegetation mosaics | 0.8 |
| 15 | Snow and ice | 0 |
| 16 | Barren sparse vegetation | 0.9 |
| 17 | Water | 0 |