


Abstract
Long-term exposure to ambient ozone (O3) is associated with excess respiratory mortality. Pollution emissions, demographic, and climate changes are expected to drive future ozone-related mortality. Here, we assess global mortality attributable to ozone according to an Intergovernmental Panel on Climate Change (IPCC) Shared Socioeconomic Pathway (SSP) scenario applied in Coupled Model Intercomparison Project Phase 6 (CMIP6) models, projecting a temperature increase of about 3.6 °C by the end of the century. We estimated ozone-related mortality on a global scale up to 2090 following the Global Burden of Disease (GBD) 2019 approach, using bias-corrected simulations from three CMIP6 Earth System Models (ESMs) under the SSP3-7.0 emissions scenario. Based on the three ESMs simulations, global ozone-related mortality by 2090 will amount to 2.79 M [95% CI 0.97 M–5.23 M] to 3.12 M [95% CI 1.11 M–5.75 M] per year, approximately ninefold that of the 327 K [95% CI 103 K–652 K] deaths per year in 2000. Climate change alone may lead to an increase of ozone-related mortality in 2090 between 42 K [95% CI −37 K–122 K] and 217 K [95% CI 68 K–367 K] per year. Population growth and ageing are associated with an increase in global ozone-related mortality by a factor of 5.34, while the increase by ozone trends alone ranges between factors of 1.48 and 1.7. Ambient ozone pollution under the high-emissions SSP3-7.0 scenario is projected to become a significant human health risk factor. Yet, optimizing living conditions and healthcare standards worldwide to the optimal ones today (application of minimum baseline mortality rates) will help mitigate the adverse consequences associated with population growth and ageing, and ozone increases caused by pollution emissions and climate change.
Export citation and abstract BibTeX RIS

Original content from this work may be used under the terms of the Creative Commons Attribution 4.0 license. Any further distribution of this work must maintain attribution to the author(s) and the title of the work, journal citation and DOI.
1. Introduction
Ambient ozone (O3) is a key secondary pollutant detrimental to human health and ecosystems [1]. Chronic exposure to ozone is associated with excess mortality and a decrease in life expectancy mainly related to respiratory diseases [2]. In the absence of climate change mitigation and with only weak air pollution control, relative to present day conditions ground-level ozone in most regions will increase through 2050 and then decrease or level off after 2050 and towards 2100, but in certain regions may continue to increase through 2100 [3]. Emerging climate change is expected to impact near-surface ozone levels through physical and chemical changes affecting meteorological conditions and atmospheric chemical processes [4].
Under the high-emissions Shared Socioeconomic Pathway 3 (SSP3) scenario (regional rivalry) continued population growth is assumed until 2100, being the highest among SSPs, associated with environmental challenges, relatively low migration efforts, and slow urbanization rates [5, 6]. Within this socioeconomic framework characterized by limited international extraversion and implementation of climate policies, the SSP3-7.0 emissions scenario presents 'no-additional-climate-policy' with strong greenhouse gas emissions, i.e. a doubling of CO2 emissions overall, weak air pollution control, and significant increases in temperature up to about 3.6 °C by the end of the century [3, 7, 8].
The fate of tropospheric ozone in a future climate depends on changes of anthropogenic and natural emissions, and climate affecting key physical and chemical processes for ozone, such as its chemical production and loss, deposition, and stratosphere-troposphere exchange (STE) [9–12]. Ozone near the surface is projected to increase until 2050 in the 'no-additional-climate-policy' scenarios SSP3-7.0 and SSP5-8.5, with increases reaching and partly exceeding 5 ppb over land areas [3]. In agreement with the Intergovernmental Panel on Climate Change (IPCC) 5th Assessment Report (AR5) [13], the IPCC 6th Assessment Report (AR6) [3] indicates a decrease of ground level ozone in a warmer climate (climate change benefit) under SSP3-7.0 over oceans and unpolluted continental regions, due to enhanced ozone destruction associated with higher water vapor abundances. In contrast, over regions with high anthropogenic and/or natural ozone precursor emissions, surface ozone is projected to increase in the future (climate change penalty), with a rate ranging regionally from 0.2 to 2 ppb per °C [3, 14].
Morbidity and mortality are strongly influenced by environmental stressors, known as the exposome [15], with air pollution being an important component. Mortality attributable to ambient ozone pollution (from long-term exposure) has been the subject of research over the last two decades [16–25]. Recently, the Global Burden of Disease (GBD) 2019 study reported 365 K [95% CI 175 K–574 K] deaths attributable to ozone for the year 2019 accounting for mortality from chronic obstructive pulmonary disease (COPD) only [26], while Malashock et al [27] reported 423 K ozone-related deaths for the same year accounting for all respiratory diseases. West et al [28] investigated the impact of future ozone concentrations under the Special Report on Emissions Scenarios (SRES) on excess mortality for the year 2030. Silva et al [29], using an ensemble of global chemistry–climate models, reported an increase in ozone-related mortality for 2100 of 316 K owing to ozone changes under the high greenhouse gas Representative Concentration Pathway (RCP) scenario RCP8.5, while the increase from climate change alone was found to be 43.6 K for 2100 relative to 2000 [30]. Regarding the health-related economic impact of future ozone air-pollution, the costs associated with global ozone pollution by 2050 may amount to $580 billion [31]. Recently, Turnock et al [32] in a single-model study explored the air pollution health burden under different future scenarios. To the best of our knowledge, multi-model studies on future ozone-related mortality under the high-emissions scenario SSP3-7.0 have not been reported at global, regional, and national levels.
This study estimates the future ozone-related excess mortality under the high-emissions SSP3-7.0 scenario, as well as contributions from population, emissions, and climate changes. The mortality calculations are performed applying the latest GBD ozone-relative risk factors [26], baseline mortality rates (BMR) per country from the GBD 2019 database, population projections for the SSP3-7.0 scenario from the Socioeconomic Data and Applications Center (SEDAC), and bias-corrected ozone concentrations from three Earth System Models (ESMs) from the Coupled Model Intercomparison Project Phase 6 (CMIP6).
2. Data and methods
2.1. Data
We used ozone data from one historical (experiment 'histSST') and two future simulations (experiments 'ssp370SST' and 'ssp370pdSST') from three IPCC CMIP6 ESMs, namely EC-Earth3-AerChem, GFDL-ESM4, and UKESM1-0-LL. Detailed information on the three ESMs is provided in the supplement (S1–S3). The 'histSST' experiment (1850–2014) used prescribed annually varying monthly sea surface temperatures (SSTs) derived from coupled-ocean historical simulations (experiment 'historical'). The 'ssp370SST' experiment (2015–2100) is driven by time-varying SSTs from 'ssp370' CMIP6 coupled-ocean simulations to represent climate change with future anthropogenic emissions following the SSP3-7.0 scenario. The 'ssp370pdSST' experiment (2015–2100) prescribes a present-day (2005–2014) climatology for SSTs from the coupled-ocean 'historical' simulation, thus representing present-day climate conditions. Conceptually, 'ssp370pdSST' simulations represent the effect of emission changes only while 'ssp370SST' simulations represent the combined effects of climate and emission changes. The difference between 'ssp370SST' and 'ssp370pdSST' isolates and captures the climate change signal for the ssp370 pathway [3, 14, 33, 34]. The selection of the three ESMs is based on their output of ground-level ozone concentrations, essential for calculating the human health-relevant ozone season daily maximum 8-hour mixing ratio (OSDMA8) metric. Present-day and projected future ozone concentrations were bias-corrected with respect to the gridded ozone dataset from data fusion of observations and models of DeLang et al [35] following the delta-method [36] (S4 in supplementary information).
National BMR of COPD per age category for 1990–2009 were obtained from the GBD 2019 (https://vizhub.healthdata.org/gbd-results/) [37]. Moreover, COPD mortality for the year 2000 was also obtained to compare our mortality estimates for the year 2000 (outside the SSP3 projection) with that of the GBD 2019 study. Gridded data of population under the SSP3 for the period 2010–2090 every 10 years and for the baseline year 2000 were adopted from the SEDAC (https://sedac.ciesin.columbia.edu/data/set/popdynamics-1-8th-pop-base-year-projection-ssp-2000-2100-rev01) on a 0.125° x 0.125° grid [6, 38]. Population data per age category under the SSP3 scenario for each country were obtained from the International Institute for Applied Systems Analysis (IIASA) (https://tntcat.iiasa.ac.at/SspDb/dsd?Action=htmlpage&page=20) [39, 40], and the fractions of the age categories for each country were distributed in the country-gridded population data. Since data on national populations per age category in 2000 were not available, these were assumed to be equal to 2010. Finally, the national boundaries dataset was obtained from SEDAC GPWv4 (Gridded Population of the World version 4) at a resolution of 2.5ʹ (https://sedac.ciesin.columbia.edu/data/set/gpw-v4-national-identifier-grid-rev11) [41], converted with QGIS3 (Quantum Geographic Information System v.3) (www.qgis.org) at a 0.125° × 0.125° resolution to match that of population data.
2.2. Mortality calculations
We estimated the COPD-related excess mortality attributable to ozone pollution following the methodology of the latest GBD 2019 study [26]. Excess mortality is defined as the number of deaths that would not have occurred in the defined year in the absence of exposure. Further, ozone-induced excess COPD mortality Mac(x, y) for an age category ac, at a given place (with x and y coordinates), is expressed as the product of the attributable fraction (percentage of deaths from COPD attributable to ozone pollution) AF(x, y), the baseline mortality rate (ratio of COPD mortality to population) BMRac at country level for age category ac, and the population of that age category ac POPac(x, y).

Summing up the mortalities of all age categories results in a total COPD mortality M (x, y).
We consider only adults of 25 years and older in 5-years age categories, to be consistent with calculations in previous studies [29, 42]. The calculation of attributable mortality in different spatial contexts (national, regional, and global) Msc is derived as the sum of the mortalities of spatially inclusive points.
AF is calculated based on the relative risk RR(x,y) for ozone-related COPD mortality
using a log-linear function for the relative risk (or hazard ratio)

where X is the ozone concentration metric (OSDMA8) and TMREL is the theoretical minimum risk exposure level under which ozone is not considered as being harmful for human health. For TMREL we adopted the value of 32.4 (29.1–35.7) ppb, as applied in GBD 2019 study. The β parameter value(s) arise from the RR per 10 ppb of ozone (OSDMA8) value of 1.063 (1.029–1.098) taken from the GBD 2019 study [26] which was estimated from a meta-regression of five cohorts studies.
Mortality calculations were performed for the years 2000–2090 at 10-year intervals to represent the 20 year periods from 1990–2009 to 2080–2099. Population data for the exact years were used, while for the BMR the average of the 1990–2009 baseline period was applied. This approach cannot fully represent future ozone-related mortality, however, it serves the purpose of isolating the impact of ozone exposure and population changes on future COPD mortality. Temporal averages of bias-corrected IPCC-CMIP6 ozone (OSDMA8) concentrations were used for the corresponding 20-year periods (S4 in supplementary information). The total COPD mortality was derived by summing the mortalities for age categories of 25 years and older. Mortality at the country and regional levels (following the GBD definition) was determined by aggregating the mortality within each country or region. To quantify the effect of ozone (anthropogenic emissions, climate change) and population changes on mortality, two sensitivity calculations were performed, one with the population set to 2000 and one with the ozone set to 2000, respectively. A detailed description of the applied experiments and mortality calculations, as well as how the parameters contributions are estimated is provided in figure S1 of the supplementary information. Finally, we performed attributable mortality calculations by applying the minimum BMRs of all age categories (figure S2 in supplementary information), i.e. in countries with relatively highest living and health care standards, with population and ozone varying in time. Minimizing the BMR represents a hypothetical optimization of the exposome for all people worldwide, though excluding ozone pollution and climate change influence, assuming that humanity could potentially achieve the currently prevailing highest levels of health care, nutritional and living conditions.
3. Results
First, we evaluate our global ozone-related mortality estimates comparing them to the GBD2019 study for the year 2000, for reference, indicating that our mortality results (327 K [95% CI 103 K–651 K] deaths per year) are close to those reported by the GBD2019 (281 K [95% CI 122 K–431 K] deaths per year), being well-within the 95% CI (figure S3 in supplementary information). When considering the combined effects of changes in ozone levels and population, a strong increase in ozone-related mortality is projected by the end of the century compared to the year 2000 for nearly all regions worldwide. Globally, this increase ranges between 2.46 M [95% CI 0.57 M–4.35 M] and 2.8 M [95% CI 0.72 M–4.87 M] deaths per year among the three ESMs. Regionally, in absolute numbers, the largest increase in ozone-related mortality for the year 2090 compared to 2000 is found in South Asia, ranging between 1.36 M [95% CI 0.36 M–2.37 M] and 1.51 M [95% CI 0.42 M–2.59 M] deaths per year (table 1). The next largest increase is found in East Asia, between 0.81 M [95% CI 0.23 M–1.38 M] and 0.96 M [95% CI 0.31 M–1.62 M] deaths per year. In terms of mortality per million population, an increase between 765 [95% CI 222–1309] and 909 [95% CI 290–1529] deaths per million per year is projected for East Asia and between 366 [95% CI 100–633] and 409 [95% CI 119–699] deaths per million per year for South Asia (table 1). Although in most regions the mortality estimates among the three ESMs agree reasonably well, they exhibit discrepancies over regions where climate change is significant contributor of mortality change and is also highly variant among the ESMs (e.g. Central Europe and Eastern Europe). The time evolution of excess mortality change (compared to the year 2000) from 2000 to 2090 indicates different change rates among the regions, with mortality increase peaking in 2090 in most of them (figure S4 in supplementary information). At a country level, the most significant increases are found for India (1.1 M [95% CI 0.33 M–1.87 M] to 1.22 M [95% CI 0.39 M–2.05 M] deaths per year) and China (0.79 M [95% CI 0.24 M–1.35 M] to 0.95 M [95% CI 0.31 M–1.59 M] deaths per year), followed by Pakistan and Bangladesh (figure 1, table S1 in supplementary information). Climate change alone is projected to increase global ozone-related mortality by 42 K [95% CI −37 K–122 K] to 217 K [95% CI 68 K–367 K] deaths per year (9 K [95% CI −7 K–24 K] to 53 K [95% CI 8 K–97 K] for 2000 population). In the regional context, the climate change signal in ozone-related mortality varies significantly between the three ESMs, except for regions close to strong pollution sources (e.g. China and India) where increases in ozone-related mortality are projected (figure S5 in supplementary information).

Figure 1. Country-level change in COPD mortality (excess deaths per year) attributable to ozone between 2090 and 2000, considering population and ozone results from three models. The numbers show the change in total global ozone-related mortality (deaths per year) and the 95% CI.
Download figure:
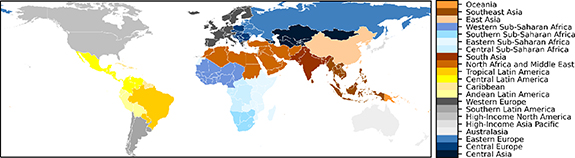
Standard image High-resolution imageTable 1. Change in mortality and mortality per 1M population between 2090 and 2000 for the GBD regions shown in the map below from changes in ozone and population.
| ||||||
| Earth3-AerChem | GFDL-ESM4 | UKESM1-0-LL | ||||
| Regions | Mortality change | Mortality per 1 M change | Mortality change | Mortality per 1 M change | Mortality change | Mortality per 1 M change |
| Oceania | 0 [0, 0] | 0 [0, 0] | 0 [0, 0] | 0 [0, 0] | 0 [0, 0] | 0 [0, 0] |
| Southeast Asia | 46 014 [−5126, 97 153] | 54 [−6, 113] | 61 181 [−1482, 123 844] | 72 [−2, 146] | 57 007 [−2802, 116 815] | 67 [−3, 137] |
| East Asia | 806 949 [235 188, 1378 709] | 765 [222, 1309] | 863 787 [260 405, 1467 170] | 817 [245, 1390] | 963 962 [309 315, 1618 610] | 909 [290, 1529] |
| Western Sub-Saharan Africa | 29 371 [751, 57 990] | 17 [1, 32] | 28 528 [348, 56 708] | 16 [1, 32] | 26 681 [48, 53 313] | 15 [1, 29] |
| Southern Sub-Saharan Africa | 900 [−307, 2107] | 8 [−2, 18] | 1386 [−219, 2990] | 13 [−2, 27] | 1389 [−195, 2973] | 13 [−1, 27] |
| Eastern Sub-Saharan Africa | 17 245 [−4298, 38 789] | 12 [−4, 28] | 17 250 [−4265, 38 765] | 12 [−3, 27] | 16 105 [−4293, 36 503] | 11 [−3, 26] |
| Central Sub-Saharan Africa | 4874 [−2870, 12 618] | 9 [−11, 29] | 5507 [−2705, 13 719] | 11 [−8, 30] | 7281 [−2888, 17 450] | 16 [−9, 41] |
| South Asia | 1363 627 [360 755, 2366 499] | 366 [100, 633] | 1505 407 [424 720, 2586 093] | 409 [119, 699] | 1482 506 [410 080, 2554 933] | 402 [114, 691] |
| North Africa and Middle East | 81 875 [7, 163 743] | 52 [−3, 107] | 85 694 [796, 170 592] | 55 [−3, 112] | 91 678 [2423, 180 932] | 59 [−1, 120] |
| Tropical Latin America | 14 833 [670, 28 995] | 58 [3, 112] | 18 643 [1187, 36 100] | 73 [5, 140] | 19 322 [2184, 36 461] | 76 [9, 142] |
| Central Latin America | 48 044 [12 720, 83 367] | 99 [27, 170] | 47 806 [12 760, 82 851] | 98 [27, 169] | 49 165 [13 225, 85 106] | 101 [28, 174] |
| Caribbean | 1017 [−276, 2310] | 17 [−5, 40] | 1176 [−259, 2610] | 20 [−5, 45] | 1114 [−264, 2492] | 19 [−5, 43] |
| Andean Latin America | 1740 [−510, 3991] | 19 [−5, 43] | 1366 [−497, 3229] | 15 [−5, 35] | 2829 [−247, 5905] | 31 [−2, 64] |
| Western Europe | 12 434 [−4639, 29 508] | 51 [−13, 114] | 16 791 [−3172, 36 755] | 66 [−8, 139] | 27 718 [1055, 54 381] | 103 [6, 200] |
| Southern Latin America | 4080 [−209, 8369] | 41 [−2, 83] | 4623 [−38, 9284] | 46 [0, 93] | 4400 [−99, 8899] | 44 [−1, 89] |
| High-Income North America | 10 711 [−2447, 23 869] | 36 [−8, 79] | 16 080 [−295, 32 454] | 53 [−1, 108] | 18 258 [78, 36 437] | 61 [0, 121] |
| High-Income Asia Pacific | 5905 [−1575, 13 386] | 98 [−9, 205] | 6681 [−1223, 14 586] | 108 [−6, 222] | 5964 [−1332, 13 261] | 99 [−8, 205] |
| Australasia | 15 [−139, 169] | 1 [−5, 6] | 39 [−211, 289] | 1 [−8, 11] | 0 [−87, 87] | 0 [−3, 3] |
| Eastern Europe | 1406 [−607, 3418] | 10 [−2, 21] | 3312 [−213, 6837] | 19 [0, 38] | 4175 [636, 7715] | 24 [4, 43] |
| Central Europe | 1630 [−533, 3793] | 36 [−3, 75] | 1359 [−688, 3406] | 33 [−5, 70] | 4027 [371, 7684] | 66 [7, 125] |
| Central Asia | 10 021 [935, 19 106] | 74 [6, 142] | 10 789 [1194, 20 383] | 81 [9, 153] | 11 584 [1461, 21 708] | 87 [11, 164] |
| Global | 2462 688 [573 529, 4351 847] | 181 [40, 321] | 2697 403 [670 367, 4724 439] | 201 [48, 353] | 2795 166 [717 463, 4872 870] | 209 [53, 365] |
Figure 2 illustrates the global population exposure to ozone (OSDMA8) for the three ESMs. The figure highlights an increase in both population and ozone concentrations, leading to higher ozone exposure by the end of the century relative to 2000. The rise in ozone levels is primarily driven by changes in anthropogenic emissions. Additionally, climate change contributes to elevated ozone concentrations in regions where the ozone maxima are located, particularly in the right-hand tail of the distribution. The combined contribution of anthropogenic emissions and climate change leads to an increase of 10.7 [ESMs range 9.3–11.5] ppb in the global population-weighted ozone concentrations between 2000 and 2090, with 10.2 [ESMs range 9.5–11.15] ppb attributed to anthropogenic emission changes.

Figure 2. Exposure of the population to ozone (OSDMA8) for the year 2000 (red), for the year 2090 with anthropogenic emissions changing (AEC) (orange), and for the year 2090 with anthropogenic emissions changing (AEC) and climate change (CC) (light blue), for the three models applied. The dashed black line represents the theoretical minimum risk exposure level (TMREL).
Download figure:
Standard image High-resolution imageTable 2 presents the ozone-related mortality change and change factor from 2000 to 2090 due to different parameters (the mortality change calculation formulas are provided in figure S1 in the supplementary information) for the three ESMs, elucidating the contribution of individual and combined parameters. By keeping ozone levels at year 2000 levels, the global burden of ozone-related mortality for the year 2090 exhibits a remarkable fivefold increase solely due to demographic changes since 2000. At the country-level, the largest increases occur in India and China, followed by Pakistan, Bangladesh, Nepal, the United States of America (USA), and Egypt (figure S6 in supplementary information). These changes are driven by the future population increase and ageing under the SSP3 scenario, as depicted in figure 3. In particular, a near doubling of the global population is projected by the year 2090 (∼12B) with respect to the year 2000 (∼6B) under SSP3, with the 70+ age category increasing by a factor of 4.3 (from 0.31B in 2000 to 1.33B in 2090).

Figure 3. Future projection of age categories population percentage and total population under the SSP3 scenario.
Download figure:
Standard image High-resolution image
Table 2. Mortality change (deaths per year) and change factor between 2000 and 2090 from different parameters for the three ESMs.
| Changing parameters | Mort. change | EC-Earth3-AerChem | GFDL-ESM4 | UKESM1-0-LL |
|---|---|---|---|---|
| POP | Change | 1418 523 [171 968, 2665 077] | 1418 523 [171 968, 2665 077] | 1418 523 [171 968, 2665 077] |
| Change factor | 5.34 | 5.34 | 5.34 | |
| AE | Change | 149 671 [43 579, 255 763] | 161 233 [47 005, 275 461] | 177 194 [53 686, 300 702] |
| Change factor | 1.46 | 1.49 | 1.54 | |
| CL (2000 POP) | Change | 8751 [−6639, 24 141] | 37 446 [11 023, 63 869] | 52 693 [8162, 97 225] |
| Change factor | 1.03 | 1.11 | 1.16 | |
| CL (2090 POP) | Change | 42 444 [−36 666, 121 553] | 217 487 [68 076, 366 898] | 211 625 [−17 169, 440 418] |
| Change factor | 1.13 | 1.67 | 1.65 | |
| AE + CL | Change | 158 422 [50 588, 266 257] | 198 679 [65 618, 331 740] | 229 887 [84 819, 374 955] |
| Change factor | 1.48 | 1.61 | 1.70 | |
| POP + AE | Change | 2420 244 [545 388, 4295 101] | 2479 916 [5669 670, 4392 862] | 2583 542 [607 019, 4560 064] |
| Change factor | 8.40 | 8.58 | 8.90 | |
| POP + AE + CL | Change | 2462 688 [573 529, 4351 847] | 2697 403 [670 367, 4724 439] | 2795 166 [717 463, 4872 870] |
| Change factor | 8.53 | 9.25 | 9.55 |
Abbreviations: POP, population; AE, anthropogenic emissions; CL, climate.
Keeping the population constant at the year 2000, the global burden of ozone-related mortality is projected to increase in 2090 by a factor ranging from 1.48 to 1.7 due to ozone changes only (table 2). Considering only anthropogenic emissions change and population of 2000, leads in an increase of global ozone-related mortality ranging from 150 K [95% CI 44 K–256 K] to 177 K [95% CI 54 K–301 K] (table 2). At the country-level, the projections indicate a decrease in ozone-related mortality for the USA and several countries in Europe by the year 2090, as indicated by the results of all three ESMs. Conversely, an increase in ozone-related mortality is projected for China and India by all three ESMs (figure S7 in supplementary information). These findings are complemented by those obtained by additionally considering climate change with a constant population for the year 2000 (figure S7 in supplementary information). Finally, if we adopt the lowest BMR for the different age categories (figure S2 in supplementary information) while accounting for changing population and ozone levels, the global burden of ozone-related mortality for the year 2090 is projected to range from 212 K [95% CI 73 K–438 K] to 240 K [95% CI 84 K–485 K] per year, effectively mitigating the projected rise in mortality caused by both population changes and ozone pollution in the future.
4. Discussion
We assessed the global burden of ozone-related excess mortality towards the end of the century under the SSP3-7.0 scenario following the GBD 2019 approach. Accounting for population and ozone changes, we used bias-corrected estimates of ozone from three recent IPCC CMIP6 ESMs, future population projections of age categories under SSP3, and the present-day BMR. The analysis indicates that the global mortality burden attributable to ozone may increase ninefold by 2090 compared to 2000. This enormous rise is primarily driven by population growth and ageing, while the second most important factor contributing to the increase is the rise in ozone levels. Previous studies have projected that under a business-as-usual scenario, global ozone-related mortality will increase more than twice by 2050, mostly driven by a threefold increase in mortality over Southeast Asia [22]. Under the RCP8.5 emissions scenario and projections of BMR and population from IFs (International Futures), Silva et al [29] estimated the global ozone-related mortality at 2.36M for 2100, i.e. increasing by a factor of six compared to 2000.
South Asia is projected to experience the greatest increase in excess mortality towards the end of the century, mainly driven by population changes (growth and ageing) and an ozone pollution increase, which may enhance attributable mortality in India by factors of 8.5 and 1.9, respectively. Conibear et al [43], reported a threefold increase in annual excess mortality attributable to air pollution by 2050 for India due to IFs-based population changes. In East Asia, population ageing and ozone exposure are responsible for an increase in ozone-related mortality by factors of 3.9 and 1.5, respectively. Although the population of China is projected to slightly decrease by 2090 under SSP3, the number of people aged 70 years and older for the same period is expected to triple (fraction of the population above 70 years old growing from 5.3% to 19%) (table S2 in supplementary information). The population-weighted ozone concentrations in China increase by 10.9 [ESMs range 8.7–13.6] ppb, with anthropogenic emission changes being responsible for 7.7 [ESMs range 7.3–8.3] ppb of this increase. Chen et al [44], under several SSP population scenarios found that the fraction of the population aged 65 years and older in China increases from 8% to 24%–33% in 2050 resulting in a substantial enhancement of ozone-related mortality for the 104 Chinese cities examined. In the North Africa and Middle East region, attributable mortality is projected to increase by a factor of fifteen in 2090 compared to 2000, mainly due to population growth and ageing (a threefold increase of population and elevenfold increase of population aged 70 years and older) (table S3) and to a lesser extent directly due to the ozone pollution increase (increase by a factor of 1.4). Large increases in heat-related mortality are expected by the end of the century over the same region under the SS3-7.0 scenario, also related to the projected strong population growth, as indicated by Hajat et al [45].
Even though the population in high-income North America is expected to remain constant while ozone levels are predicted to decline, it is projected that the mortality rate will double by 2090. This increase is primarily attributed to population ageing, specifically a threefold increase in the population aged 70 and older. Therefore, even without considering changes in ozone levels, the ageing of the population is expected to have a substantial impact on attributable mortality rates. This is partially in line with previous studies, where a nationwide increase of ozone-related excess mortality was projected for the USA in the 2050s under the RCP8.5 emissions scenario, mainly driven by future increases in ozone concentrations and population [46]. Mortality attributable to ozone is projected to increase in Western Europe by a factor between 2.2 and 3.7 mainly driven by population ageing. The effect of future ozone changes on mortality varies among the three ESMs, exhibiting reduced (EC-Earth3-AerChem), constant (GFDL-ESM4), and increased (UKESM1-0-LL) mortality in 2090 due to ozone changes alone (figure S7 in supplementary information). This reflects the large uncertainties for Europe, where previous studies showed that under the intermediate RCP4.5 emissions pathway a 24% decrease of ozone-related mortality is foreseen for 2050 [47], while under the RCP8.5 emissions scenario a small increase is projected by 2100 [29].
Given their large population size, the strongest increases in absolute mortality due to changes in anthropogenic emissions alone are found in South and East Asia, with Southeast Asia and South America also being significantly affected. All three ESMs project reduced ozone-related mortality in 2090 compared to 2000 in high-income North America, due to the reduced future ozone concentrations associated with anthropogenic emission changes. At the country-level, mortality attributable to ozone in China and India are projected to increase in 2090 by a factor of ∼1.4 (ESMs increase range 63 K–72 K deaths per year) and ∼1.8 (ESMs increase range 61 K–68 K deaths per year), respectively, and to decrease by a factor of ∼0.7 (ESMs decrease range 2.7 K–4.4 K deaths per year) in the United States of America, as a result of anthropogenic emission changes in a constant population of 2000. Stowell et al [48], considering only changes in anthropogenic emissions under RCP8.5, projected an increase in ozone-related mortality for 2050 associated with increased methane emissions. Mitigating global greenhouse gas emissions relative to a reference scenario could result in avoiding 0.7 ± 0.5 million excess ozone-related deaths in 2100 according to West et al [49].
Climate change alone is projected to amplify mortality attributable to ozone towards the end of the century, according to all three ESMs, to the greatest extent over China and India. Regionally, the climate change footprint on ozone-related mortality varies among the ESMs, subject to uncertainties and model differences associated with intricate processes affecting regional/local surface ozone levels, such as biosphere-atmosphere interactions, STE, wildfires, lighting and soil NOx emissions, as well as the frequency, intensity and position of simulated anticyclonic stagnation conditions and heatwaves [14, 46]. Qualitatively similar results were obtained under the RCP8.5 emissions pathway by Silva et al [30], with climate change being responsible for an increase of ozone related mortality by 43.6 K [−195 K to 237 K] in 2100 relative to the 2000 climate. Our findings indicate that the impact of climate change on future ozone-related mortality is generally larger, related to the fact that the signal of global warming in ozone exposure is applied in different population projections (SSP3) and are based on different emission scenarios (SSP3-7.0).
A limitation of the present study is the application of prescribed (1990–2009) BMRs for the mortality calculations. Thus, we implicitly assume that the exposome will remain the same for all people worldwide. It means that, apart from the exposure to ozone and climate change-related weather conditions affecting ozone which are accounted for here, health care, social and physical environments are assumed to remain unchanged. Since these environmental factors can be optimized, as formulated under the sustainable development goals of the United Nations, the currently lowest BMRs for the relevant disease and age categories found in the GBD database should be globally achievable. By applying the minimum BMR for each age category of all countries, we infer that the global burden of ozone-related mortality could decrease by around 30% compared to 2000. This suggests that even under the high-emissions SSP3-7.0 pathway, there is significant potential for mitigating the increase in ozone-related excess mortality through continued improvements in health care, nutrition, and other living conditions. Thus, by implementing measures to promote healthy lifestyles and to improve healthcare systems, it is possible to counteract the negative effects associated with environmental risk factors. Obviously, the optimal intervention will be to improve all exposome factors.
5. Concluding remarks
We estimated future ozone-related mortality under the SSP3-7.0 scenario, unravelling the roles of demographics, ozone precursor emissions, and climate change. We also explored the potential health benefits that improved living and healthcare conditions in the future could bring. Our results indicate major challenges for mitigation and adaptation in the future (SSP3-7.0), as ozone-related mortality is projected to increase drastically (ninefold) towards the end of the century. Population growth and ageing are expected to be the main drivers, increasing ozone-related mortality by a factor of 5.3. Ground-level ozone increases, associated with anthropogenic emissions and climate change, cause an increase in ozone-related mortality by a factor of 1.6. Nevertheless, by improving living and healthcare conditions worldwide to the highest present-day standards, the aforementioned increases in ozone-related mortality could be prevented.
Acknowledgments
SB was supported by the Alexander von Humboldt—Stiftung, Bonn, Germany, through a research Grant. PZa and AKG acknowledge the Action titled 'National Network on Climate Change and its Impacts—CLIMPACT' which is implemented under the sub-project 3 of the project 'Infrastructure of national research networks in the fields of Precision Medicine, Quantum Technology and Climate Change', funded by the Public Investment Program of Greece, General Secretary of Research and Technology/Ministry of Development and Investments. FMO'C was supported by the Met Office Hadley Centre Climate Programme funded by DSIT. JK thanks the Met Office CSSP-China programme for funding received through the POzSUM project. TvN, PLS, PZh, and AP acknowledge the European Commission Horizon Europe project FOCI (Grant Agreement No 101056783). PZh acknowledges the ACCC Flagship funded by the Academy of Finland (337549), EU H2020 project FORCeS (Grant Agreement No 821205), and CSC (IT Center for Science, Finland) for computational resources. ST was funded by the Met Office Climate Science for Service Partnership (CSSP) China project under the International Science Partnerships Fund (ISPF). We acknowledge the World Climate Research Programme, which, through its Working Group on Coupled Modelling, coordinated and promoted CMIP6. We thank the climate modeling groups for producing and making available their model output, the Earth System Grid Federation (ESGF) for archiving the data and providing access, and the multiple funding agencies who support CMIP6 and ESGF.
Data availability statement
The data that support the findings of this study are openly available at the following URL/DOI: https://esgf-data.dkrz.de/search/cmip6-dkrz/. The EC-Earth3-AerChem histSST ozone data are publicly available via the link https://a3s.fi/swift/v1/AUTH_52c9f7ef62574ad88073aff57e24d63c/sfo3_to_steven/. The download link for each data file listed in the link is composed by appending the file name at the end of the link. The DeLang et al (2021) ozone dataset (Version 1) is publicly available from https://zenodo.org/records/8320001. The GBD 2019 data are available from https://vizhub.healthdata.org/gbd-results/. The gridded population data under SSP3 can be downloaded from https://sedac.ciesin.columbia.edu/data/set/popdynamics-1-8th-pop-base-year-projection-ssp-2000-2100-rev01. The IIASA SSP3 national population data per age category can be found at https://tntcat.iiasa.ac.at/SspDb/dsd?Action=htmlpage&page=20. Finally, the SEDAC GPWv4 national boundaries dataset is available from https://sedac.ciesin.columbia.edu/data/set/gpw-v4-national-identifier-grid-rev11.
Supplementary data (5.1 MB PDF)