

Abstract
The lack of affordable, reliable, and resilient energy services remains a challenge for many U.S. households. Few studies have investigated how temperature makes already vulnerable Black, low-income, and less-educated households more likely to experience energy poverty. We construct a unique 8-year historical panel dataset to unpack the relationship between temperatures and energy burdens, paying specific attention to additional burdens among the most vulnerable groups. We find that hot and cold temperatures have further exacerbated the disproportionate impact on energy burdens across regions and multiple vulnerable groups. Extremely low-income groups are ∼6 times more adversely affected by temperatures than high-income groups. Temperatures also put other already marginalized groups, such as those less-educated/unemployed/living in energy-inefficient old houses, at higher risk of falling into an energy poverty trap. Considering temperatures are the dominant feature differentiating households in their ability to meet basic electricity needs, we recommend more equitable and inclusive electrification strategies and compensation mechanisms for affected communities to improve energy equity.
Export citation and abstract BibTeX RIS

Original content from this work may be used under the terms of the Creative Commons Attribution 4.0 license. Any further distribution of this work must maintain attribution to the author(s) and the title of the work, journal citation and DOI.
1. Introduction
Household energy consumption, such as cooking, water heating, space heating, and cooling, is critical for basic living needs and personal health [1–5]. Energy burden is commonly defined as the percentage of household income spent on energy bills, where higher values represent households having to make trade-offs between maintaining their living needs and other necessities such as food, education, and health care [6]. Limited by data available at hand, many studies focused on quantifying energy burdens have inconsistent data sources and included energy sources. Some studies actually focus on the share of electricity expenditures as a percentage of household income, as electricity bills tend to be the most readily available data [7]. Using electricity expenditures alone is likely to underestimate total energy burdens (TEB), considering that the share of homes heating with electricity is about 40% and natural gas or fossil fuel heating remains a legacy heating fuel [8]. More comprehensive energy burden studies rely on national surveys, the Low-Income Energy Affordability Data (LEAD) Tool and the American Housing Survey (AHS), which provide broader energy coverage of electricity and home heating fuel but typically conduct cross-sectional analyses for a static year without enough longitudinal information to study changes over time [9, 10]. The varying data sources, energy sources, and limited temporal information may reduce the comparability of available results.
Previous studies have engaged in developing comprehensive and innovative metrics and capturing spatial disparities to discuss energy inequities [11, 12]. Findings to date have demonstrated that energy burden tends to be strongly associated with vulnerable groups, with Black, Hispanic, low-income, elderly, and households living in energy-inefficient buildings undertaking disproportionately high energy burdens [13–16], making the energy burden metric a social equity issue, rather than purely an economic concept of affordability. Notably, hot and cold temperatures in energy systems may further exacerbate equity issues arising from resource allocation dilemmas between advantaged and disadvantaged groups, resulting in a growing need to revisit energy burdens from a climate perspective and provide new insights into discussions on already existing energy inequities.
Theoretically, temperatures affect energy burdens through the following mechanisms [17, 18]. On one hand, temperature may increase energy burdens by increasing energy demand [19–22]. Hot or cold weather may increase energy use for space heating and cooling, which typically comprises the largest share of household energy bills. On the other hand, the delivery of electricity or natural gas depends on reliable and resilient energy infrastructure, while hot and cold temperatures are likely to cause enormous damage to energy delivery facilities, ultimately leading to higher energy prices. For instance, the 2021 Texas energy crisis was directly triggered by low temperatures that damaged natural gas transmission pipelines, reducing the natural gas supply, redirecting gas from homes to power plants, and making it difficult for households to access critical energy services [23, 24]. Growing energy demand and disruptive supply reductions may result in grid overloads or disconnections, thus raising energy prices and increasing energy burdens when encountering hot and cold temperatures.
A recent study finds that summer temperatures are the largest driver of high energy burdens due to air conditioning adoption [25]. This case only measures energy burdens raised by cooling demand in New York City. Considerable temperature changes in the United States are likely to span multiple climate zones, yielding heterogeneous impacts across different regions. Households living in hot southern and cold northern regions face threats of increased energy burdens due to increased cooling/heating demand. To address these gaps, it is important to unpack the link between temperatures and energy burdens based on a panel dataset at the national level.
Considering existing limitations of energy burden datasets and a dearth of temperature-energy burden relationship studies, our main purpose is to conduct a nationwide longitudinal empirical study by using real, observed historical temperature fluctuations to identify their heterogeneous effects on different energy burdens. Specifically, we obtain ∼49 million household energy bills and income raw records from the U.S. Census Bureau 5-year American Community Survey (ACS) Public Use Microdata Sample (PUMS) file. We integrate these longitudinal data with the temperature dataset to construct an 8-year balanced panel dataset in the conterminous United States over the period 2013–2020. Our analysis first revisits the spatial distribution of energy burdens, with a particular focus on descriptive disparities due to energy sources, vulnerable factors, and geographic locations. We then construct statistical models to identify the heterogeneous impacts of temperatures on different energy burdens across different income groups. Finally, we further consider more vulnerable groups to analyze their heterogeneous responses to temperatures.
Our study advances the existing literature in the following ways: first, we enlarge the cross-sectional energy burden dataset to the longitudinal time dimension and household data aggregated at the county level across the conterminous U.S., largely improving existing regional survey data and national cross-sectional data that typically covers a static year, thus better capturing spatiotemporal disparities in energy burdens. Although finer spatial resolution data, such as census tract, may be available according to previous energy burden studies based on the LEAD Tool [26, 27], these studies only report 1-year results for 2018, which not only limits spatiotemporal discussion on energy burdens from a longer-term temporal perspective [28–30], but also constrains the information that can be obtained due to their cross-sectional regression analyses [31, 32]. Second, we disaggregate total energy burdens by energy sources into electricity burdens, natural gas burdens, and fuel oil burdens, overcoming the limitations of current research accounting for all sources of energy bills and providing a more detailed understanding of energy burdens based on various household fuels and technology richness. Consequently, we can model the association between temperatures and different sources of energy burdens to fill the existing gaps in energy burden studies nudging toward better metric development and descriptive analysis. To the best of our knowledge, we are the first to explicitly disaggregate energy burdens into their subdivided fuel types. Third, we innovatively estimate the heterogeneous responses of energy burdens to hot and cold temperatures under different income groups and other vulnerable groups, aiming to propose more equitable and inclusive energy and climate policies for targeted populations to reduce climate-induced energy inequities.
2. Method
2.1. Data
The data used to calculate energy burdens (defined as the percentage of household income spent on energy bills) are from the U.S. Census Bureau 5-year ACS Public Use Microdata Sample (PUMS). Specifically, we collect annual electricity bills, natural gas bills, fuel oil bills, and household income data for ∼49 million households in the conterminous U.S. between 2013 and 2020 to calculate total energy burden, electricity burden, natural gas burden, and fuel oil burden. We split the sample according to income percentiles to investigate energy burdens across different income groups. According to the LEAD Tool, energy burdens for groups with incomes above the median (50th percentile) are much lower than those of lower-income groups. Consequently, we divide household income into three groups by percentile. The extremely low-income group (i.e. the lowest 25% group) refers to those with income below the 25th percentile, which means household income less than ∼$33 K in our sample; the low-income group (i.e. the 25%–50% group) refers to those with income at the 25th to 50th percentile, which means household income larger than ∼$33 K and less than ∼$62 K in our sample; and the high-income group (i.e. the top 50% group) refers to those above the 50th percentile, which means household income more than ∼$62 K in our sample.
At the spatial scale, the raw household data are collected at the Public Use Microdata Areas (PUMAs) level, which are non-overlapping geographic units based on population size, e.g. no less than 100 000 people per PUMA according to the U.S. Census Bureau. To facilitate spatial analysis and data integration, we convert PUMAs to county geographic units using area-weighted spatial intersection of polygons in R to merge with county-level temperature and socio-demographic data. There are no missing counties when merging the data, and we use linear interpolation for several missing years [22]. Finally, we construct an 8-year balanced panel dataset covering all 3,106 conterminous U.S. counties. For each county in each year, we can calculate household energy burdens by energy sources for different income groups.
Temperature data are obtained from the NOAA Monthly U.S. Climate Divisional Database (NClimDiv). Since air temperature data are often constrained by the sparse distribution and the limited number of weather stations, we aggregate the calculated household energy burdens to their county averages to better integrate temperature data and other socio-demographic data for the sake of data consistency.
Socioeconomic and demographic variables of interest, including the proportion of the Black population and the percentage of the population with educational attainment below or equal to a high school diploma, are from ACS 5-year estimates. With reference to previous studies [9, 10, 18, 28, 33–36], we select nine representative socio-demographic attributes that provide reasonable proxies for energy-vulnerable groups and conduct the heterogeneous analysis.
2.2. Statistical model
We compile a county-level panel data set in the conterminous United States over the period 2013–2020 to model the relationship between historical temperature fluctuations and energy burdens. The key independent variables, temperature deviations, are measured by heating degree days (HDD) and cooling degree days (CDD), which are commonly used proxies for capturing temperature variations in the energy field as they can inform us how much energy demand we may need for heating/cooling a building, thus facilitating the investigation of the climate-energy nexus. Degree days are calculated by comparing the deviation between the average air temperature and the baseline temperature, usually 65 degrees Fahrenheit (F) in the United States [37]. Thus, we can obtain annual total HDD and CDD in county i in year t using the following equations:


The key dependent variables include total energy burdens (TEB) and corresponding subdivided burdens, namely electricity burdens (EB), natural gas burdens (GB), and fuel oil burdens (FB), which are defined as:


We then parameterize the association between temperatures and energy burdens by using a two-way fixed-effects panel data model (equation (7)). Regarding the choice of model, the chi-square test of the Hausman test rejects the null hypothesis that coefficients estimated by the fixed effects model and the random effects model are consistent with each other, indicating that the fixed effects model may be preferred over the random effects model (SI appendix B, tables S3–S6).
where  denotes different energy burdens (%) in county i at year t, measured as the ratio of energy bills to household income. Specifically, we are interested in total energy burdens (TEB), electricity burdens (EB), natural gas burdens (GB), and fuel oil burdens (FB).
  and
and  are the logarithm of heating degree days (HDD) and cooling degree days (CDD) in county i at year t.
  and
and  are the coefficients quantifying the impacts of HDD and CDD on different energy burdens, respectively.
  are observed confounding factors, which include the Gini index and population density that can potentially impact energy burdens.
  are the coefficients of confounding factors.
  are unobserved time-invariant county fixed effects that remove variations caused by county differences, and
  are year-fixed effects using dummy variables to capture unobserved time-varying factors such as financial crisis, technology advancements, and policy changes.
  is the error term.
Emerging literature suggests that socially vulnerable groups may have lower climate resilience and thus are disproportionately burdened when experiencing hot and cold temperatures [38]. We, therefore, conduct a heterogeneous analysis to identify the more vulnerable communities that endure more temperature threats. By dividing selected vulnerable factors by quartiles, we can compare disparities in temperature responses across different socioeconomic and demographic characteristics. Existing studies have demonstrated that heterogeneous effects can be examined by adding interaction terms between key explanatory variables and group dummies [39, 40]. In this study, we interact heating and cooling degree days with quartile dummy variables (such as the black rate, poverty rate, and unemployment rate) to estimate the potential heterogeneity of vulnerable factors.
3. Results and discussion
3.1. Energy burden patterns by energy sources
We report the spatiotemporal patterns of energy burdens in figure 1. At the spatial level, we can find that the total energy burdens (TEB) are unequally distributed across U.S. counties, with those historically disadvantaged communities disproportionately experiencing a high energy burden since higher values on the map (shown in Mulberry) are concentrated in the southeastern counties where the black and extremely low-income groups live. Representative disadvantaged communities include Robeson and Halifax Counties in North Carolina, Allendale County in South Carolina, and Jackson County in South Dakota. In addition, Navajo and Apache counties in Arizona, which have a high proportion of Native Americans, are also observed to have higher energy burdens, indicating that the inequity in energy burdens is extensive in the United States. At the temporal level, we can find a lower burden in 2020 compared to 2013, with ∼27% and ∼7% of U.S. households facing a high energy burden (i.e. spending more than 6% of income on energy bills) in 2013 and 2020, respectively. This decrease in energy burdens can be manifested through previous national studies finding that ∼25% and ∼16% of households encountered high energy burdens in 2017 [35] and 2018 [28].
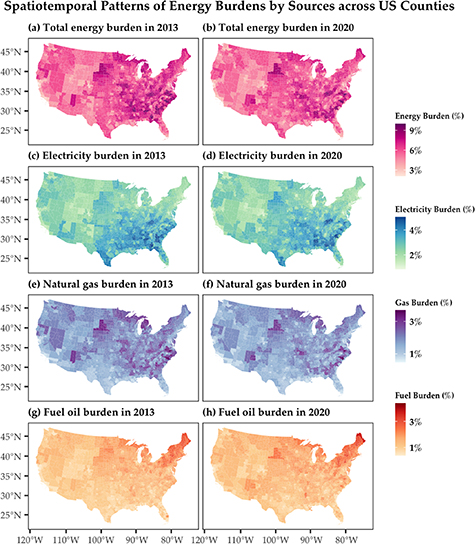
Figure 1. Spatiotemporal patterns of energy burdens by sources across conterminous U.S. counties.
Download figure:
Standard image High-resolution imageBy disaggregating total energy burdens (TEB) into electricity burdens (EB), natural gas burdens (GB), and fuel oil burdens (FB), we can identify the major sources of TEB. The results show that electricity contributes ∼50% of TEB, natural gas makes up for ∼30%, and heating fuel oil contributes the remaining 20% (see SI appendix B, table S1). Figures 1(c)–(h) depict the spatiotemporal patterns of energy burdens from different sources. We can find that the temporal patterns also show a reduction in electricity burdens, natural gas burdens, and fuel oil burdens, and spatial patterns of electricity burdens and natural gas burdens remain consistent with TEB, but fuel oil burdens are observed to be different. High values of fuel oil burden (shown in orange) mainly appear in the Northeastern rural areas since heating fuel oils were widely used in these extremely cold regions and less frequently in the warm Southern regions.
3.2. Energy burden disparities by income groups and vulnerable factors
According to the commonly held definition of energy burden—energy bills as a share of income—low-income groups are at a natural disadvantage in paying for necessary energy bills. Thus, we further explore disparities in energy burdens by mapping spatial patterns across different income groups in figure 2 (see SI appendix B, table S1). As can be seen from figure 2, extremely low-income households (income less than the 25th percentile) have much higher total energy burdens, electricity burdens, natural gas burdens, and fuel oil burdens than low-income groups (income at the 25th to 50th percentile) and high-income groups (income above the 50th percentile). The average TEB for the extremely low-income group, low-income group, and high-income group is about 23.2%, 10.0%, and 3.9%, respectively. These stark differences imply that extremely low-income groups are disproportionately suffering from high energy burdens, experiencing almost six times the energy burden of the high-income group. For electricity burden, the extremely low-income, low-income, and high-income groups are 10.4%, 4.8%, and 2.0%, respectively. Natural gas bills are 7.5%, 3.1%, and 1.1% of income for different income groups. In addition, the fuel oil burden for the extremely low-income group, low-income group, and high-income group is 5.3%, 2.2%, and 0.7%, respectively. The disparities between extremely low-income groups and high-income groups remain evident, with electricity burdens contributing the most.
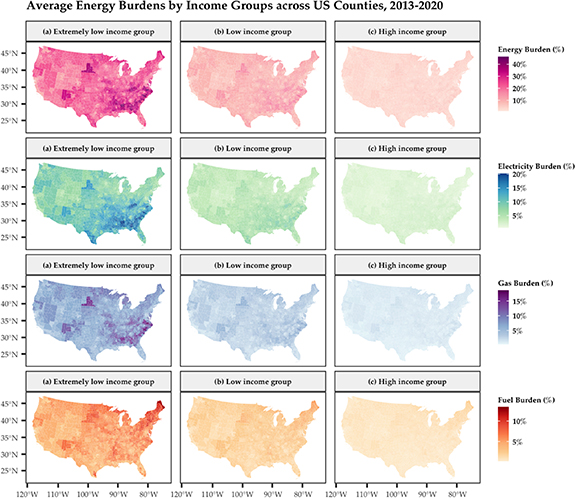
Figure 2. Average energy burdens by income groups across conterminous U.S. counties.
Download figure:
Standard image High-resolution imageNotably, disparities in energy burdens for the high-income groups are almost negligible but remain substantial for extremely low-income groups. While we have previously made some empirical judgments about the sources of the disparity, i.e. income-induced inequity, the residual disparities observed in extremely low-income groups may suggest that the sources of disparities are diverse due to multiple vulnerable factors. We proxy vulnerable communities by collecting sociodemographic data from the ACS, e.g. the proportion of the Black population, the percentage of the population with an education degree below or equal to high school, and the proportion of the population employed in the low-skilled primary sector (e.g. agriculture, forestry, fishing and hunting, and mining). To fully explore the potential impact of the vulnerability, we use kernel density curves to compare the differences in the distribution of TEB for the extremely low-income group at the 10th percentile and 90th percentile of the nine selected vulnerable factors. The 10th and 90th percentiles are commonly used in economic analysis to discuss income and wage inequalities [41, 42]. According to figure 3, we find a much higher burden in the 90th percentile, especially for the Black population, those below the poverty line, those unemployed, those less educated, and those living in old houses. Although low-income and marginalized groups consume less energy than high-income communities, they are not only likely to pay higher energy prices due to price discrimination—but are also more likely to live in less energy-efficient housing, such as houses built before 1970 [43, 44].
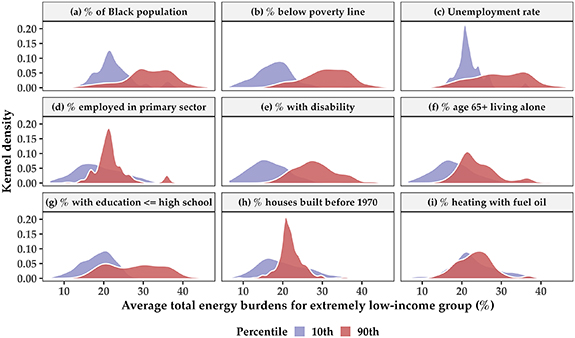
Figure 3. Kernel density curve for total energy burdens across different vulnerable groups for the extremely low-income group.
Download figure:
Standard image High-resolution image3.3. Unpacking the disproportionate temperature impacts on energy burdens
3.3.1. Temperature impacts on energy burdens by regions
Previous energy burden studies contributed through nudging toward metrics development and descriptive analysis have shown research gaps in unpacking the link between temperatures and energy burdens [45, 46]. Considering the potential heterogeneity in climate variability and heating fuel choices across regions, we first estimate the impact of HDD and CDD on different energy burdens across different regions. The findings reveal notable regional differences. According to figure 4(a), the Northeast experiences the largest adverse effects on total energy burdens (TEB) when temperature decreases, primarily due to increased expenses related to fuel oil and electricity for home heating. Households living in the Northeast always face extremely cold weather (see SI appendix A, figures S1 and S2), necessitating space heating for comfort and health considerations. The persistent need for heating leads to substantial heating bills, making it the most energy-vulnerable region during cold weather. In other regions, while we also find higher TEB as temperatures decrease, the magnitude is smaller than in the Northeast. When temperature increases, we can observe that TEB become lower in the Northeast due to decreased fuel oil burdens, while not significantly affecting TEB in other regions.
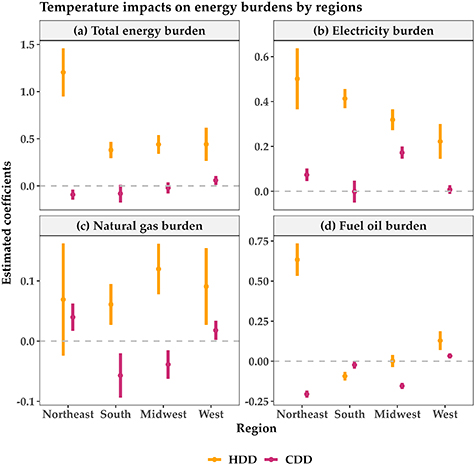
Figure 4. Disparities in temperature impacts on different energy burdens across different regions.
Download figure:
Standard image High-resolution imageFigures 4(b)–(d) show that temperature-induced changes in TEB are predominantly driven by electricity in all regions except the Northeast, which relies on both electricity and fuel oil. While natural gas is also a widely used energy source, it normally tends to cost less than inefficient electric heaters [47], resulting in a relatively small contribution. The shift towards electrification, driven by decarbonization policies, is causing more households to rely on electricity for their energy needs [48]. Particularly with the implementation of heating electrification policies [49], we observe that the increase in electricity burdens due to cold temperatures exceeds that due to hot temperatures in all regions, which may raise the need for more equitable and inclusive heating electrification instead of neglecting surging electricity burdens during the transition.
Heterogeneous responses of electricity burdens to hot and cold temperatures may be caused by a variety of factors: in the southern region, households use air conditioning extensively during summers to maintain comfortable indoor temperatures, with ∼94% of households reporting air conditioning usage in 2020 [50]. If temperatures increase further, the relative increase in cooling bills may be insignificant; while facing cold temperatures will still largely increase electric heating bills, probably due to growing heating demand in the South. In the Northeast and Midwest regions, households also respond more sensitively to cold temperatures than to hot temperatures. This is not only because they have higher heating demand and lower cooling demand due to climatic factors, but also because of the installation of central heating and ventilation systems and the lack of central air conditioning units in most homes. In the West, households enjoy milder temperatures, reducing their energy demands for heating and cooling. Besides, the lack of air conditioner adoption makes households living in the West less sensitive to temperature increases.
3.3.2. Temperature impacts on energy burdens by income groups
Figures 5(a)–(d) report the estimated coefficients for hot and cold temperatures on different energy burdens across different income groups. Generally, we can find that extremely low-income groups suffer the most when encountering hot and cold temperatures, which are ∼6 times more burdened than high-income groups. This finding validates previous studies highlighting that low-income households are more vulnerable to temperature extremes than high-income households [38]. Due to the rigid heating demands, extremely low-income households have to bear high energy costs to survive cold weather. The necessary energy expenditures crowd out disposable income for other living expenses such as food and healthcare, thus potentially causing additional adverse health outcomes [51–53]. By contrast, higher-income groups may afford high heating energy bills, thus experiencing a much smaller marginal increment in energy burdens. During hot weather, energy burdens of extremely low-income groups respond in a different way than other income groups. Although electricity burdens required to meet rigid cooling demand increase in all-income groups, extremely low-income groups may reduce natural gas and fuel oil consumption to compensate for the increased electricity burden. Typically, on torrid days, natural gas is mostly used for cooking or water heating instead of space cooling. Extremely low-income groups adapt to increased electricity burden due to higher temperatures by controlling non-cooling energy use, thus reducing TEB when temperatures increase. However, higher-income groups may have greater climate resilience or lower energy use intensity [54], stemming from the fact that they can take more adaptive measures (e.g. purchasing energy-efficient products such as heat pumps or heating, ventilation, and air conditioning (HVAC) systems) to improve their ability to cope with temperature deviations and reduce corresponding adverse effects. Energy consumption behaviors on natural gas by higher-income groups may not be affected by hot weather, and the reduced fuel oil burden compensates for the increased electricity burden, thus making their TEB unaffected by temperature increases.
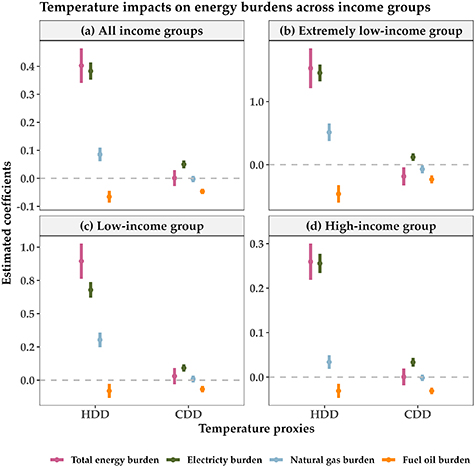
Figure 5. Disparities in temperature impacts on different energy burdens across different income groups.
Download figure:
Standard image High-resolution image3.3.3. Temperature impacts on energy burdens by vulnerable groups
Emerging literature suggests that energy security may be affected by temperatures [55] and that some subpopulations may be particularly disadvantaged [56]. Similarly, energy burdens of certain subgroups, such as low-income groups and those living in energy-inefficient old houses, may be especially vulnerable to temperatures, considering that energy consumption behaviors of advantaged and disadvantaged groups may respond differently. Previously, we demonstrated that the specific response to temperature differs between extremely low-income groups and other income groups, while other vulnerable factors may still heterogeneously affect temperature responses even within extremely low-income groups. To verify potential heterogeneity, we group the sample by quartiles and compare the estimated coefficients of HDD and CDD for selected vulnerable groups [57]. Considering that the trends in temperature response coefficients for electricity burden are more representative and indicative, we report the results in figure 6, and the results of TEB, natural gas burden, and fuel oil burden are shown in SI appendix A, figures S6–S8.

Figure 6. Disparities in temperature impacts on electricity burden across different vulnerable groups for the extremely low-income group.
Download figure:
Standard image High-resolution image
The results suggest that vulnerable factors may further influence the temperature response of energy burdens for extremely low-income groups. In terms of electricity burden, we find that the response to CDD increases with the poverty rate, and the coefficients are statistically significant, which may be due to unstable household finances making it difficult to cover electricity bills on a regular basis. A higher unemployment rate also makes electricity burdens more sensitive to CDD, considering income losses induced by unemployment that hinder households' ability to pay their electricity bills. Similarly, the increase in the proportion of the population employed in the primary sector (agriculture, forestry, fishing and hunting, and mining) increases CDD coefficients, suggesting that the labor force serving low-skilled jobs may have difficulty affording electricity expenditures due to lower salary returns. Lower educational attainment is associated with a more sensitive response, possibly because low educational attainment is thought to be positively associated with lower income and poverty. In addition, education plays a role in shaping household energy decisions and consumption behaviors, and knowledge and acceptance of energy-efficient technologies such as HVAC 4 may therefore limit energy-saving technology adoption and corresponding energy transition [58, 59]. This efficiency-related increased burden is also witnessed through the indicator of the proportion of housing units built before 1970. As older houses are often perceived as energy inefficient and difficult to achieve energy transition, the increase in the proportion of older houses may increase CDD coefficients. Heating with fuel oil may slightly increase CDD coefficients. Considering that heating oil is often considered a low-tech and low-efficient energy technology that may potentially put households at a technological disadvantage, a higher proportion of housing units heated with fuel oil may make households less resilient to extreme temperatures. Besides, a higher proportion of the Black population does not affect the response to CDD, and the response does not become more sensitive under a higher proportion of the disabled population or a higher proportion of the elderly population living alone.
In terms of the response to HDD, we find a reduction in electricity burdens for some vulnerable groups, such as low-skilled workers, those less-educated, and those living in energy-inefficient homes, which seems not consistent with our expectations. On one hand, we may find that these vulnerable groups are more responsive to fuel oil (see appendix A, figure S8); on the other hand, existing studies have proved that for some extremely low-income groups, thermal comfort may be forgone for cost considerations during the hot summers [60]. Similarly, vulnerable populations may also forgo heating demand and simply wear more clothes to reduce their winter financial burden. Thus, lower electricity burdens do not necessarily signal an improvement in their well-being.
4. Conclusions and policy implications
Based on a nationwide multi-year energy burden panel dataset, we address three main questions: first, how do energy burdens differ descriptively by energy source, geographic location, and vulnerable groups? Second, how do temperatures affect energy burdens? Third, do different demographic and socioeconomic groups respond disproportionately to hot and cold temperatures?
Overall, our results suggest that on average, ∼63 million (∼20%) of U.S. populations experience high energy burdens in the conterminous U.S. from 2013–2020 (see appendix B, table S2), among which Southeast U.S. is more vulnerable due to large concentrations of socially vulnerable communities. Extremely low-income groups are ∼6 times more burdened by energy than high-income groups, and the energy burden gap remains evident among other vulnerable groups. Our study once again validates the findings of previous regional or staged cross-sectional energy burden surveys [35], while making them comparable in the longer historical time dimension.
Our main interest is to focus on temperature impacts to provide new empirical evidence for energy burden studies. By innovatively disaggregating total energy burdens according to energy sources, we can find that temperature may heterogeneously impact different energy burdens, with electricity burdens playing a dominant contributing role. This finding has important implications for policy and planning related to projected increases in winter-peaking electricity systems due to broader fuel transitions that incorporate switching from gas and fossil fuels to electricity. Most regions in the US peak their electricity consumption in the summer currently—however, that may change under decarbonization and electrification strategies [61]. Moreover, we find that extremely low-income groups are ∼6 times more adversely affected by temperature than high-income groups, implying that temperature may put already marginalized groups at higher risk of falling into an energy poverty trap. For extremely low-income households that switch from fossil fuels to electricity, affordable electricity programs should remain a consistent priority in conjunction with decarbonization policies. Even though household solar could likely reduce local costs [62], they may be inaccessible to extremely low-income households [63]. We may foresee that in the absence of appropriate equity-related policies, electrification and decarbonization strategies have the potential to exacerbate energy burden disparities between different socioeconomic communities.
Further heterogeneity analysis shows that temperatures disproportionately affect energy burdens of different vulnerable groups, especially those who bear income loss and low energy-efficient housing services show a more sensitive response, and mitigation strategies that take temperatures into account should be tailored to the energy consumption behavior of different disadvantaged groups. For instance, disability and low educational and other socioeconomic disadvantages may keep the labor force trapped in a spiral of low-skilled jobs, while low-reward jobs in agriculture, fishing, and mining will push people further into low-income and poverty traps, making it more difficult to escape energy poverty. We should ensure a just transition in the implementation of a clean energy transition [64], considering the potential labor disruption or income loss for low-skilled jobs such as coal miners [65, 66]. In addition, studies in the UK highlight the viability of several policy interventions to address projected future impacts of climate change, electrification, and household energy affordability [67]. These include mandatory landlord energy efficiency upgrades [68] to protect renters and those in older homes built prior to 1970. Given the high percentage of renters among vulnerable groups such as the elderly, Black populations and communities of color, and those in lower-paying primary sector jobs, landlord intervention would be a critical step towards a more equitable and inclusive future.
Our study may be relevant to two major categories of policy responses aimed at reducing energy burdens associated with hot and cold temperatures:
One category of policy response may be direct cash payments to help the federal government better target energy-related vulnerable populations so that energy assistance funds such as the Low-Income Home Energy Assistance Program and the Weatherization Assistance Program can be directed to the most affected and neediest populations. Particularly, for low-income people caught in the energy poverty trap, such assistance can reduce financial hardship and help them make specific upgrades [69]. Further guidance through energy audits and efficiency programs can provide suggestions and in-kind support.
Another potential policy concern is how to balance the need for system-level heating electrification with reducing household electricity burdens, i.e. achieving a more equitable electrification transition. States demonstrating climate mitigation ambitions are particularly focused on electrification and the clean energy transition, with the 'Electrify Everything' movement already leading to measures to restrict or ban natural gas usage in new homes in dozens of cities since its inception in California, followed by 'electricity-preferred' building policies in other cities such as New York [70]. The share of U.S. households heating with electricity has increased from 1% in 1950 to ∼40% in 2021 [8]. From a long-term historical perspective, electrification may be more the result of multiple factors such as economic development, lower electricity prices, and energy efficiency improvements. Thus, equitable electrification for U.S. households should involve a package of diversified policy portfolios, including energy price subsidies or incentives for energy-efficient technology adoption, that benefit those living in energy-inefficient houses as they are expected to afford higher energy costs. An existing energy-saving incentive policy is the Inflation Reduction Act [71], under which qualifying customers receive tax credits for purchasing energy-efficient technology, such as high-efficiency electric appliances. Despite the potential to help households transition to clean energy and improve energy efficiency, tax credits often need to wait until the next calendar year, and the upfront capital outlay remains unaffordable for low-income groups, leading us to rethink fairer incentives to encourage more rapid adoption.
In response to the integrated energy, climate, and equity agenda, policymakers need to develop policy portfolios that compensate for vulnerable communities that are disproportionately affected by temperatures. The identification of disparities in temperature impacts on energy burden constitutes an indispensable link to achieving affordable energy services and reducing the polarization between different socioeconomic groups. Several limitations should be noted in this study. For the sake of model simplicity and comprehensibility, we separately analyze the effects of different subgroups on the temperature-energy burden relationship, rather than considering the complex interrelationships of different subgroup mixes. We display the spatiotemporal disparities in different energy burdens, the underlying drivers of patterns may be diverse, and we leave these interesting questions for future research. Considering that temperature responses are already differentiating households' ability to meet necessary energy needs, further understanding of the disaggregated impacts of household electrification and decarbonization strategies can provide more specific and equitable adaptation measures for vulnerable groups and structure corresponding compensatory mechanisms.
Data availability statement
All data that support the findings of this study are included within the article (and any supplementary files).
Funding statement
Support for this work was provided by the Alfred P. Sloan Foundation Grant G-2020-13922 through the Duke University Energy Data Analytics PhD Student Fellowship. Conclusions reached or positions are taken or the researchers themselves and not those of the Alfred P Sloan Foundation or its trustees, officers, or staff.
Author contributions
Ying Yu: Conceptualization, Data Collection, Formal analysis, Methodology, Writing–Original draft, Writing-Reviewing and Editing. Noah Kittner: Conceptualization, Supervision, Writing-Reviewing and Editing.
Conflict of interest
The authors declare that they have no known competing financial interests or personal relationships that could have appeared to influence the work reported in this paper.
Footnotes
- 4
The HVAC system is one of energy-efficient technologies that provide space heating and cooling as well as indoor air quality improvement for buildings.
Supplementary data (1.9 MB DOCX)