

Abstract
Multiple lines of observational evidence have indicated a significant wetting over the arid and semi-arid Northwest China (NWC) during recent decades, coinciding with a simultaneous sharp decline of dust events. Although recent studies have attributed NWC wetting to different anthropogenic and natural forcings, the mechanisms are not definitive and the regional wetting has been greatly underestimated in the Coupled Model Intercomparison Project historical simulations. Based on sensitivity experiments with different dust emission amounts using the NCAR Community Atmospheric Model version 5 (CAM5), here we find that decreasing dusts exert significant impacts on mixed-phase clouds through reducing the concentration of ice nucleating particles, increase the NWC precipitation and thus induce regional wetting through enhancing convection precipitation. A possible convection invigoration mechanism whereby the atmospheric vertical temperature gradient and convective instability are strengthened by reduced dusts, leading to convection invigoration and increased precipitation. These results are reinforced by simulations over the dust region in North Africa where mixed-phase and ice clouds are rare and reduced dusts do not increase precipitation. This study highlights the possible mechanism of dust-ice cloud interactions in recent NWC wetting and future regional climate change.
Export citation and abstract BibTeX RIS

Original content from this work may be used under the terms of the Creative Commons Attribution 4.0 license. Any further distribution of this work must maintain attribution to the author(s) and the title of the work, journal citation and DOI.
1. Introduction
In response to global warming in historical and future climate change, the 'wet gets wetter, dry gets drier' paradigm has been suggested to explain the expected trends of global hydrological cycle, mainly due to thermodynamic and dynamic mechanisms (Held and Soden 2006, Chou et al 2009, Seager et al 2010, Allan 2014). On the contrary, over the arid and semi-arid Northwest China (NWC), multiple lines of observational evidence for NWC wetting have been reported during recent decades, including increases of surface precipitation, and river runoff, rise of lake water levels, and improvement of vegetation cover (Shi et al 2007, Han et al 2016). Several mechanisms have been suggested to explain the NWC wetting, including increasing greenhouse gases (GHG) (Zhou and Huang 2010, Jiang et al 2013, Han et al 2016, Peng and Zhou 2017) and internal forcings (Huang et al 2013, Zhu et al 2015). However, the mechanisms of NWC wetting are not definitive and historical simulations showed that global climate models (GCMs) significantly underestimate the NWC wetting (Chen and Frauenfeld 2014, Wu et al 2018, Xin et al 2020).
Anthropogenic and natural aerosols can affect global and regional climate through directly absorbing/scattering the radiation, and indirectly acting as droplet nucleating particles and ice nucleating particles (INPs) (Ramanathan et al 2001, DeMott et al 2010, Miller et al 2014, Myhre et al 2017). Previous GCM studies suggested that AERs in East and South Asia significantly reduce the Asian monsoonal rainfall (Menon et al 2002, Song et al 2014, Li et al 2016, Xie et al 2016, Dong et al 2019), but increase NWC precipitation through some long-range impacts (Xie et al 2022). Owing to existence of the Taklamakan and Gobi deserts over this region, dust events, including strong dust storms, frequently occur throughout the year, especially in Spring (March–April–May) (Zhang et al 1997, Uno et al 2009). By analyzing observations at 16 sites in China, Zhang et al (2012b) found that natural dust aerosol is the largest aerosol component over NWC, occupying over 50% of PM10 mass concentrations. Associated with the Arctic climate change with global warming, a sharp decline of NWC dust events was observed during recent decades, especially since the late 1970s (Gong et al 2006, Zhang et al 2006, Wu et al 2018, Liu et al 2020, Shang and Liu 2020). Nevertheless, little attention has been paid to feedbacks of decreasing dusts over NWC on the regional precipitation due to inherent complexity of dust-cloud-climate interactions.
To investigate decreasing-dust effects on NWC precipitation, we conduct a suite of sensitivity experiments with different dust emission amounts using CAM5 with a new physical process that considers dust aerosols as INPs in mixed-phase clouds. In this paper, we quantify the effects of dusts on the regional precipitation, especially convective precipitation and extreme precipitation. We further show that decreasing dusts induce a significant increase in the NWC convective precipitation and thus regional wetting through a convection invigoration mechanism.
2. Observational and model data
2.1. Dust events and precipitation
Dust event data are directly derived from strong sand-dust storm in China and the Supporting Dataset provided by the China Meteorological Administration (CMA). According to the observation manual prepared by the World Meteorological Organization, the present weather code (ww) related to dust weather are ww = 06, 07, 08, 09, 30–35, 98. These dust event observations are classified into three categories based on the intensities (Shao et al 2013): dust storm event (DS), blowing dust event (BD), and floating dust event (FD). According to observational results about dust mass concentration differences among these three categories, it was found that if a DS occurs at a station, the mass concentration is almost 3 times greater than that of BD, or 9 times greater than that of FD (Wang et al 2008). To consider the weight coefficients for three categories in describing dust activity at the site, the overall frequency of all dust activities can be measured by dust event index (DI) defined as (Wang et al 2008, Lee et al 2014),

The surface-gridded precipitation data are from Monthly Dataset of surface climate data in China from CMA. The spatial resolution of precipitation dataset is 0.5° × 0.5° from 1961 to present based on 2472 station observations in China. According to Alexander (2016), for a model grid point or given station, the extreme precipitation events are defined when daily precipitation is larger than the 95th (or 99th) percentile value of all rainy days (daily precipitation >0.1 mm). Extreme precipitation (R95p or R99p) is defined as the sum of precipitation during all events exceeding the threshold.
2.2. CMIP6 and DAMIP
We use annual precipitation data of historical simulations from 14 GCMs in table S1 from the Detection and Attribution Model Intercomparison Project (DAMIP, Gillett et al 2016) in CMIP6 (Eyring et al 2016). Here, we used the historical all forcing simulations including all natural and anthropogenic forcings (ALL) and three single forcing simulations in DAMIP. The single forcing experiments include the well-mixed GHG only and AER only, as well as natural forcing only simulations (NAT), designed to quantify the relative contributions of different drivers to regional and global climate change. The first member for individual models is chosen for fair comparisons, although CMIP6 GCMs provide large ensemble members. All the simulated data are interpolated to a 2.5° × 2.5° horizontal resolution by bilinear interpolation.
2.3. CAM5
CAM5 is the atmospheric component of the Community Earth System Model version 1 (Neale et al 2010). The physical parameterizations of dust cycle processes in CAM5 are directly from dust entrainment and deposition model (Mahowald et al 2006). We use an improved size distribution for dust emissions based on brittle fragmentation theory (Kok 2011, Albani et al 2014). CAM5 adopts a two-moment stratiform cloud microphysics scheme, which can predict the mixing ratios and number concentrations of ice crystal and cloud droplet (Morrison and Gettelman 2008). The complete set of physics packages in CAM5 can be used to effectively investigate the aerosol direct and indirect effects (Ghan et al 2012). As suggested by Sagoo and Storelvmo (2017), we utilize an updated ice nucleation parameterization instead of the standard scheme (Meyers et al 1992), which enables the INP concentrations to be calculated based on the function of large dust particle concentration in addition to air temperature (DeMott et al 2015). This version reduces the efficiency of Wegner–Bergeron–Findeisen process to improve the cloud phase partitioning in mixed-phase clouds (Tan and Storelvmo 2016, Tan et al 2016). The deep convective cloud process in CAM5 is parameterized by the Zhang–McFarlane deep convection scheme in which the convective precipitation depends on properties that are closely related to local atmospheric instability (Zhang and McFarlane 1995).
2.4. Numerical experiments
Here, sensitivity experiments with different dust emission amounts in CAM5 are conducted to represent the effect of declining dust events. This GCM utilizes the finite-volume dynamical core with 0.9° × 1.25° in the horizontal resolution and 30 vertical levels. All the numerical experiments are performed with fixed monthly mean sea surface temperature and sea-ice concentrations during the whole simulated period. Two sets of numerical experiments including 25 year simulations are conducted: one with dust emissions (denoted dust experiment) and the other without dust emissions (nodust experiment). We further conduct an additional experiment with dusts but without dust-ice cloud interactions (DCI) in mixed-phase clouds (noice experiment). All the simulations are analyzed for the last 20 years of the 25 year numerical experiments. The difference between noice and dust experiments (noice-dust) represents DCI effect induced by decreasing dusts; the difference between nodust and noice experiments (nodust-noice) indicates dust direct effect (DDE); and the change between nodust and dust experiments (nodust–dust) represents the dust total effect (DTE = DCI + DDE). In addition to the extreme Nodust experiment, one sensitivity experiment is also conducted with half dust emissions (halfdust experiment). The dust emission factor, labeled by EF, can be used to change the amount of dust emissions. The default value of EF is 1/0.35. A value of EF = 1/0.7 is used to decrease the amount of dust emissions by half.
3. Results
3.1. Observational dust-precipitation relationships
Figure 1 summarizes inter-annual variations of DI and precipitation over NWC during 1961–2013. It shows a significant decline of DI over NWC (figure 1(a)) with −3.88 yr−1 (figure 1(b)). Furthermore, figure S1 shows a positive-to-negative transition of DI trend from 1977 to 1978, and a much steeper decreasing trend of DI since the late 1970s (−5.28 yr−1), indicating a sharp decline of NWC dust events during this period, mainly due to reductions of surface wind speeds (Wu et al 2022). Similar findings were previously reported, and related to the Arctic climate changes such as the Arctic amplification and loss of Arctic sea ice associated with global warming (Gong et al 2006, Zhang et al 2006, Wu et al 2018, Liu et al 2020, Shang and Liu 2020). Correspondingly, the NWC annual precipitation exhibited a much larger increasing trend (0.93 mm yr−1) since the late 1970s, compared to the trend of 1961–2013 (0.65 mm yr−1). These concurrent observational changes in dust events and precipitation over NWC indicate that the sharp decline of dust events may be a possible driver of the regional wetting over recent decades. Additionally, historical simulations show that GCMs significantly underestimate the NWC wetting (Chen and Frauenfeld 2014, Wu et al 2018, Xin et al 2020). We also show the absolute (figure 1(e)) and relative trend of precipitation (figure 1(f)) for a comparison between the observations and GCMs in CMIP6 (table S1), indicating large underestimation of precipitation trend, especially for relative trend. The underestimation suggests other physical mechanisms to further drive this regional wetting. Observational evidence shows a south-flood-north-drought pattern over eastern China during recent decades (e.g. Wang 2001, Zhou et al 2009), which is also shown in figure 1(c). Many previous studies have mainly attributed this dipole pattern to weakening of East Asian summer monsoon induced by anthropogenic aerosols and internal forcings (Zhou et al 2009, Wang 2001, Song et al 2014, Xie et al 2016).
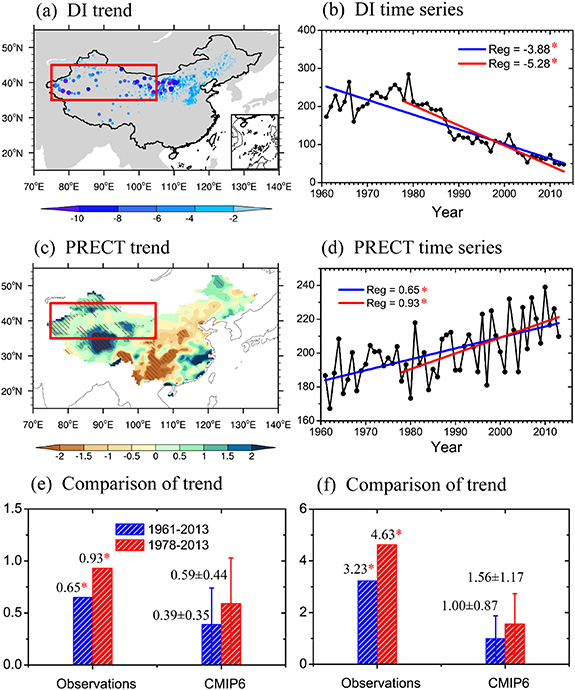
Figure 1. Linear trends of annual DI (dust event index) and total precipitation (PRECT) over NWC. (a) DI trend of years 1961–2013 based on CMA dust observations and (b) annual DI time series and trend of years 1961–2013 (blue line) and 1978–2013 (red line) over NWC (yr−1). (c), (d) The same as in (a), (b), but for CMA gridded PRECT (mm yr−1). (e) Observed and modeled absolute trend (mm yr−1) and (f) relative trend (% per decade) in CMIP6 during these two periods. Red box indicates the NWC region in (a), (c). Slanted lines in (c) represent significance at the 95% confidence level. Red stars in (b), (d)–(f) represent that the trends are statistically significant at the 99% confidence level. Bars in (e) and (f) represent ±1 the standard deviation for the muti-model ensemble.
Download figure:
Standard image High-resolution image3.2. Model results
To access the climate response to dusts, we firstly evaluate the spatial distribution and seasonal variations of climatology precipitation and dust burden over NWC against observations (or reanalysis) in figure S2. The CAM5 can generally capture the spatial distribution and seasonal variations of precipitation and dust burden. However, the CAM5 overestimates the regional precipitation and dust burden (figure S2), compared with GPCP precipitation (or MERRA-2 reanalysis of dust burden). Figure 2 further shows changes in annual precipitation induced by decreasing dusts over NWC, based on these sensitivity experiments with different dust emission amounts. The result indicates that decreasing dusts significantly increase annual precipitation over NWC in figure 2(a) with a regionally averaged value of 2.30 mm per month (almost 9% in table 1), with the largest percentage increase in the center of NWC in figure 2(b). The increased NWC precipitation is attributed mainly to DCI-induced change in figure 2(c), whereas the contribution of DDE is negligible (also see figure S3). Further inspection shows that the precipitation increase is dominated by DCI-induced change in convective precipitation with 2.65 mm per month (29.56% in table 1). Accordingly, extreme precipitation is also enhanced for R95p with 13.46% and R99p with 17.88% in table 1. Seasonal differences in figure S4 further substantiate that DCI-induced convective precipitation mainly occurs during March–May (MAM) and June–August (JJA), due to larger dust burden in these two seasons (figure S2(f)). These results support observational findings that significant NWC wetting is attributed mainly to the convective precipitation increase in boreal summer (Zhou et al 2010, Han et al 2016). In addition, the sensitivity experiment with half dust emissions also shows an increase in annual precipitation, especially convective precipitation (not shown). Therefore, decreasing dusts can significantly enhance the regional convective precipitation over NWC, and further decreases dust events by increasing regional soil moisture and vegetation cover (Liu et al 2004, Wu et al 2022), thus resulting in a positive feedback loop between reduced dusts and increased precipitation.
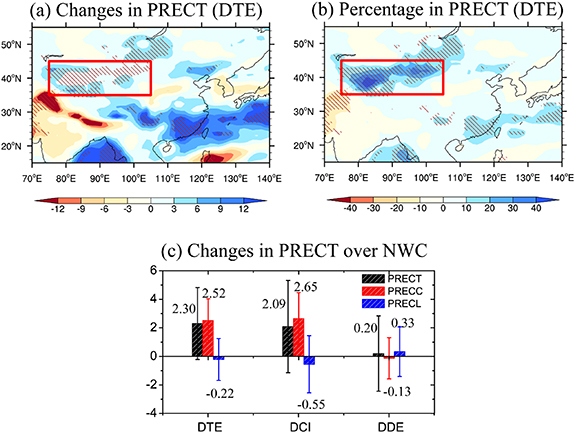
Figure 2. Changes in precipitation over NWC induced by decreasing dusts. (a) Spatial pattern of annual mean precipitation changes (mm per month) induced by decreasing dusts through dust total effect (DTE), and (b) the corresponding percentage change (%). (c) Changes in convective precipitation (PRECC), large-scale precipitation (PRECL), and total precipitation (PRECT = PRECC + PRECL) induced by decreasing dusts through dust-ice cloud interaction (DCI), dust direct effect (DDE), and DTE. Slanted lines (a), (b) represent significance at the 95% confidence level by a standard t-test and bars (c) represent ±1 standard deviation of interannual variability.
Download figure:
Standard image High-resolution imageTable 1. Changes in precipitation and extreme precipitation over NWC induced by decreasing dusts (nodust–dust). Percentage changes (%) induced by decreasing dusts in annual convective precipitation (PRECC), large-scale precipitation (PRECL), total precipitation (PRECT = PRECC + PRECL), and extreme precipitation (R95p and R99p) through dust-ice cloud interaction (DCI), dust direct effect (DDE), and DTE (DCI + DDE) over the NWC region.
| PRECT | PRECC | PRECL | R95p | R99p | |
|---|---|---|---|---|---|
| DTE | 8.89 | 28.44 | −1.29 | 13.95 | 16.65 |
| DCI | 8.16 | 29.56 | −3.32 | 13.46 | 17.88 |
| DDE | 0.73 | −1.12 | 2.03 | 0.49 | −1.23 |
To better understand physical mechanisms of regional precipitation change, we examine changes in cloud microphysical and macrophysical properties. Derived from Dust experiment, figure 3(a) presents the spatial pattern of dust burden with higher dust burden over the NWC region, owing to existence of the Taklamakan and Gobi deserts. Dust aerosols can effectively act as INPs in mixed-phased clouds to alter ice cloud microphysical properties (DeMott et al 2010, 2015, Kanji et al 2017, Tobo et al 2019). Decreasing dusts significantly reduce the ice number concentration (figure 3(b)), and increases ice effective radius (figure 3(c)) over East Asia, especially over NWC. Fewer but larger ice crystals induced by less INPs increase the solid hydrometeor fall velocity and precipitation efficiency, resulting in significant decrease in ice water path (figure 3(d)). However, fewer INPs lead to an increase in liquid water path (figure S5), mainly because of the weakened Wegner–Bergeron–Findeisen process in mixed-phase clouds (Lohmann and Feichter 2005, Shi and Liu 2019). Compared to the ice-phase hydrometeors, the changes in liquid droplet number concentration and effective radius are insignificant (figure S5) due to a limited ability of dust particles to serve as droplet nucleating particles (Kumar et al 1995). Dust-induced changes in the cloud microphysical properties further influence cloud macrophysical properties in middle-to-high attitudes through affecting the precipitation efficiency and cloud lifetime (Sagoo and Storelvmo 2017). There are significant decreases in cloud fraction (figure 4(a)) and cloud optical depth (figure 4(b)) in mid-high attitudes through DCI induced by decreasing dusts. Compared to DCI, the changes in cloud fraction and cloud optical depth through DDE are considerably smaller (figures 4(a) and (b)), mainly because DDE does not directly affect the cloud microphysical properties.

Figure 3. Changes in ice cloud microphysical properties over NWC induced by decreasing dusts. (a), spatial pattern of annual mean dust burden (mg m−2) derived from the dust experiment. Spatial distribution of changes between the nodust and dust experiments (nodust–dust) in (b) cloud-top in-cloud ice number concentration (cm−3), (c) ice effective radius (μm), and (d) grid-mean ice water path (g m−2). Slanted lines in (b)–(d) represent significance as in figure 2.
Download figure:
Standard image High-resolution image
Figure 4. Changes in clouds and climate over NWC induced by decreasing dusts. (a) Vertical profiles of annual mean changes in cloud fraction (%), (b) cloud extinction optical depth, and (c) air temperature (°C) induced by decreasing dusts through dust-ice cloud interaction (DCI) and dust direct effect (DDE). (d) Changes in the vertical temperature gradient (TG, °C), convective instability (CINS, °C), convective available potential energy (CAPE, 10 × J kg−1), and convective mass fluxes at 500 hPa (CMF, g m−2 s−1) through DCI and DDE. Bars represent ±1 standard deviation of interannual variability.
Download figure:
Standard image High-resolution imageFurthermore, we show the vertical profile of changes in air temperature induced by decreasing dusts over NWC through DCI and DDE in figure 4(c). A decrease in clouds on mid-high altitudes induced by decreasing dusts through DCI warms the low-level atmosphere (figure 4(c)) due to enhanced shortwave heating rate (figure S6(a)). Furthermore, the cloud change cools the mid-level atmosphere (figure 4(c)) through decreasing longwave heating rate (figure S6(a)). The low-level warming and mid-level cooling through DCI significantly enhance the vertical temperature gradient (−0.51 °C) between 400 hPa and surface in figure 4(d). We also calculate the mean regional convective instability, defined as the difference of equivalent potential temperature between 400 hPa and surface. The negative (positive) value of regional convective instability indicates the atmospheric instability (stability) associated with convective precipitation. Decreasing dusts result in a significant increase in convective instability, or a more unstable atmosphere owing to enhanced dipole structure of low-level warming and mid-level cooling. The enhanced regional convective instability leads to an increase of 2.83 ± 3.07 J kg−1 in convective available potential energy (CAPE) and convective mass fluxes of 0.21 ± 0.14 g m−2 s−1. These enhancements in CAPE and convective mass fluxes significantly increase the precipitation, especially convective precipitation and extreme precipitation in table 1. DDE shows insignificant and smaller changes in vertical temperature gradient, convective instability, CAPE and convective mass fluxes in figure 4(d), leading to insignificant change in precipitation (figure 2). Due to considerably larger precipitation increases in MAM and JJA, we also show the changes in these climate variables induced by dusts during the two seasons (figure S7), which is consistent with annual mean results in figure 4(d). Based on these results, we propose that the effect of decreasing dusts through enhancing atmospheric instability plays the non-ignored role in the convective invigoration and the increase of NWC precipitation.
4. Discussion
Note that three primary aerosol-induced convection invigoration mechanisms have been proposed in literature. The first mechanism depends on the cold-phase pathway such that a higher concentration of droplet nucleating particles suppresses warm-phase processes to loft more condensate through freezing level, which can enhance latent heat and buoyancy after cloud water freezing (Rosenfeld et al 2008). The second one depends on the warm-phase pathway such that a higher concentration of droplet nucleating particles enhances latent heat release through the condensation of additional water vapor (Fan et al 2018). Instead of through the microphysical pathway, the third one involves interactions between droplet nucleating particles, cloud microphysics, environmental humidity, and convective vigor through entrainment-detrainment processes (Abbot and Cronin 2021). The new convection invigoration mechanism proposed here is distinct from these mechanisms in that the existing mechanisms are all related to the increase of anthropogenic aerosols and droplet nucleating particles, whereas our new mechanism is through the decrease of INPs and the induced change in atmospheric instability conducive to deep convection.
Note that decreases of dust activity do not result in precipitation increase over North Africa where mixed-phase and ice clouds are rare in figure 5. North Africa has the largest desert and a largest dust burden over this region (figure 5(a)). Decreasing dusts reduce ice number concentration by decreasing INPs over North Africa (figure 5(b)), similar with NWC. However, total radiative forcing induced by decreased dusts is significantly negative over North Africa (figure 5(c)), which is dominated by dust-induced clear-sky radiative forcing (figure S8). Dusts in atmosphere can double the absorption of the shortwave radiation due to higher surface albedo over North Africa (Miller et al 2014, Xie et al 2018), indicating a negative radiative forcing induced by decreased dusts through DDE over this region in figure S8(b). On the other hand, fewer mixed-phase clouds occur in the low latitudes where North Africa resides than in mid-latitudes where NWC resides (Pruppacher and Klett 1997), suggesting that decreasing dusts have smaller DCI impact on mixed-phase clouds over North Africa than over NWC, which can be seen in the change of ice concentration as well (figure 5(b)). Hence, decreasing dusts induce a significant negative radiative forcing over North Africa, mainly because of reduced absorption of shortwave radiation through DDE. Therefore, DDE decreases the Sahara surface temperature (figure S9(a)), especially in JJA (figure S9(b)), and then reduces summer monsoonal circulation and summer precipitation (figures S9(c) and (d)). Hence, decreasing dusts significantly reduce precipitation over North Africa (figure 5(d)) through weakening the monsoonal circulation through DDE (figure S10), which has been shown in the previous studies (Miller et al 2014, Albani et al 2019, Balkanski et al 2021, Wang et al 2022).
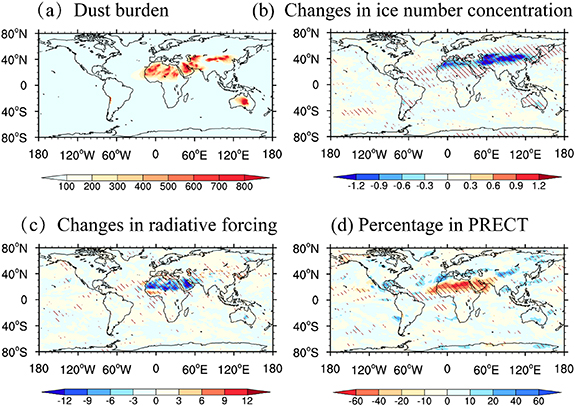
Figure 5. Changes in cloud microphysical properties, radiative forcings, and precipitation on a global scale induced by decreasing dusts. (a) Global distribution of annual mean dust burden (mg m−2) in the dust experiment. (b) Global changes between the nodust and dust experiments (nodust–dust) in cloud-top in-cloud ice number concentration (cm−3) and (c) total radiative forcing at the top of atmosphere (W m−2). (d) Global percentage change in annual mean total precipitation (PRECT, %).
Download figure:
Standard image High-resolution image5. Concluding remarks
Significant wetting and sharp decline of dust events have been observed to simultaneously occur over NWC during last few decades. These observations prompt us to propose the mechanism that the outstanding NWC regional wetting over recent decades may be caused by the decline of dust events in the same region. To test this hypothesis, a suite of sensitivity experiments with decreasing dust emissions are performed using CAM5 coupled with DCI. We show that decreasing dusts significantly enhance the regional precipitation through convection invigoration mechanism, strongly suggesting that the effect of decreasing dusts on mixed-phase clouds through working as INPs play the non-ignored role in recent NWC wetting. The mechanism of an increase in regional precipitation associated with NWC decreasing dusts is summarized in figure 6. Briefly, recent global warming induced by greenhouse gases leads to sharp decline in NWC dust event occurrences through enhancing the regional wetting and affecting the large-scale circulation, in combination with anthropogenic aerosols and internal forcing. Through a chain of changes of cloud microphysical and macrophysical properties, decreasing dusts enhance the vertical temperature gradient and local convective instability, resulting in the convection invigoration and enhancements in convective precipitation and frequency of extreme precipitation over NWC. Additionally, the increase in NWC precipitation reduces dust emissions through affecting land characteristics, which further enhances the regional convective precipitation through DCI, leading to a positive feedback loop between reduced dust and increased precipitation.

Figure 6. Schematic illustration of the precipitation increase associated with decreasing dusts over NWC.
Download figure:
Standard image High-resolution image
Although a formal attribution for NWC wetting is difficult with these sensitivity experiments, our results suggest that DCI may be a non-negligible driver of NWC wetting in recent decades and influence future regional climate change. Greenhouse gases from human activities are the most important driver of the twentieth-century climate change, which is also a basic mechanism of NWC wetting during recent decades (Zhou and Huang 2010, Jiang et al 2013, Han et al 2016, Peng and Zhou 2017). Additionally, anthropogenic aerosols over East Asia and South Asia also lead to increased NWC precipitation through affecting Asian westerly jet stream (Xie et al 2022). To further determine the causes of the observed wetting trend over NWC, we analyze the historical simulations in DAMIP including ALL, GHG, AER, and NAT in 14 CMIP6 models in table S1. For the ALL simulations in figure S11, the multi-model mean (MMM) shows an increasing trend of regional precipitation with 0.59 ± 0.44 mm yr−1 (table S2), which is much lower than that in observations (0.93 mm yr−1), especially for relative trend in figure 1(f). MMM results in DAMIP indicate a dominant impact of increasing greenhouse gases on NWC precipitation increase with 0.52 ± 0.49 mm yr−1 and a secondary impact of anthropogenic aerosols with 0.18 ± 0.44 mm yr−1 in table S2. The NAT-induced trend in MMM is small in figure S11. These DAMIP results strongly support previous findings about effects of anthropogenic greenhouse gases and aerosols. Noted that AER simulations in DAMIP are mainly focusing on anthropogenic aerosol change instead of natural aerosols (such as dusts). Our results indicate that the historical simulations may underestimate the aerosol effect on NWC wetting, due to ignored or deficient parameterizations of dust-ice cloud interactions in mixed-phased clouds (DeMott et al 2010, Sagoo and Storelvmo 2017). Therefore, further considering representations of dust-ice cloud interactions are necessary to reduce the discrepancy between observations and GCMs, and to improve prediction of future climate change.
Observational support for our mechanism comes from satellite measurement of dusty clouds as well, which reveals a decrease in cloud ice effective radius (Huang et al 2006) and an increase in ice water path in supercooled stratiform clouds (Zhang et al 2012a), compared to non-dusty clouds. These microphysical observations are in agreement with our simulated results. Nevertheless, it should be noted that there exist large uncertainties in aerosol-cloud interactions in GCMs, which strongly relies on ice nucleation parameterizations in mixed-phase clouds (DeMott et al 2010, Shi and Liu 2019, Burrows et al 2022). It is necessary to further check the convection invigoration mechanism induced by decreasing dusts over NWC using different ice nucleation parameterizations and different GCMs. Note that the observational and simulated results are both based on the climatology mean instead of severe convective cases. It is interesting to investigate the dust-ice cloud process in the mesoscale convective systems to utilize the cloud-resolving models (e.g. the Weather Research & Forecasting Model).
Acknowledgments
We thank Dr Navjit Sagoo at Stockholm University for providing the code of dust-ice cloud interactions in CAM5 and her valuable comments on the original manuscript and English proofreading. This research is supported by the National Natural Science Foundation of China (41991254), the Strategic Priority Research Program of the Chinese Academy of Sciences (XDB40030100), and the Science and Technology Innovation Project of Laoshan Laboratory (LSKJ202203300). X N Xie is supported by the National Natural Science Foundation of China (42175059 and 42275048) and the CAS 'Light of West China' program (XAB2019A02). Z G Shi acknowledges the support of the Youth Innovation Promotion Association of the Chinese Academy of Sciences. Y Liu and D Wang are supported by the U.S. Department of Energy's Atmospheric System Research (ASR) program. The Brookhaven National Laboratory is operated by the Brookhaven Science Associates, LLC (BSA), for the U.S. Department of Energy under Contract No. DE-SC0012704.
Data availability statement
All the CAM5 simulated data are available for the public from East Asian Paleoenvironmental Science Database (http://paleodata.ieecas.cn/FrmDataInfo.aspx?id=e41e6e46-75c5-405b-806c-848f86d27493). CMIP6 (DAMIP) data used in this study are available through https://dap.ceda.ac.uk/badc/. Observational data of dust events and precipitation from CMA are available through http://data.cma.cn/data/cdcdetail/dataCode/A.0012.0001.S011.html. MERRA-2 dust burden is available at https://disc.sci.gsfc.nasa.gov/datasets/. The GPCP version 2.3 monthly mean precipitation dataset is available at https://psl.noaa.gov/data/gridded/data.gpcp.html.
The data that support the findings of this study are openly available at the following URL/DOI: http://paleodata.ieecas.cn/FrmDataInfo_EN.aspx?id=e41e6e46-75c5-405b-806c-848f86d27493.
Supplementary data (2.2 MB PDF)