

Abstract
Global declines in insect populations have important implications for biodiversity and food security. To offset these declines, habitat restoration and enhancement in agricultural landscapes could mutually safeguard insect populations and their pollination services for crop production. The expansion of utility-scale solar energy development in agricultural landscapes presents an opportunity for the dual use of the land for energy production and biodiversity conservation through the establishment of grasses and forbs planted among and between the photovoltaic solar arrays ('solar-pollinator habitat'). We conducted a longitudinal field study across 5 years (2018–2022) to understand how insect communities responded to newly established habitat on solar energy facilities in agricultural landscapes by evaluating (1) temporal changes in flowering plant abundance and diversity; (2) temporal changes in insect abundance and diversity; and (3) the pollination services of solar-pollinator habitat by comparing pollinator visitation to agricultural fields near solar-pollinator habitat with other agricultural field locations. We found increases over time for all habitat and biodiversity metrics: floral rank, flowering plant species richness, insect group diversity, native bee abundance, and total insect abundance, with the most noticeable temporal increases in native bee abundance. We also found positive effects of proximity to solar-pollinator habitat on bee visitation to nearby soybean (Glycine max) fields. Bee visitation to soybean flowers adjacent to solar-pollinator habitat were comparable to bee visitation to soybeans adjacent to grassland areas enrolled in the Conservation Reserve Program, and greater than bee visitation to soybean field interior and roadside soybean flowers. Our observations highlight the relatively rapid (<4 year) insect community responses to grassland restoration activities and provide support for solar-pollinator habitat as a feasible conservation practice to safeguard biodiversity and increase food security in agricultural landscapes.
Export citation and abstract BibTeX RIS

Original content from this work may be used under the terms of the Creative Commons Attribution 4.0 license. Any further distribution of this work must maintain attribution to the author(s) and the title of the work, journal citation and DOI.
1. Introduction
Insects serve many roles for ecosystem function, including nutrient cycling, plant pollination and seed dispersal, maintaining soil quality, and occupying important trophic levels as both natural predators and prey (Scudder 2017). Observed declines in insect populations world-wide have understandably raised concerns regarding impacts to these ecosystem functions and implications for human well-being (Sanchez-Bayo and Wyckhuys 2019). Most notably has been the impact of insect declines on agricultural production through loss of pollination services and natural pest management (Wratten et al 2012, Potts et al 2016). Approximately 75% of global crop production is at least partially reliant upon pollination by insects (Klein et al 2007), underscoring the importance of insect pollinator conservation for human food production. In addition, insect biodiversity in agricultural landscapes is important for natural pest control, and loss of beneficial insect predators can result in reduced crop yield and increased use of pesticides (Kovács‐Hostyánszki et al 2017).
Primary factors contributing to the decline in global insect biodiversity include habitat loss, pesticides, and climate change (Sanchez-Bayo and Wyckhuys 2019). Paradoxically, habitat loss due to agricultural intensification has contributed to insect population declines in many rural landscapes (Ekroos et al 2016). As a result, conservationists have suggested that habitat restoration and enhancement in agricultural landscapes could mutually safeguard insect populations and their pollination services for crop production. This has been put into practice across the U.S. through the Conservation Reserve Program (CRP), which was implemented by the U.S. Department of Agriculture (USDA) Natural Resources Conservation Service (NRCS) over 3 decades ago. The program has aided conservation efforts by retiring millions of acres of farmland from cultivation in marginal or ecologically sensitive areas and restoring those areas to native grasses and pollinator-friendly vegetation (Arathi et al 2019, Dolezal et al 2021, United States Department of Agriculture [USDA] 2023a). In addition, evidence suggests that restoring habitat close to pollinator-dependent crops could increase biodiversity and pollination services (Morandin and Kremen 2013, Blaauw and Isaacs 2014, Feltham et al 2015, Kordbacheh et al 2020, Levenson et al 2022, Mota et al 2022). For example, Blaauw and Isaacs (2014) found that wildflower plantings near blueberry (Vaccinium corymbosum L.) fields were temporally associated with greater blueberry pollination visitation by native bees and resulted in significant increases in blueberry yield parameters.
Given the associations between insect biodiversity, habitat, and agricultural production, land use and land cover changes in agricultural landscapes can have profound effects on insect populations and their ecosystem services (Millard et al 2021). In agricultural landscapes across the U.S., renewable energy developments represent a growing form of land use change (Hernandez et al 2015, Walston et al 2021). Utility-scale solar energy developments (ground-mounted photovoltaic (PV) facilities >1 MW) require large amounts of relatively flat, open land, making former agricultural fields ideal locations to site these projects (Adeh et al 2019). A 2021 examination of utility-scale solar energy facilities in the Midwestern U.S. found that 70% of all solar facility footprints in the region were previously used for row crop agriculture, equating to a land cover/land use change of nearly 2400 ha (24 km2) (Walston et al 2021). This relatively rapid rate of land cover/land use change is expected to continue in the coming decades. For example, by 2035, as much as 1000 gigawatts (GW) of utility-scale solar development is needed to keep the country on track for its net-zero carbon emission goals ([DOE] U.S. Department of Energy 2021), representing over a 10X increase in current solar energy deployment ([EIA] Energy Information Administration 2023). The 2035 U.S. solar energy target could require up to 3 million ha (3000 km2) of land, based on an assumed solar energy land use requirement of approximately 3 ha per MW (Ong et al 2013, Walston et al 2021). While future solar developments may be sited in a variety of locations, many agricultural lands suitable for solar energy are likely to be developed.
Siting facilities to avoid environmentally sensitive areas is one of the most important ways to minimize the environmental impacts of solar energy development (Jager et al 2021) and dual use land use strategies can lessen the impact of developments in agricultural landscapes (Hernandez et al 2019). Dual land uses, such as the co-location of solar energy with agricultural activities ('agrivoltaics') and habitat restoration, take advantage of the solar facility's relatively large footprint to improve the site's land use efficiency and ecosystem services output (Barron-Gafford et al 2019, Walston et al 2022). One form of habitat restoration at solar sites, commonly referred to as 'solar-pollinator habitat', focuses on the establishment and maintenance of grasses and forbs among the solar panels which, if managed properly, can provide habitat for insects and other wildlife. Under this broad concept, solar-pollinator habitat has the potential to minimize solar energy impacts by supporting biodiversity, agricultural health, and other ecosystem services such as preserving water quality, runoff and erosion control, and carbon sequestration (Graham et al 2021, Walston et al 2021).
The establishment and management of solar-pollinator habitat is a relatively novel concept and most of what is reported about the ecological and ecosystem services benefits of this practice is theorized from models and results from other habitat restoration studies (e.g. Walston et al 2021). There is little empirical evidence on the establishment of vegetation at solar facilities and resulting biodiversity responses (but see Graham et al 2021). Fundamental research is therefore needed to systematically describe the biodiversity outcomes of this novel land use across different regions and vegetation management practices. To address these basic research needs, we conducted a longitudinal field study across 5 years (2018–2022) to understand how insect communities respond to newly established habitat on solar energy sites in agricultural landscapes. We were also interested in understanding whether the establishment of solar-pollinator habitat resulted in any 'spillover' effects in pollinator and beneficial insect visitation to nearby crop fields such as soybeans (Glycine max). Soybean is one of the most extensively grown crops worldwide and while it is capable of self-pollinating, studies have shown yield increases as a result of bee visitation (Garibaldi et al 2021, Levenson et al 2022). Our objectives were to address the following three research questions:
- Does flowering plant abundance and diversity on solar sites increase over time?
- Does insect abundance and diversity within the solar sites increase over time?
- Does proximity to solar-pollinator habitat influence bee visitation to croplands near the solar facilities?
2. Methods
2.1. Study sites
Our study took place between 2018 and 2022 at two utility-scale solar energy facilities in southern Minnesota, USA: the Atwater Solar Site (45.1410° N, −94.7702° N) and Eastwood Solar Site (44.1545° N, −93.9164° N). Both solar energy sites are operated by Enel Green Power North America and are located in rural landscapes between 100 and 200 km from Minneapolis, MN. The solar sites are separated by 160 km and 1° of latitude (figure 1(A)). Construction for both sites was completed in 2017. The Atwater Solar Site is 14 ha in size with a nameplate electrical capacity of 4.0 megawatts (MW) (alternating current [AC]). The Eastwood Solar Site is 17 ha in size with a nameplate electrical capacity of 5.5 MW AC. Both solar facilities are constructed as arrays of monocrystalline PV solar panels mounted on 2 m high racking with single axis tracking systems. Light sensors in the trackers allowed the panels to rotate and follow the sun throughout the day. At both sites, arrays were positioned north-to-south, allowing panels to track the east-west daily orientation of the sun (figures 1(B) and (C)). At lowest vertical orientation each day, the lower edge of panels is approximately 0.9 m above ground.

Figure 1. Study site locations. (A) The two solar sites examined in this study are located in southcentral Minnesota. (B) Atwater Solar Site, showing the locations of transects within the test plot area and the sheep grazing area. (C) Eastwood Solar Site, showing the locations of transects within the test plot areas. (D) An example transect at the Eastwood Solar Site.
Download figure:
Standard image High-resolution imagePrior to solar energy development, both sites were previously used for decades for row crop agricultural production. The solar facilities were constructed with plans to minimize impacts to soils. For example, in an effort to preserve soil quality and productivity, the solar sites were not graded (except for the construction of access roads). Both sites remained adjacent to row crop agriculture on at least 2 sides throughout our study (figures 1(B) and (C)).
2.2. Habitat restoration & management
After construction, both sites were prepared for restoration with native plantings of grasses and forbs. In spring 2017, both sites were pretreated with Glyphosate herbicides applied at manufacturer rates to prevent the growth of invasive nonnative species that may have seed banks in the soil (e.g. Canada Thistle [Cirsium arvense]). In summer and fall 2017, the entirety of each site was planted with several mixes of native grasses and forbs (some mixes designed for mesic and others for wet areas) through a combination of manual and broadcast seeding applications. The objectives of planting these seed mixes were to restore native habitat for insects and wildlife and control onsite soil and water losses. Each mix included several native forb species that flower in spring, early summer, and late summer. In spring 2018, experimental test plots on both sites received second Glyphosate herbicide applications. Then in June 2018, a second round of specific seed mixes of native grasses and forbs were planted at these experimental plots (figure 1). The experimental test plots totaled approximately 0.8 ha (2 acres) in size and were created as part of a larger study to evaluate the establishment of individual plant species and native seed mixes (McCall et al ). See table S1 in the supplementary material for a summary of the seed mixes. The restoration seed mixes included a variety of perennial species obtained from a local nursery (Minnesota Native Landscapes, MNL). Vegetation management (conducted by MNL) of the sites throughout all 5 years of the project included seasonal mowing and spot herbicide applications to control woody species encroachment. In 2021, sheep grazing was introduced at both sites as an alternative method to mowing (figure 1(B)). No livestock grazing was conducted in the experimental test plots. The experimental test plots contained the same native forbs and grasses planted throughout the rest of the sites. The fundamental differences between the experimental test plots and the rest of the sites were that (a) the test plots were planted with additional species that were not planted in other portions of the sites (supplemental table S1) and (b) no sheep grazing occurred within the experimental test plots.
2.3. Field work & experimental design
Observational surveys were conducted to collect data on the insect and plant communities across several sampling areas each year from 2018 to 2022. Beginning in 2018, we established between 6 and 8 30 m (100 ft) long transects within both test plots and the other restored areas on the solar sites (figure 1). Transects were 2 m wide and most of them were centered between two rows of panels. Two transects were placed in open (full sun) restored areas within each site. Transects between the panels received greater amounts of shade cast by the panels, especially in the early morning and late afternoon. The amount of shade can impact insect visitation (Graham et al 2021), and we controlled this effect by maintaining a consistent sampling protocol and consistent overall time of day for sampling for all site visits across all years of the project. We maintained the number and location of onsite transects each year and visited each site multiple times throughout the summer season each year to record observations of vegetation and insect activity. With exception of the first baseline year (2018), a total of four bi-weekly survey trips were conducted each year during the peak flowering season beginning in early July and ending in late August, with each transect generally surveyed 1–2 times per trip. In the baseline year (2018) we conducted only one survey trip between 21 and 23 August.
During each visit, we conducted observational surveys for agriculturally-beneficial insects—insects that are agriculturally important as pollinators, natural enemies for pest control, or both (Getanjaly et al 2015). We used a systematic transect-based method consistent with the Xerces Streamlined Bee Monitoring Protocol (Ward et al 2014). Our protocol involved two observers walking each transect for 5–8 min searching for pollinators and beneficial insects in situ, taking care not to double-count individuals. We defined pollinators and beneficial insects as any insect belonging to any of the following 4 orders: Hymenoptera (bees and wasps), Diptera (flies), Lepidoptera (moths and butterflies), and Coleoptera (beetles). To maintain consistency, at least one of the three authors (LW, HH, LF) were present for each transect observation. A transect observation represented a single completed transect walked by observers in which pollinators and beneficial insects were counted. Our goal was to achieve Family-level identification for each of these insects observed. Where feasible, we took photographs of vegetation and pollinators for later identification. Doing so allowed us to identify most pollinator observations to Family and regularly to Genus. In addition to insect surveys, we also recorded flowering vegetation species observed in the transects and estimated transect floral abundance using a simple floristic index similar to one previously used in Feltham et al (2015). At each transect observation we scored floral abundance as (1) rare (<50 flowers); (2) occasional (50–100 flowers); (3) frequent (100–250 flowers); or (4) abundant (>250 flowers). Like Feltham (2015), we defined a flower 'unit' as a single flower or spike, one umbel or head for multiflowered stems.
Beginning in 2019, we also established offsite transects in soybean (G. max) fields adjacent to and near the solar sites in order to measure pollinator visitation to soybean flowers at various distances from the solar facilities. The dimensions of these agricultural transects were identical to the onsite transects and the same protocols were used for conducting pollinator observations. Due to interannual soybean-corn crop rotation schedules, the location and number of our agricultural transects was adjusted each year to maintain co-location with nearby soybean fields. We established four types of agricultural transects in this study:
Solar-Habitat Adjacent: Transects at the edge of soybean fields adjacent to the solar sites that were within 15 m of the onsite restored habitat area. These transects were within the first 6 rows of the soybean fields.
Soybean Field Interior: Transects in soybean fields with field boundaries adjacent to a solar site but located in the interior of the soybean field, at least 100 m from the solar facility and at least 50 m from the nearest field edge.
Reference Roadside: Transects in reference soybean fields between 750 m and 1000 m away from the solar facility that were placed within the first 6 rows adjacent to a county road.
Reference CRP: Transects in reference soybean fields between 750 m and 1000 m away from the solar facility that were placed within 10 m from grassland areas enrolled in the Conservation Reserve Program (CRP).
Maps of offsite agricultural transect configurations are provided in the supplementary materials (figures S1 and S2). The minimum distance for the reference roadside and reference CRP transects (750 m) is within the reported foraging distance for honeybees and near the maximum foraging distance for many native bee species (Greenleaf et al 2007, Kennedy et al 2013). Because we were more interested in responses of the native insect pollinator community, we assumed any effects of the presence of the solar sites on insect visitation to these reference areas would be minor and would have little impact on our analyses. We were not able to locate any apiaries within 3 km of either solar site; therefore, we assumed the regional amount of honeybee management was constant across all years of this study.
We surveyed all transects during optimal environmental conditions for pollinator activity: ambient air temperatures greater than 18 °C (65 °F), low cloud cover, low wind speeds (<16 km per hour), and no rain. Temperature, cloud cover, and wind speeds were determined using weather data from the nearest weather tower through mobile phone applications such as WeatherBug® (www.weatherbug.com/). All surveys were conducted during the day between 0900 h and 1500 h. Wind speed was estimated using a hand-held anemometer. We either did not survey or later omitted transect observations when at least one of these environmental conditions were not met. We omitted two transects at the Atwater Solar Site that were grazed beginning in 2021. All other transects were outside of the grazing areas and included in analyses.
2.4. Data & analyses
We aggregated bi-weekly transect observations by determining the average number of each insect taxonomic group observed at each transect per year. Thus, each transect represented a single sampling unit that was repeatedly measured over 5 years. Due to unequal transect observations within and across years, we averaged insect observations rather than calculating the sum to determine insect abundance. We calculated five habitat and biodiversity metrics from the aggregated onsite transect observations: floral abundance, flowering plant species richness, diversity of the insect community, total insect abundance, and native bee abundance. We defined measures of floral abundance and flowering species richness as the maximum floral index and sum of flowering species each year, respectively. We then calculated insect group diversity using the Shannon–Weaver Diversity Index (H'; Shannon 1948). Diversity was calculated for the following eight insect groups: honeybees, native bees, wasps and hornets, hoverflies (Family Syrphidae), other flies, moths, butterflies, and beetles.
For the offsite agricultural transects, our primary metric of interest was visitation by pollinators and beneficial insects to open soybean flowers. We first filtered our agricultural observations to the weeks corresponding to the soybean bloom period, as recorded by observers in the field. We then calculated insect visitation to soybean flowers in the same manner as onsite transects by averaging the number of insects observed in each soybean transect per year. In particular, we quantified the following two soybean visitation metrics: (a) visitation by all beneficial insects and (b) bee visitation, including native bees and honeybees. We did not calculate diversity or habitat metrics for the offsite agricultural transects.
All calculations of habitat and biodiversity metrics, as well as all statistical analyses, were conducted with R version 4.2.1. Shannon–Weaver diversity index values (H') for the insect groups were calculated using the 'diversity' functions in the vegan package (Oksanen et al 2019). Onsite, our primary research question was whether the habitat and biodiversity metrics changed over time after planting of the solar-pollinator habitat. We therefore modeled the linear or nonlinear changes in these metrics across years by fitting general additive models using the 'gam' function in the 'mgcv' package (Wood and Scheipl 2017). For all tests, we used 4 knots which allowed for sufficient curviness to represent observed patterns and to produce linear or nonlinear relationships between observed and fitted values. We began by developing simple null models and linear fits to the data and incrementally developed progressively more complex models. We used year as the single predictor smoothing factor, and developed models using random effects of solar site, transect, and transect nested within solar site. For insect group diversity and abundance metrics, we also included floral abundance as a random effect. GAM models were created using the negative binomial family distribution (e.g. gam(insect.abundance ∼s(Year, k = 4) + s(solar.site, bs = 're'), family = nb()). Residuals were checked using the function gam.check (package: mgcv) and we evaluated all GAMs for each response variable through comparison of AICc values (tables S3–S6).
Because soybeans have a relatively short bloom period (4–6 weeks), we expected a greater number of pollinator and beneficial insect observations on the solar sites compared to the agricultural fields. For this reason, our focus was not comparison of insect community composition between the solar sites and the agricultural fields. Rather, we sampled within adjacent soybean fields to understand whether pollinator and beneficial insect visitation to soybeans could be influenced by proximity to solar-pollinator habitat. To examine the effect of field location on insect visitation in offsite agricultural transects, we used generalized linear mixed models (GLMMs) to examine the effect of field location on insect visitation using the 'lme4ʹ package in R (Bates et al 2015). With field location being the single fixed effect, we built GLMMs of various levels of complexity using Year and Site as random factors and nested models with transect nested within Site and Year. The response variables used to describe visitation were average annual total beneficial insect visitation (average of all beneficial insects per transect per year) and average bee visitation, including native bees and honeybees. All GLMMs were modeled using a negative binomial distribution to model the visitation response variables. The GLMMs were compared using AICc and we selected the model with the lowest AIC value as the final model (table S7). We confirmed there was no overdispersion in our final model using the 'blmeco' package (Korner-Nievergelt et al 2015). To test the overall effect of field location, we followed the GLMM with a type II Wald χ2 test using the 'Anova' function in the 'car' package (Fox and Weisberg 2011). Differences among field locations were examined with user-defined contrasts using the package 'multcomp' (Hothorn et al 2008). In these post-hoc tests, we focused solely on the pair-wise comparisons between solar-adjacent soybean transects and the other three field locations (i.e., CRP-adjacent, roadside, and soybean field interior) using the false discovery rate (FDR) adjustment for multiple comparisons (Benjamini and Hochberg 1995). For all GAM and GLMM models, data visualizations were created using 'ggplot2ʹ (Wickham 2016).
3. Results
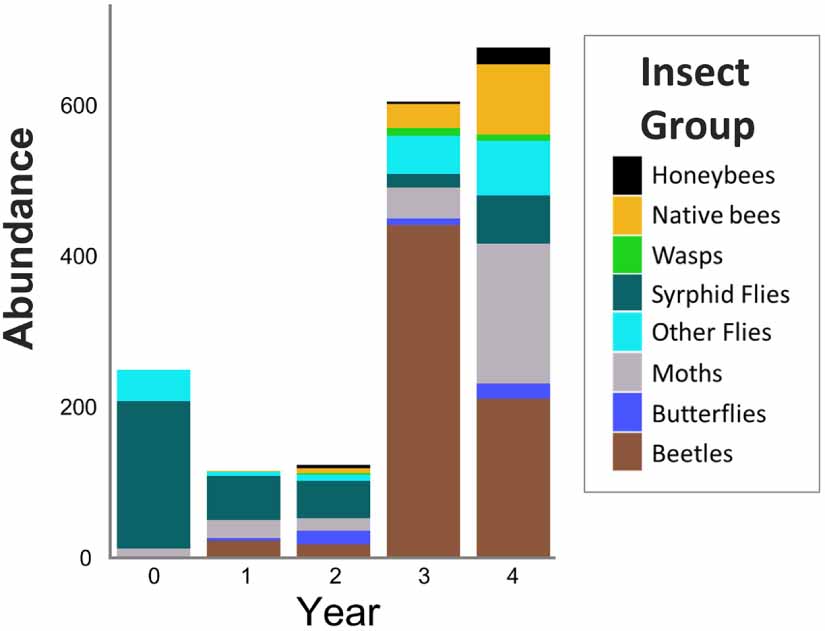
We made a total of 358 transect observations in the onsite solar-pollinator habitat areas between August 2018 and August 2022. Aggregating repeated within-year transect observations resulted in a final dataset of 54 transect observations in which we calculated average beneficial insect abundance, maximum floral abundance rank, and total flowering plant species richness. Of these aggregated transect observations, 20 occurred on the Atwater Solar Site and 34 occurred on the Eastwood Solar Site. We detected a total of 10 943 beneficial insects across both solar sites, spanning 4 orders (Hymenoptera, Diptera, Lepidoptera, Coleoptera) which we summarized to insect groups. The most numerous insect groups we observed were beetles (primarily goldenrod soldier beetles [Chauliognathus pennsylvanicus]; 35.1% of total observations), Syrphid flies (primarily Toxomerus sp.; 19.5% of total observations), and moths (17.2% of total observations) (figure 2). We observed distinct temporal shifts in the insect community. Syrphid flies were the dominant pollinator group observed from years 0–2. In Years 3 and 4, our observations were dominated by soldier beetles (C. pennsylvanicus).

Figure 2. Relative abundance of insect groups observed in transects monitored at two solar energy sites in Minnesota over a 5 year period. Abundance of each pollinator group was calculated as the aggregated number of pollinators observed summed across all transects each year.
Download figure:
Standard image High-resolution image3.1. Habitat metrics over time
Throughout all 5 years of this study we observed 37 different flowering plant species within the onsite habitat transects (table S2). Floral abundance and flowering plant species richness increased over time following seeding in year 0 (figures 3(A) and (B)) and there were no differences in these responses between the two solar sites (table 1). Using the best-ranking GAMs, year explained 61.4% and 84.8% of the variability in floral abundance and flowering species richness, respectively (table 1).
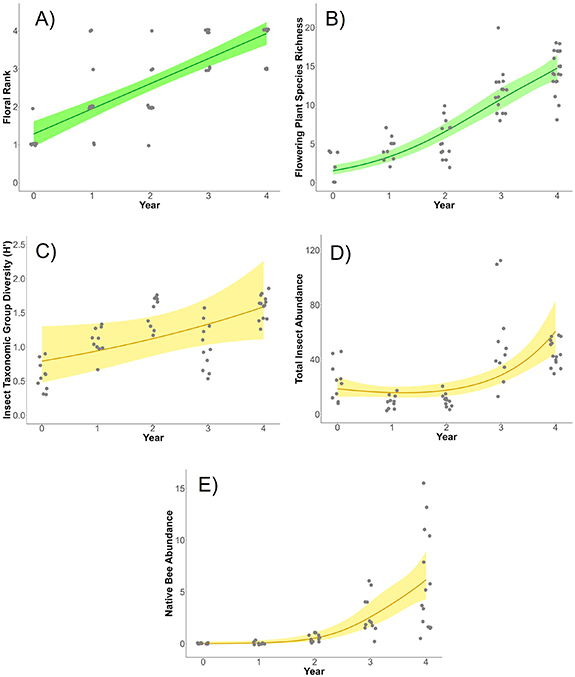
Figure 3. Observed and predicted measures of habitat and biodiversity metrics for (A) floral rank, (B) flowering plant species richness, (C) insect taxonomic group diversity, (D) total insect abundance, and (E) native bee abundance. Points represent average annual observations for each transect. Lines represent the predictions (with 95% confidence intervals) using generalized additive models.
Download figure:
Standard image High-resolution imageTable 1. Generalized additive model (GAM) results for the effect of (A) year and (B) site on measured habitat and biodiversity metrics. Results are for the best-ranked GAM for each response variable (see supplement).
| (A) Year effects (fixed effect) | |||
|---|---|---|---|
| Response variable | Test statistic | p | R2 |
| Floral abundance | 14.63 | <0.001 | 0.616 |
| Flowering species richness | 17.74 | <0.001 | 0.896 |
| Insect group diversity | 1.961 | 0.045 | 0.400 |
| Total insect abundance | 79.57 | <0.001 | 0.636 |
| Native bee abundance | 13.27 | 0.002 | 0.667 |
| (B) Site effects (random effect) | |||
| Response variable | p | ||
| Floral abundance | 0.487 | ||
| Flowering species richness | 0.148 | ||
| Insect group diversity | 0.686 | ||
| Total insect abundance | 0.132 | ||
| Native bee abundance | 0.491 | ||
| (C) Floral rank effects (random effect) | |||
| Response variable | p | ||
| Floral abundance | — | ||
| Flowering species richness | 0.576 | ||
| Insect group diversity | 0.528 | ||
| Total insect abundance | 0.001 | ||
| Native bee abundance | 0.003 | ||
| (D) Flowering species richness effects (random effect) | |||
| Response variable | p | ||
| Floral abundance | 0.244 | ||
| Flowering species richness | — | ||
| Insect group diversity | 0.181 | ||
| Total insect abundance | 0.675 | ||
| Native bee abundance | 0.023 | ||
a Test statistic is Z value for linear models without smoothing parameter (Floral abundance, Insect group diversity) and Chi-square value for GAM models with smoothing parameter.
3.2. Biodiversity metrics over time
The biodiversity metrics also increased over time, with year explaining 44.0%, 63.6%, and 66.7% of the variation in insect group diversity, total insect abundance, and native bee abundance, respectively (table 1; figures 3(C)–(E)). Similar to the habitat metrics, there were no differences in biodiversity responses between solar sites (table 1). However, some of these biodiversity responses were also influenced by floral rank and flowering plant species richness (table 1). For example, floral rank positively affected both total insect abundance and native bee abundance. Over the 5 year study period, insect group diversity increased nearly linearly by approximately 150%. Trends in total insect abundance and native bee abundance exhibited exponential patterns of increase. By the end of the 5 year study period, total insect abundance had tripled, and native bee abundance had increased from near-zero average transect observations in year 0 to over 5 average transect observations in year 4.
There was an inflection in the biodiversity data after Year 2, with abundance measures showing noticeable increases following that year (figures 3(D) and (E)). We observed a total of 729 native bees during the study, and over 80% of those observations occurred after Year 2. We identified all but 65 native bees to belong to one of two families: Apidae and Halictidae. Halictidae was the most abundant bee family observed, accounting for over 70% of the native bee observations. The majority of these observations were sweat bees (Lasioglossum sp.) and furrow bees (Halictus sp.). 20% of our native bee observations were bumblebee species (Bombus sp.) in the family Apidae.
3.3. Offsite agricultural visitation
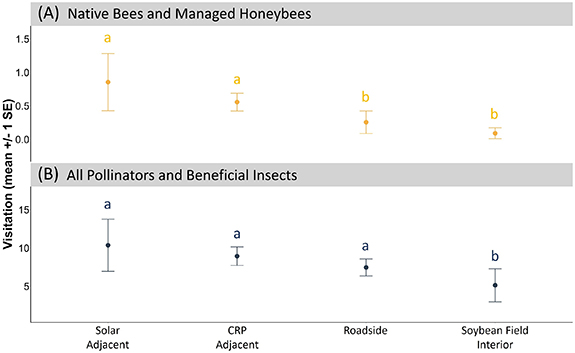
We made a total of 52 transect observations in the soybean fields between 2019 and 2022 during the soybean bloom period, which generally occurred during the month of July each year. Within these transects, we observed a total of 509 pollinators and beneficial insects, of which 23 were bees (14 native bees, 9 honeybees). 70% of the insects observed in the soybean fields were syrphid flies (family Syrphidae). All native bees observed visiting soybean flowers were bumblebees (Bombus sp.). Visitation of pollinators and beneficial insects to soybean flowers differed by field location (table 2). Bee visitation to soybean flowers adjacent to solar-pollinator habitat was comparable to bee visitation adjacent to CRP grasslands, and approximately 2 times and 2.5 times greater than bee visitation at roadside and soybean field interior transects, respectively. For all pollinators and beneficial insects, there were no differences in visitation between solar-adjacent soybean transects and CRP-adjacent or roadside soybean transects. However, these locations did have greater visitation than soybean interior transects (figure 4).
Figure 4. Observed (A) native bee and managed honeybee and (B) total pollinator and beneficial insect visitation to soybean flowers across different field locations. Error bars represent the standard error of the mean. Different letters indicate a significant difference among field locations at the p = 0.05 level using the false discovery rate (FDR) adjustment for multiple comparisons (Benjamini and Hochberg 1995).
Download figure:
Standard image High-resolution image
Table 2. Effect of field location group on bee visitation to soybean flowers in agricultural fields near the solar facilities. Results are for the best-ranked GLMM for each response variable (see table S8 in the supplemental materials).
| Response variable | df | χ2 | p |
|---|---|---|---|
| Total pollinator and beneficial insect visitation | 4 | 38.111 | <0.001 |
| Bee visitation | 4 | 116.11 | <0.001 |
4. Discussion
Our results provide the first empirical field evidence on the interannual, temporal changes in insect communities following the planting of pollinator habitat at solar energy facilities. Consistent with other studies, our observations highlight the relatively rapid (<4 year) insect community responses to grassland restoration activities (Griffin et al 2017, Onuferko et al 2018, Lanterman Novotny and Goodell 2020, Purvis et al 2020). As predicted, all habitat and biodiversity metrics increased each year following conversion from cropland to solar-pollinator habitat. By the end of the 5 year study period, we observed a 7-fold increase in flowering plant species richness, on average, within the onsite habitat transects. In that same time, abundance of insect pollinators and beneficial insects tripled, and insect group diversity increased by an average of 13% per year. Remarkably, we observed an exponential increase in the abundance of native bees, which increased over 20-fold during this study, with most observations occurring after Year 2.
Our findings on the solar sites were restricted to the experimental test plots which were planted with additional plant species and managed differently than the rest of the solar sites. A total of 66 species of native grasses and forbs were planted throughout the two solar sites. An additional 61 species were planted in the experimental test plots (supplemental table S1). Areas outside the experimental test plots were mowed more frequently and were also strategically grazed with sheep during the last two years of the project. Despite these differences, the dominant flowering native species observed in the experimental test plots were consistent with the observations of groundcover establishment within the larger PV array area (as documented in McCall et al ). The dominant flowering native species observed at both solar sites included Black-eyed Susan (Rudbeckia hirta), Spotted Bee Balm (Monarda punctata), and Goldenrod (Solidago sp.); see supplemental table S2 for a complete list of flowering plant species observed within the experimental test plots. Future research should be designed to examine site-level variation in vegetation management, with sampling designs that are more dispersed throughout the solar facilities, to better understand the biodiversity responses across the entire solar site.
The purpose of our study was to describe the interannual, temporal changes in the insect community in the years following the planting of solar-pollinator habitat. We did not conduct surveys in CRP grassland areas during this study to determine how the insect community in the solar-pollinator habitat compared to offsite reference grasslands. However, several other studies have demonstrated how insect abundance and diversity within restored areas have reached levels comparable to reference grasslands within a relatively short amount of time (<4 years). For example, in a study of restored grasslands across North America, Purvis et al (2020) found wild bee diversity increased sequentially following restoration and approximated bee communities in reference grassland sites after 1–4 years. Similarly, Onuferko et al (2018) found that wild bee abundance and species richness increased rapidly in the first 4 years following grassland restoration to resemble bee communities in reference grassland areas. Onuferko et al (2018) also noted long-term persistence of the bee community in the restored grassland for over 10 years (the length of the study). The rapid increase in insect group abundance and diversity we observed, especially native bees, is similar to these studies and highlights the potential for these plantings to benefit local insect communities. In the only other published field study on insect responses to solar-pollinator habitat in the U.S., Graham et al (2021) recorded the establishment of native pollinator-friendly vegetation at a solar facility within 2 years of planting and described the interactions between vegetation and micro-scale locations within a solar facility on pollinator abundance and diversity. They found insect abundance, diversity, and richness were similar in full sun and partial shade regions of the solar facility where solar-pollinator habitat was planted, both of which were greater than full shade regions of the solar facility. Our study did not include transects in full shade regions directly under the solar panels.
Along with observed annual increases in insect group abundance and diversity within the solar-pollinator habitat transects, we also found positive effects of proximity to solar-pollinator habitat on bee visitation to nearby soybean fields. We found that bee visitation to soybean flowers adjacent to (i.e. within 15 m of) solar-pollinator habitat was comparable to soybean visitation adjacent to CRP grasslands, both of which were greater than bee visitation to soybean field interior and roadside soybean transects (though the difference was only significant for soybean field interior; see figure 4). As bee visitation is often used as an indicator of pollination services (Ricketts et al 2008), these results suggest that solar-pollinator habitat could help improve soybean production, similar to CRP and other conservation grassland systems through the 'spillover effect' (Levenson et al 2022). The rationale behind the spillover effect is that habitat establishment in agricultural areas will increase populations of insect pollinators, which will result in the spillover of these insects into crop fields that will increase crop pollination and help improve crop yields (Morandin and Kremen 2013). Future research focused on the seasonal variation in insect community responses to solar-pollinator habitat will help identify the seed mixes and best management practices that optimize the agricultural services of solar-pollinator habitat by maximizing the spillover of insect pollinators and beneficial insects during the months that these services are most needed.
The insect community responses to solar-pollinator habitat we observed—both within the onsite habitat test plots and visitation to adjacent soybean fields—underscores two important potential implications of solar-pollinator habitat. First, solar-pollinator habitat can play an important role in conserving biodiversity in agricultural landscapes. Given the increasing amount of ground-mounted solar energy that is expected to be developed by 2035 ([DOE] U.S. Department of Energy 2021), solar-pollinator habitat can offset losses of natural areas and restored grasslands in agricultural landscapes to support pollinators and their agricultural services. The CRP program is a nationally recognized grassland restoration program to conserve insect pollinator populations. However, CRP enrollments have been declining in recent years, which could result in insect population declines, and negatively impact agricultural services (Otto et al 2018, Smith et al 2021). Solar-pollinator habitat can offset CRP losses to support insect populations and safeguard their agricultural services. For example, it was estimated that over 3500 km2 of agricultural land could benefit from pollination services supported by solar-pollinator habitat across 2244 operating solar facilities in the U.S. in 2016 (Walston et al 2018). The potential agricultural service benefits of solar-pollinator habitat are likely much larger today, as the amount of utility-scale solar energy generation in the U.S. has more than doubled in the past 5 years ([EIA] Energy Information Administration 2023).
Second, like other forms of agrivoltaics, solar-pollinator habitat could help mitigate land use conflicts associated with the conversion of farmland for solar energy production. The United States has lost over 12 million acres of agricultural land since 2015 (USDA 2023b), increasing the pressure on the remaining agricultural lands for food production. Solar energy development may contribute to further declines in farmland, as approximately 80% of future ground-mounted solar energy development could occur on agricultural lands (Sorensen et al 2022). Rather than exacerbate the effects of these land use tradeoffs, these effects can be alleviated through the proper siting of solar energy developments and pairing with solar-pollinator habitat or other agrivoltaic dual land uses. For example, siting future solar energy sites on marginal farmland and pairing these developments with solar-pollinator habitat could preserve prime farmland, improve the productivity of those remaining lands through pollination and pest control services supported by solar-pollinator habitat, and increase the site's ecosystem services potential (Walston et al 2021). In addition, other forms of agrivoltaics such as co-locating solar energy development with crop production or livestock grazing, can ensure that onsite agricultural practices continue which can help balance the nation's needs for food and energy production (Walston et al 2022).
As a relatively new land management practice, there are several information gaps and considerations associated with solar-pollinator habitat that need to be addressed; many of these are summarized in Macknick et al (2022). Vegetation considerations include the feasibility of establishing solar-pollinator habitat in different geographic regions, the availability of seed mixes required to result in increased pollinator abundance and diversity, and vegetation management considerations to control weed establishment. Research on the ecological effectiveness of various seed mixes, mowing frequencies, and grazing strategies is ongoing in the U.S. (e.g. U.S. Department of Energy InSPIRE Study, https://openei.org/wiki/InSPIRE; U.S. Department of Energy PHASE Study, https://rightofway.erc.uic.edu/phase). Although we observed relatively rapid establishment of solar-pollinator habitat and associated responses of the native insect community in Minnesota, solar-pollinator habitat establishment might be slower in arid regions that are less productive and receive little precipitation (Grodsky et al 2021, Walston et al 2022). Another consideration is the influence of solar energy technological factors on solar-pollinator habitat establishment and management. Most notably, technological designs related to panel height and spacing limit what plant species can be grown at the site so as not to shade the panels and impede energy production. Although the solar panels in our study had a leading edge of approximately 0.9 m at the lowest point, other solar facilities may have panels with lower leading edges, limiting what seed mixes can be planted at those sites. Vegetation management may also be unique at solar energy facilities where smaller specialized mowing equipment may be required due to the spacing of the solar panels. In addition, shading and microclimates created by solar panels may influence the establishment of certain plant species and their blooming phenologies (e.g., Tanner et al 2020, Graham et al 2021). The interactions of these technology-related factors and the ecological performance of solar-pollinator habitat are poorly understood. As a result, future research should focus on methods to optimize habitat establishment within these unique environments to improve the ecological compatibility of solar energy developments.
5. Conclusions
The establishment of solar-pollinator habitat can be a low impact approach to improve the ecological compatibility of utility-scale solar energy. However, the ecological effectiveness of this practice depends on a variety of factors including solar facility design, geographic region, and the role of solar-pollinator habitat in the ecological mitigation hierarchy (Arlidge et al 2018). Solar-pollinator habitat is unlikely to completely offset the residual ecological impacts of solar developments poorly sited in areas with high ecological value. In this context, solar-pollinator habitat may have the greatest potential for ecological benefit for solar energy facilities sited in areas that have been previously ecologically compromised, such as marginal farmland, former industrial or mine lands, and other disturbed sites. In these situations, solar-pollinator habitat may be able to provide net biodiversity benefits. Given the design and operations of utility-scale PV facilities, solar-pollinator habitat could become a novel ecosystem made up of unique plant and animal assemblages based on the compatibility of seed mixes to be planted and unique site-level vegetation management practices. Additional research is needed to understand the feasibility of solar-pollinator habitat across different regions and to meet different ecological goals (e.g. to conserve target insect or wildlife species) that will optimize the ecological compatibility of these novel renewable energy land uses.
Acknowledgments
Funding was provided by the U.S. Department of Energy (DOE) Solar Energy Technologies Office under Award Number 38642. This article was developed by Argonne National Laboratory, operated for the DOE under Contract No. DE-AC02-06CH11357. Additional support was provided by NREL, operated for DOE under Contract No. DE-AC36-08GO28308. The views expressed in the article do not necessarily represent the views of the DOE or the US Government. The U.S. Government retains for itself, and others acting on its behalf, a paid-up nonexclusive, irrevocable worldwide license in said article to reproduce, prepare derivative works, distribute copies to the public, and perform publicly and display publicly, by or on behalf of the Government. We appreciate the constructive comments from Juan Botero and two anonymous reviewers on previous drafts of this article. We are grateful to Katherine Szoldatits, Irene Hogstrom, William Vinikour, Yudi Li, and Meredith Walston for field assistance, data analyses, and/or logistical support. We appreciate Enel Green Power North America and several landowners (C Block, P Bowe, S Bergo, R Bohnert) that permitted site access for this study. Finally, we are thankful to Aaron Hanson and the University of Minnesota's Sustainability Corps Program through the support of the following undergraduate field research interns: Natalie Narvaez, Adam Brodsky, and Gretchen North.
Data availability statement
The data that support the findings of this study are available upon reasonable request from the authors.
Conflict of interest
The authors declare no conflicts of interest.
Author contributions
L W, H H, J M, and J M designed the research. L W, H H, L F, and J J conducted the field work. L W and L J conducted data analyses. All authors participated in writing the paper.
Ethics statement
The article does not contain any studies involving human participants. There was no handling of insects or other organisms in this study.
Supplementary data (1.6 MB PDF)