

Abstract
The Northeast Pacific Ocean (NEP) is one of the hotspots of marine heatwaves (MHWs) occurring in the global ocean. The causes of MHWs in this region have been widely investigated, but the physical processes underlying heatwaves and regional climate variability remain under debate. By analyzing interannual large-scale high-latitude atmospheric dynamics and oceanic physical conditions over the NEP, we show that winter-spring sea surface temperature (SST) anomalies are strongly correlated with winter-spring atmospheric blocking events over Alaska. The occurrence of weaker westerly wind over the subarctic region over the NEP during the period of the blocking, accompanies a shallower vertical mixed layer, less southward horizontal Ekman transport, and higher SST in the upper NEP. These findings establish a linkage between high-latitude atmospheric dynamics and subarctic oceanic conditions and reveal the physical mechanisms of this connection, providing new insight into the possible causes of MHW in the NEP.
Export citation and abstract BibTeX RIS

Original content from this work may be used under the terms of the Creative Commons Attribution 4.0 license. Any further distribution of this work must maintain attribution to the author(s) and the title of the work, journal citation and DOI.
1. Introduction
Marine heatwaves (MHWs) are discrete events in which extremely high sea surface temperature (SST) occur in specific regions and persist for several days or months (Hobday et al 2016). MHWs occur worldwide and profoundly affect the global marine ecosystem (Frölicher and Laufkötter 2018). As the most dynamic region of the world's oceans, the Northeast Pacific Ocean (NEP) experiences the most frequent MHW, and the warming trend is approximately two to three times the global average (Laufkötter et al 2020). Recently, a multiple-year persisting MHW—also called 'the Blob'—occurred in the NEP (Bond et al 2015, Di Lorenzo and Mantua 2016, Zaba and Rudnick 2016, Amaya et al 2020, Laufkötter et al 2020). The Blob region developed in the fall of 2013 with a large warm SST anomaly in the upper ocean along the axis of the North Pacific Current, spread extensively from the Gulf of Alaska to the California coast during the following months, and persisted until the winter of 2015 (Di Lorenzo and Mantua 2016, Gentemann et al 2017). The MHW significantly impacted local oceanic ecosystems by changing the ocean ecosystem structure (Wernberg et al 2013), reducing marine productivity and species diversity Smale et al 2019, Gurgel et al 2020 causing toxic algal blooms (Cavole et al 2016), and causing the death of important fish (Caputi et al 2016, Santora et al 2020). In the summer of 2019, an MHW reappeared in the NEP and caused devastating marine impacts (Amaya et al 2020).
The evolution and shape of the MHW in the NEP are driven by multiple processes related to weakened local wind speed, including less ocean-atmosphere heat exchange, shallower winter mixed layer depth (MLD), and less southward Ekman transport (ET) from subarctic ocean gyres (Bond et al 2015, Amaya et al 2020). Other factors, such as subsurface buoyancy, increased shortwave radiation, and positive SST‒cloud feedback, were also determined to play important roles in maintaining the multiyear persistence of MHWs (Amaya et al 2020, Scannell et al 2020). Although the oceanic physical processes driving MHWs have been widely investigated and well understood, the climatic phenomena causing MHWs are still under debate. Climatic modes such as the North Pacific Gyre Oscillation, Pacific decadal oscillation (PDO), and El Niño events encompass a wide range of global air-sea coupling phenomena beyond solely representing oceanic anomalies or atmospheric responses (Nakamura et al 2006, Di Lorenzo et al 2008, Hu and Fedorov 2019), all have potentially important roles in developing the MHW in the NEP (Di Lorenzo and Mantua 2016, Joh and Di Lorenzo 2017, Frölicher et al 2018, Amaya et al 2020). However, several studies have shown that El Niño events or the North Pacific Oscillation may have a limited effect on the SST anomaly in the NEP (Johnstone and Mantua 2014, Jacox et al 2016, Zaba and Rudnick 2016).
Atmospheric blocking considerably affects weather and climate mode (Cattiaux et al 2010, Davini et al 2012a, Damião Mendes and Cavalcanti 2014, Woollings et al 2016, McLeod et al 2017, Yao et al 2022, 2023). It is a phenomenon characterized by a quasistationary, large-scale anticyclone observed in the upper-level geopotential height fields at middle to high latitudes that can persist for several days or longer (Barriopedro et al 2006, Berrisford et al 2007). When atmospheric blocking is situated off dominant storm tracks or the jet stream, it diverts or blocks the westerly flow and significantly influences the subarctic oceanic properties (Bane et al 2007, Häkkinen et al 2011). For example, in the North Atlantic sector, Greenland blocking significantly weakens the westerly wind by diverting the jet stream (Woollings 2011), which results in a shallower MLD and weaker ocean-atmospheric heat flux and causes a warmer and more saline subarctic ocean (Häkkinen et al 2011). Alaska blocking events over the North Pacific sector also showed a remarkable impact on the westerly wind over the NEP (McLeod et al 2017), which resulted in a substantial reduction in southward horizontal advection water from the subarctic ocean gyre and caused a reduction in phytoplankton biomass in the midlatitude North Pacific Ocean (Le et al 2019). As the MHW is primarily driven by wind-related physical processes in the upper ocean, atmospheric blocking over Alaska might be a potential climatic force that triggers the unprecedented warm sea surface in the NEP. Some studies (Holbrook et al 2020, Kodaira et al 2020, Chapman et al 2022) have explored the relationship between high-latitude atmospheric blocking and the occurrence of MHWs, while they have not discussed this connection in great detail.
Here, by using a long-term time series of satellite observations combined with a reanalysis climate dataset, we investigate the connection between the NEP MHW and Alaska atmospheric blocking and disclose the dynamic process linked to the connection by regression analysis. Given that high-latitude blocking had high frequency during winter and spring in the Northern Hemisphere (Barriopedro et al 2006, Davini et al 2012a) and that many extreme Alaska blocking events occurred after 2000 (McLeod et al 2017), we focus only on the winter-spring variability in Alaska blocking events and SST anomalies in the NEP for the period from 2000 to 2020. First, the coincidence of atmospheric circulation anomalies and the most pronounced MHW in winter-spring 2014, and 2015 were presented as a case study. Then, the linkage between Alaska blocking events and MHWs was established using regression analysis. Finally, the mechanism underlying the linkage was revealed by analyzing the ocean-atmosphere interaction process. Our results have established a potential connection between the NEP SST anomaly and Alaska blocking events. These results indicate the possibility of MHWs in the subarctic NEP being triggered by the strong large-scale atmospheric circulation anomaly over Alaska.
2. Dataset and methods
The daily SST data were downloaded from the National Oceanic and Atmospheric Administration Physical Sciences Laboratory (NOAA/PSL; https://psl.noaa.gov/data/gridded/data.noaa.oisst.v2.html). The daily SST anomaly in the Blob region (40°‒50° N, 135°‒155° W, black boxes in figures 1(b) and (e)) was calculated according to equation (1).
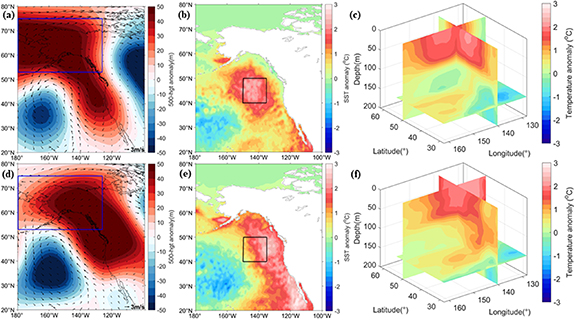
Figure 1. The winter-spring 500 hgt anomaly (shading) and 10 m vector wind anomaly (black arrow) over Alaska in 2014 (a), and 2015 (d), respectively. The arrow of unit length in the lower right corner represents a wind speed of 3 m s−1. The blue boxes in (a) and (d) represent Alaska atmospheric blocking region. The winter-spring SST anomaly (shading) in the Northeast Pacific Ocean in 2014 (b), and 2015 (e), respectively. The black boxes in (b) and (e) represent the 'Blob' region. The winter-spring temperature anomaly in the upper ocean (<200 m) in the Northeast Pacific Ocean in 2014 (c), and 2015 (f), respectively.
Download figure:
Standard image High-resolution imagewhere Ta(j) is the daily SST anomaly for day j, Td(i) is the daily SST, Tc(i) is the climatological daily mean SST, and N is the size of the Blob region. Winter‒spring (December–May) SST anomalies were the average of daily SST anomalies in the Blob region and were used to analyze their Spearman correlations with different oceanic physical variables. For other variables, winter-spring anomalies were calculated using the same method except for MLD anomalies which were calculated from monthly data because of a lack of daily products. The marine heatwave event in the Blob region was calculated according to the definition of the (Hobday et al 2016), where the daily pixel-by-pixel SST of the Blob region must satisfy two conditions—greater than 90% SST of the same place, persisting more than 5 d. The gap days between two marine heatwave events less than 3 d would be considered a single marine heatwave event (Hobday et al 2016). The total days of MHWs is the sum of the durations of winter-spring marine heatwave events.
Global daily 500 hPa geopotential height estimates (500 hgt in m), and surface (10 m) zonal (U) wind were obtained from the United States National Center for Environmental Prediction/National Center for Atmospheric Research website (NCEP/NCAR, Reanalysis 1 Dataset, www.esrl.noaa.gov/psd/data/gridded/data.ncep.reanalysiis.html).
The Alaska Blocking Index (ABI) (McLeod et al 2017) and blocking days were used to evaluate the large-scale atmospheric circulation variability over high-latitude regions. ABI anomaly is defined as the daily anomaly of 500 hgt centered over the Alaska region (54°‒76° N and 125°‒180° W) (blue boxes in figures 1(a) and (d)). The atmospheric blocking days were calculated according to Davini et al (2012a, 2012b). The 6 hour north-south component of ET (in kg m−1 s−1) was downloaded from the Environmental Resources Division of the Southwest Fisheries Science Center (ERD) (https://oceanview.pfeg.noaa.gov/products) and daily averaged to assess the effect of the southward transport of subarctic water on the SST anomaly. Finally, regional mean ET in the middle latitudes of the North Pacific (50°–55° N, 135°−150° W) was extracted to further evaluate factors associated with SST variability in the Blob region.
Monthly mean MLD data were downloaded from the Oregon State University Ocean Productivity website at www.science.oregonstate.edu/ocean.productivity (Behrenfeld et al 2016). This dataset includes MLD values from the HYbrid Coordinate Ocean Model (HYCOM), a multi-institutional effort sponsored by the National Ocean Partnership Program, as part of the U.S. Global Ocean Data Assimilation Experiment. The global model GLBu0.08 hindcast results were used in this study. MLD is defined as the depth where the density is 0.125 kg m−3 greater than the surface value. Profile SST data from Argo floats (ID nos. 4901 243 and 74 208 394) in the NEP were also used to evaluate the vertical structure of the ocean condition. These publicly accessible data were collected by the International Argo Program and the national programs that contribute to it (www.argo.ucsd.edu), which is part of the Global Ocean Observing System for the current century. The Argo network provides observations with near-global ocean coverage, significantly improving the availability of ocean observations.
To assess the effects of low-frequency oceanic modes on SST anomaly, monthly climate indices including PDO, Pacific-North American (PNA) pattern, Multivariate El Niño-Southern Oscillation (ENSO) Index (MEI), and North Pacific Index (NPI) were downloaded from different websites. PNA is the description of the rotated principal component analysis technique used to identify teleconnection patterns, obtained from the NOAA Climate Prediction Center (www.cpc.ncep.noaa.gov/data/teledoc/telecontents.shtml). PDO is the leading PC of monthly SST anomalies in the North Pacific Ocean, which was downloaded from the website (http://jisao.washington.edu/pdo/PDO.latest). MEI was derived from the Physical Sciences Laboratory (https://psl.noaa.gov/enso/mei/). NPI is the area-weighted sea level pressure over the region of 30° N–65° N, 160° E–140° W (www.cgd.ucar.edu/cas/jhurrell/npindex.html).
3. Results
Figure 1 shows the variability in large-scale atmospheric circulation and upper ocean conditions during the three MHW events in the winter-spring periods of 2014, and 2015. The anomalous upper ocean conditions seemingly coincided with large-scale atmospheric circulation variations. In the winter-spring periods of 2014, and 2015, distinct positive 500 hgt anomalies occurred over Alaska (figures 1(a) and (d)), revealing Alaska blocking events in the two years. Coincidentally, the ocean has a warm SST in the NEP subarctic gyre, with a positive SST anomaly, reaching 3 °C in the winter-spring periods of 2014 and 2015 (figures 1(b) and (e)). The vertical structure of the ocean condition showed the strong stratification of the ocean in the NEP during the three blocking events. The upper ocean (<100 m depth) has a positive SST anomaly in the winter-spring periods in the two years (figures 1(c) and (f)). These strong stratification conditions were further revealed by the Argo Float in the Northeast Pacific (figure S1). The remarkable coincidence suggested a potential linkage between the high-latitude large-scale atmospheric circulation dynamics and the MHWs in the NEP.
Before investigating the connection between Alaska atmospheric blocking and the MHWs in the NEP, we first determine the physical process causing MHWs via regression analysis. The results showed the primary association of the MHW in the NEP with anomalies of MLD and southward ET from high-latitude regions. The regional SST anomaly in the Blob region has strong negative relationships with MLD and ET anomalies (figures 2(a) and (b)), with r values of −0.74 (p < 0.05) and −0.78 (p < 0.05), respectively. Further regression analysis showed that variability in the zonal wind is the main factor regulating MLD in the NEP. The U wind anomaly had a strong and positive relationship with MLD in the Blob region (figure 2(c)), with an r of 0.76 (p < 0.05). These relationships indicate that weaker zonal wind could accompany shallower MLDs, lower ET from high-latitude oceans, and warmer sea surfaces. This finding is further supported by the negative significant relationship between the U wind anomaly and SST anomaly over the Blob region, with an r of −0.56 (p < 0.05) (figure 2(d)).

Figure 2. (a), (b) The correlations between SST anomaly with MLD anomaly, and ETy anomaly in the Northeast Pacific Ocean, respectively. (c), (d) The correlations between zonal wind anomaly with MLD anomaly, and SST anomaly, respectively. The black solid lines in (a)–(d) are the fitted trend lines.
Download figure:
Standard image High-resolution imageAs the surface wind is the key meteorological factor causing MHWs, we assess the effect of Alaska atmospheric blocking on the sea surface wind over the NEP to establish the potential linkage between high-latitude atmospheric circulation and MHWs. The results showed that surface wind over the NEP is profoundly affected by high-latitude large-scale atmospheric circulation. During blocking events in 2014, and 2015, eastward surface wind anomalies were present over the NEP (figures 1(a) and (d)) although meridional wind seemed stronger in 2014 and 2015. The correlation (figure S2) between meridional wind and SST anomaly was 0.19 (p > 0.05). These findings indicate the significant weakening of westerly wind over the NEP by Alaska blocking events, which supports the findings in the study (Le et al 2019). Regression analysis of long-term time series also demonstrated that weakened surface wind over the NEP is associated with high-latitude atmospheric circulation. The winter-spring surface zonal wind over the Blob region also showed a strong negative correlation with ABI (figures 3(a) and (b)), with an r of −0.62 (p < 0.05). Similarly, the winter-spring MLD had a significantly negative correlation with ABI over the NEP subarctic gyre (figure S3), with a correlation coefficient, r, up to −0.6. In addition, a strong correlation between the ABI anomaly over Alaska and the SST anomaly in the Blob region (figures 3(c) and (d)) was obtained, with an r of 0.67 (p < 0.05).

Figure 3. The spatial (a) and temporal (b) correlation between winter-spring Alaska Blocking Index (ABI) anomaly and zonal wind anomaly from 2000 to 2020. The spatial (c) and temporal (d) correlation between winter-spring ABI anomaly and SST anomaly from 2000 to 2020.
Download figure:
Standard image High-resolution imageThe strong relationship between SST anomalies and oceanic physical conditions (figures 2(a) and (b)), together with the knowledge of the physical forcing behind these oceanic processes (figures 2(c) and (d)) and with the relationship between atmospheric blocking and surface wind (figures 3(a) and (b)), built a potential connection between high-latitude large-scale atmospheric circulation dynamics and the MHW in the NEP. The connection beginning with Alaska blocking events weakens the zonal wind over the NEP by blocking the westerly wind. The weakened zonal wind is linked to shallower vertical mixing in the NEP and weaker southward ET from the subarctic north Pacific Ocean gyre, which in turn leads to a warmer sea surface. This connection is further supported by direct regression analysis between the Alaska blocking events and SST anomalies in the NEP. ABI had a significantly positive correlation with the SST anomaly in the NEP (figure 3(c)) and had a positive and strong relationship with the regional SST anomaly in the Blob region (figure 3(d)).
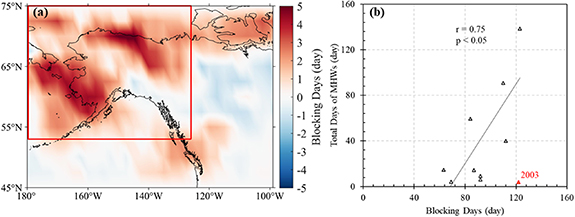
To assess the effect of other climatic modes on SST, correlation analysis was conducted between regional mean SST in the Blob region and different climatic modes indices including the PDO, PNA, MEI, and NPI (figure S4). Results showed that only MEI and PDO had a significant but weak correlation with SST anomaly with r values of 0.57 (p < 0.05) and 0.55 (p < 0.05), respectively. No significant correlation was found between SST anomaly and PNA and NPI. By contrast, the ABI anomaly had the best correlation with the SST anomaly with an r of 0.67 (p< 0.05), which suggests that atmospheric circulation anomaly over Alaska predominates the SST anomaly in the Blob region instead of the other four climatic modes. This was further supported by the relation between the total days of MHWs and blocking days over Alaska (figure 4). The year with MHWs had higher mean blocking days than that in years without MHWs (figure 4(a)). The total days of MHWs in the Blob region also had a significant correlation with blocking days over Alaska (r = 0.75, p < 0.05) (figure 4(b)). Overall, these results suggest a potential linkage between Alaska atmospheric blocking and MHWs in the NEP.
Figure 4. (a) The difference in the blocking days between years with MHWs and years without MHWs. Years with MHWs refer to 2002, 2003, 2005, 2009, 2013, 2014, 2015, 2016, 2019, and 2020. Years without MHWs refer to 2000, 2001, 2004, 2006, 2007, 2008, 2010, 2011, 2012, 2017, and 2018 (see figure S5 for details). (b) The correlation between blocking days and total days of MHWs in the years with MHWs. The outlier in 2003 (highlighted in red) is excluded from the regression. The black solid line in (b) is the fitted trend line.
Download figure:
Standard image High-resolution image
4. Discussion
The causes of MHWs in the NEP have been widely discussed in recent years (Bond et al 2015, Zaba and Rudnick 2016, Gentemann et al 2017, Joh and Di Lorenzo 2017, Amaya et al 2020, Scannell et al 2020). In this study, we showed the potential link between atmospheric circulation anomalies over Alaska and MHWs in the NEP. This finding is novel but unsurprising, as our result is consistent with those of many previous studies. For example, the PDO has been confirmed as the cause of prolonged multiyear MHWs in the NEP by using reanalysis datasets and climate model ensemble examinations (Di Lorenzo and Mantua 2016, Joh and Di Lorenzo 2017). This index is essentially defined by the dominant EOF modes of winter SST variability in the North Pacific Ocean, which is fundamentally affected by sea surface wind and atmospheric circulation. Other studies have suggested that local anomalous atmospheric forcing causes unusual oceanic conditions (Bond et al 2015, Zaba and Rudnick 2016, Amaya et al 2020), which is further confirmed by our results. A broad region extending from the North Pacific across North America is known to be subject to the effects of teleconnections from the tropical Pacific in association with ENSO events (Lau and Nath 1996, Alexander et al 2002). However, such an explanation fails to account for the linkage between ENSO and the NEP warming in detail, and the underlying physical process. Distinct from these previous studies, we further identified the high-latitude atmospheric circulation anomalies over Alaska blocking events as the driving factor for the wind and SST over the NEP region.
Similar to the North Atlantic, where more frequent blocking between Greenland and western Europe causes warmer and more saline subpolar oceans (Häkkinen et al 2011), however, the physical process is different. In the North Atlantic, the Greenland blocking diverts the jet stream over the North Atlantic, which maintains the ocean's subpolar and subtropical gyre circulations, changing the wind-forced subpolar gyre and opening up a pathway for warm saline water from the subtropics to move to higher latitudes (Häkkinen et al 2011, Woollings 2011). In this study, our results showed that Alaska atmospheric blocking reduced the zonal wind by enforcing a southward shift in the westerly wind (Le et al 2019), inducing shallower vertical mixing and less southward horizontal ET, with less cool water supply from the deep ocean and subarctic region, and resulting in warmer SST. This scenario highlights the importance of investigating the mechanisms for the response of the ocean to atmospheric dynamics at regional scales.
However, there is a noticeable decoupling between the occurrence of atmospheric blocking and MHW events in the analysis regions during several years between 2000 and 2020. (figures 4(b) and S5). The decoupling is primarily caused by the fixed regional and time scale used in this study. For example, in the years 2003, 2009, 2011, and 2018, MHWs primarily occurred in coastal regions or subtropical regions (figure S6), however, only the MHWs in the Blob region were used in this study to assess the correlation between atmospheric blocking and MHWs in the NEP, and resulting the deviation between the blocking events and MHWs. The opposite atmospheric circulation anomalies in winter and spring such as 2010 and 2020 could also cause the discrepancy. In 2010, a positive ABI anomaly occurred in winter, but a negative ABI anomaly occurred in spring (figure S7), which offset the effect of atmospheric blocking in winter. In 2020, an extremely negative ABI occurred in winter, but a highly positive ABI appeared in spring (figure S8) which could cause MHWs in NEPs. Nevertheless, this study presented a potential linkage between high-latitude atmospheric circulation anomalies and MHWs in the NEP.
In addition to disclosing the mechanism between the subarctic MHW and high-latitude atmospheric dynamics, the findings in this study have broad applications in forecasting MHW events over the NEP under future climate change. For example, the ABI is an important climate indicator representing regional environmental and climate conditions over the Arctic, and the linkage established in this study can be used to forecast NEP MHWs under rapid Arctic climate change, such as Arctic amplification, which is the phenomenon in which the Arctic has warmed more than twice as fast as the global average (Screen and Simmonds 2010). Although the association between ABI and Arctic amplification is arguable (Barnes 2013, Screen and Simmonds 2013), the results from reanalysis datasets and model simulations both showed a correlation between regional warming over the East Siberian‒Chukchi Sea and large-scale atmospheric circulation anomalies over Alaska (Kug et al 2015).
In summary, we discovered a teleconnection between high-latitude large-scale atmospheric circulation dynamics and subarctic MHWs in the NEP. Furthermore, we revealed how the physical and dynamic processes of large-scale atmospheric dynamics are linked to upper oceanic conditions over the NEP. Our results highlight the importance of understanding regional large-scale atmospheric circulation patterns in regulating ocean conditions. We acknowledge that our findings are based on observed and reanalysis datasets, and the linkage is established using regression analysis; thus, the mechanism disclosed in this study does not necessarily represent the intrinsic physical process between the high-latitude large-scale atmospheric circulation and MHW over the NEP. Further research using numerical models with sophisticated physical mechanisms is needed to confirm the teleconnection between high-latitude climatic variability and MHWs in the midlatitude ocean. Moreover, the ABI anomaly and blocking days are solely the winter-spring average, they do not disclose the synoptic-scale process in depth. Future studies conducting the day-by-day analysis (Li et al 2020) of blocking's effects on SST are necessary.
Acknowledgments
Financial support for this work was provided by the National Natural Science Foundation of China (Grant Nos. 42325602 and 41976164), the National Key Research and Development Program of China (Grant No. 2022YFC2807601), and by Natural Science Foundation of Zhejiang Province for Distinguished Young Scholars (LR20D060002). We thank the reviewers for providing substantial comments and suggestions to improve the manuscript. We also thank the National Oceanic and Atmospheric Administration Physical Sciences Laboratory for providing the SST data, the United States National Center for Environmental Prediction/National Center for Atmospheric Research website for providing the reanalysis dataset, the HYCOM for providing MLD datasets, the ERD of the Southwest Fisheries Science Center for providing ET data, and the International Argo Program to provide the profile data. All datasets used in this study are publicly available through the identified websites.
Data availability statement
Data used in this study are openly available for download from the following URL/DOIs: https://psl.noaa.gov/data/gridded/data.noaa.oisst.v2.html (SST), https://psl.noaa.gov/data/gridded/data.ncep.reanalysis.html(500 hgt; wind), https://oceanview.pfeg.noaa.gov/products/fnmoc/prods (ETy), www.science.oregonstate.edu/ocean.productivity (MLD), www.argo.ucsd.edu (Argo), www.cpc.ncep.noaa.gov/data/teledoc/telecontents.shtml (PNA), http://jisao.washington.edu/pdo/PDO.latest (PDO), https://psl.noaa.gov/enso/mei/ (MEI), www.cgd.ucar.edu/cas/jhurrell/npindex.html (NPI).
All data that support the findings of this study are included within the article (and any supplementary files).
Conflict of interest
The authors have no conflicts of interest to declare.
Supplementary data (1.6 MB PDF)