

Abstract
The Inflation Reduction Act (IRA) is regarded as the most prominent piece of federal climate legislation in the U.S. thus far. This paper investigates potential impacts of IRA on the power sector, which is the focus of many core IRA provisions. We summarize a multi-model comparison of IRA to identify robust findings and variation in power sector investments, emissions, and costs across 11 models of the U.S. energy system and electricity sector. Our results project that IRA incentives accelerate the deployment of low-emitting capacity, increasing average annual additions by up to 3.2 times current levels through 2035. CO2 emissions reductions from electricity generation across models range from 47%–83% below 2005 in 2030 (68% average) and 66%–87% in 2035 (78% average). Our higher clean electricity deployment and lower emissions under IRA, compared with earlier U.S. modeling, change the baseline for future policymaking and analysis. IRA helps to bring projected U.S. power sector and economy-wide emissions closer to near-term climate targets; however, no models indicate that these targets will be met with IRA alone, which suggests that additional policies, incentives, and private sector actions are needed.
Export citation and abstract BibTeX RIS

Original content from this work may be used under the terms of the Creative Commons Attribution 4.0 license. Any further distribution of this work must maintain attribution to the author(s) and the title of the work, journal citation and DOI.
1. Introduction
The Inflation Reduction Act of 2022 (IRA) is regarded as the most prominent piece of federal legislation to address climate change in the U.S. to date. The law affects nearly every segment of the energy sector from raw materials suppliers to end-use consumers; however, the greatest emissions reductions are expected to come from an historic transformation of the power sector [1]. IRA uses tax credits, grants, loan programs, and emissions fees to incentivize clean energy deployment, innovation, and domestic manufacturing. IRA has the potential to mitigate emissions, lower energy costs, improve human health, address energy system inequities, and drive innovation.
However, IRA's complexity and breadth mean that its effects on energy systems and associated emissions reductions are uncertain. IRA was advertised to achieve a 40% reduction in greenhouse gas (GHG) emissions economy-wide (from 2005 levels) by investing over $390 billion for climate over a 10 year period, including about $160 billion in power sector tax credits [2]. But the realized emissions, government outlays, and pace of investment are uncertain and depend on complex interactions. The power sector is at the center of IRA, since electricity is the focus of many core IRA provisions and is expected to contribute the largest share of its emissions reductions. As discussed in section 2.1, IRA modifies, expands, and extends power sector investment and production tax credits (PTCs) for at least a decade with bonuses that encourage a just transition and high-road labor standards [3]. On the demand side, IRA incentivizes electrification of transport, buildings, and industry, which increases electricity demand and alters load shapes.
Given this uncertainty, modeling plays a key role in understanding potential power sector implications of IRA. We present the first multi-model analysis of IRA's effects on the electricity sector, based on projections from 11 state-of-the-art models—six of the U.S. energy system and five focusing on the power sector (SI S1). Some of these models contributed analysis for Build Back Better negotiations, which informed policy choices for IRA and provided initial estimates of IRA's impacts [4–7]. Our work expands this initial analysis through more nuanced representations of IRA provisions and by increasing the variety of participating models, which allows for the identification of robust findings and uncertainties about power sector impacts. Unlike comparisons of economy-wide impacts of IRA [8, 9], we provide the first multi-model analysis of power sector implications of IRA's climate provisions. We also build on initial analysis by running additional sensitivities to investigate how alternate assumptions about IRA implementation may shape power system outcomes and compare results across a range of decision-relevant metrics for policymakers, industry, investors, and other stakeholders.
The broader context is that countries are attempting to bridge the gap between pledged ambition and action under the Paris Agreement to hold warming well below 2 °C. IRA is intended to contribute to the U.S. pledge to reduce economy-wide GHG emissions by 50%–52% by 2030 relative to 2005 [10]. Electricity—currently the second largest emitting sector in the world's second largest emitting country [11]—is expected to play a leading role in achieving this target [12], both due to its relatively low abatement costs and due to the prominence of end-use electrification in decarbonization studies [13, 14]. IRA has international relevance as countries track progress toward global emissions goals, as international companies assess impacts of IRA's incentives for domestic production of energy technologies and critical minerals, as policymakers learn from U.S. climate policy implementation, and as technological change leads to global spillovers if deployment lowers costs. In addition, this analysis can provide a model for quick turnaround model comparison efforts for policies and incentives in other jurisdictions.
2. Method
2.1. Overview of IRA incentives
Although IRA contains a range of provisions for the power sector (table S3), there are several key incentives that are expected to account for a large share of emissions reductions. The PTC and investment tax credit (ITC) are the most significant provisions. IRA expands tax credit eligibility to give new wind, solar, and several other generating technologies the flexibility to take the PTC or ITC, depending on which is more lucrative for a given project, and offers the ITC to standalone energy storage for the first time. Historically, solar projects could only take the ITC, and the frequent expiration or last-minute extension of both credits over time (figure S2) contributed to boom-and-bust cycles of investment. Under IRA, the PTC and ITC become technology-neutral by 2025, and all zero-emitting resources can receive these tax credits at full value for projects that commence construction before the end of the year after power sector CO2 emissions reach 25% of their 2022 levels or 2032, whichever is later. The credits then begin to phase out over three years. Eligible projects receiving the PTC are awarded per megawatt-hour of electricity output over the first ten years of production, while the ITC is awarded as a fraction of investment costs. In addition to the PTC and ITC for new low-emitting capacity, IRA offers a production credit for existing nuclear power, recognizing potential retirement risks for these power plants, which offers up to $15/MWh (depending on electricity revenues and support from other programs) and ends after 2032.
IRA's PTC and ITC contain bonus credits that can increase credit levels for eligible projects (figure S2). Labor standards—which add requirements on prevailing wages and apprenticeships—are required for full eligibility of the credits (about $27.5/MWh in 2022 dollars for the PTC and 30% for the ITC). Most models assume these standards are met by all projects, as failing to do so reduces the value of the credits by 80%, making these projects less competitive with ones that are compliant with labor standards. There are also bonuses that can provide a 10% increase for the PTC and 10 percentage point increase for the ITC for projects that are sited in specified 'energy communities' (e.g. communities with recent coal closures or fossil fuel employment) and/or use a minimum share of domestic content—with projects eligible to claim both bonuses. There are additional bonus credits for certain small-scale projects sited in low-income communities or on Native American land, though these bonuses have annual caps on their use. IRA also allows for direct pay for nonprofits and tax-exempt entities (enabling tax credits to be directly delivered in cash) and transferability (allowing tax credits to be transferred to other taxpaying entities in exchange for cash payment).
There are also several multi-sector credits that may impact the power sector. IRA offers an extension and enhancement of credits for captured CO2 (45Q), which offer up to $85/t-CO2 for captured and stored CO2 for electricity, industry, and fuels and $60/t-CO2 for utilization. Clean hydrogen production also receives a new PTC (45V) based on the lifecycle GHG emissions intensity of production with a 10 year eligibility for projects, which may be up to $3 per kilogram of hydrogen.
More detailed descriptions of IRA incentives are available in [3, 9, 15].
2.2. Energy system and power sector models
To examine the effects of IRA on the power sector, this analysis uses 11 models that vary in structure, inputs, and IRA representation (see SI S1 for more detail on participating models). Participating models can be divided into two categories—six energy-economy models that represent sectoral feedbacks (e.g. impacts of transportation choices on electricity consumption) and five power sector models that can bring greater spatial, temporal, and technological detail (see SI S1). The representation of the power sector in most models includes decisions about least-cost investments, retirements, and dispatch in generation, energy storage, and transmission resources. Electricity demand is endogenous in the six energy-economy models (table S1), while service demand (e.g. vehicle miles traveled) and non-energy prices are exogenous for most models in the study as are macroeconomic variables such as inflation, interest rates, and gross domestic product. Other papers in the literature examine IRA's impacts on macroeconomic [9] and distributional [16, 17] outcomes using alternate modeling approaches.
Two of the largest differences across models are choices about temporal and spatial resolution (SI S1), which can shape investment decisions, especially under deeper decarbonization [18]. Figure S1 compares temporal and spatial resolutions across participating models and illustrates how models with more time segments generally have fewer geographical regions (and vice versa), reflecting computational tradeoffs between these two dimensions. IRA's tax credits accelerate deployment of low-emitting technologies by lowering their costs, and although generation costs of wind and solar are lower than alternatives in some markets already (hence leading to some deployment even before IRA incentives), the market value of variable resources declines as deployment increases [19, 20], which can mean that other resources are deployed as part of a cost-minimizing system mix and that additional cost reductions for low-emitting options will increase deployment 19 . Models' abilities to capture value deflation depends in part on decisions about temporal and spatial resolution [21]. As described in [8], most participating models do not incorporate expansion constraints on the rate of wind and solar additions, though deployment constraints on transmission, nuclear, and carbon capture are more common.
2.3. Scenario design and IRA implementation
Results of IRA scenarios are compared with counterfactual reference scenarios without IRA to assess potential impacts. The policies in the reference scenarios include but are not limited to national policies such as the Infrastructure Investment and Jobs Act (IIJA) as well as subnational renewable and clean electricity portfolio standards, carbon markets, incentives, and other state and regional policies, as discussed in supplementary note 2. The IRA incentives are then added to these assumptions to examine the impacts of IRA (ceteris paribus).
Models vary in their coverage of IRA provisions (table S3) and how these incentives are represented (see SI S2). While no model includes all IRA provisions, every model includes the main power sector provisions (table S3), which are expected to account for the majority of emissions reductions. Each model has different methods for calculating which technologies utilize which tax credits, what bonuses apply for which projects, when tax credits phase out, and the impact of direct pay and transferability, among other policy implementations. The major power sector tax credits—PTC, 45Q credits for captured CO2, 45V credits for clean hydrogen, and existing nuclear credits—are adjusted for inflation over time in the bill text 20 .
For the core IRA provisions, low and high sensitivities have been conducted to examine how uncertainties related to IRA implementation could affect model outcomes. These sensitivities vary assumptions about bonus credits, tax-equity haircuts, eligibility for end-use credits, and technology-specific deployment constraints (see SI S2, table S4 for specific scenario assumptions). Fuel costs, macroeconomic conditions, and technology costs are consistent across these runs.
2.4. Input assumptions
Input assumptions about the costs of supply- and demand-side technologies vary across models. Two important assumptions for power sector outcomes are capital costs of generation resources, which are compared in figure S3, and natural gas price projections over time, which are shown in figure S4. Two popular public data sources are the Energy Information Administration's (EIA) Annual Energy Outlook (AEO) and National Renewable Energy Laboratory's (NREL) Annual Technology Baseline (ATB). These different datasets and cost assumptions are aggregated and downscaled to the relevant resolution of each model. Both EIA's AEO and NREL's ATB also include sources for demand-side technology costs and performance.
Figure S3 illustrates how input assumptions for generation and energy storage costs are similar across models, largely due to the widespread use of NREL's ATB for cost assumptions. Figure S4 suggests that assumptions about natural gas prices vary more across models. Although several models use EIA's AEO for fuel price assumptions, modeling teams use different near-term adjustments to account for recent observed price increases and alternate AEO scenarios for changes over time.
2.5. Caveats
Cross-model differences reflect several sources of uncertainty:
- Some IRA provisions await governmental guidance and rulemakings regarding interpretation and implementation as of the time this analysis was conducted (e.g. 45V credits for hydrogen).
- Technology and fuel costs depend on external uncertainties (e.g. other policies, inflationary drivers, technology trends, domestic and international economies).
- Several implementation factors are challenging to model but may influence adoption, including barriers to siting and permitting; uncertain infrastructure buildout (e.g. transmission); interconnection queue delays; scaling supply chains, workforce, and materials; other grid system upgrades to maintain reliability with the retirement of existing capacity; and non-cost factors influencing adoption.
- There are unknowns about the impacts of electrification on demand growth, profiles, and flexibility, and some models do not capture these changes endogenously with IRA incentives (table S1).
Effects of IRA depend on responses to IRA provisions in terms of clean energy adoption and producer choices, changes in policy, technological progress, and others. Models attempt to represent key economic and policy factors that shape emissions and energy systems trajectories and are typically designed to find least-cost system pathways.
These uncertainties and model simplifications imply that results should be interpreted as conditional projections based on economic incentives and not as predictions of policy-induced outcomes.
3. Results
3.1. Investments and retirements
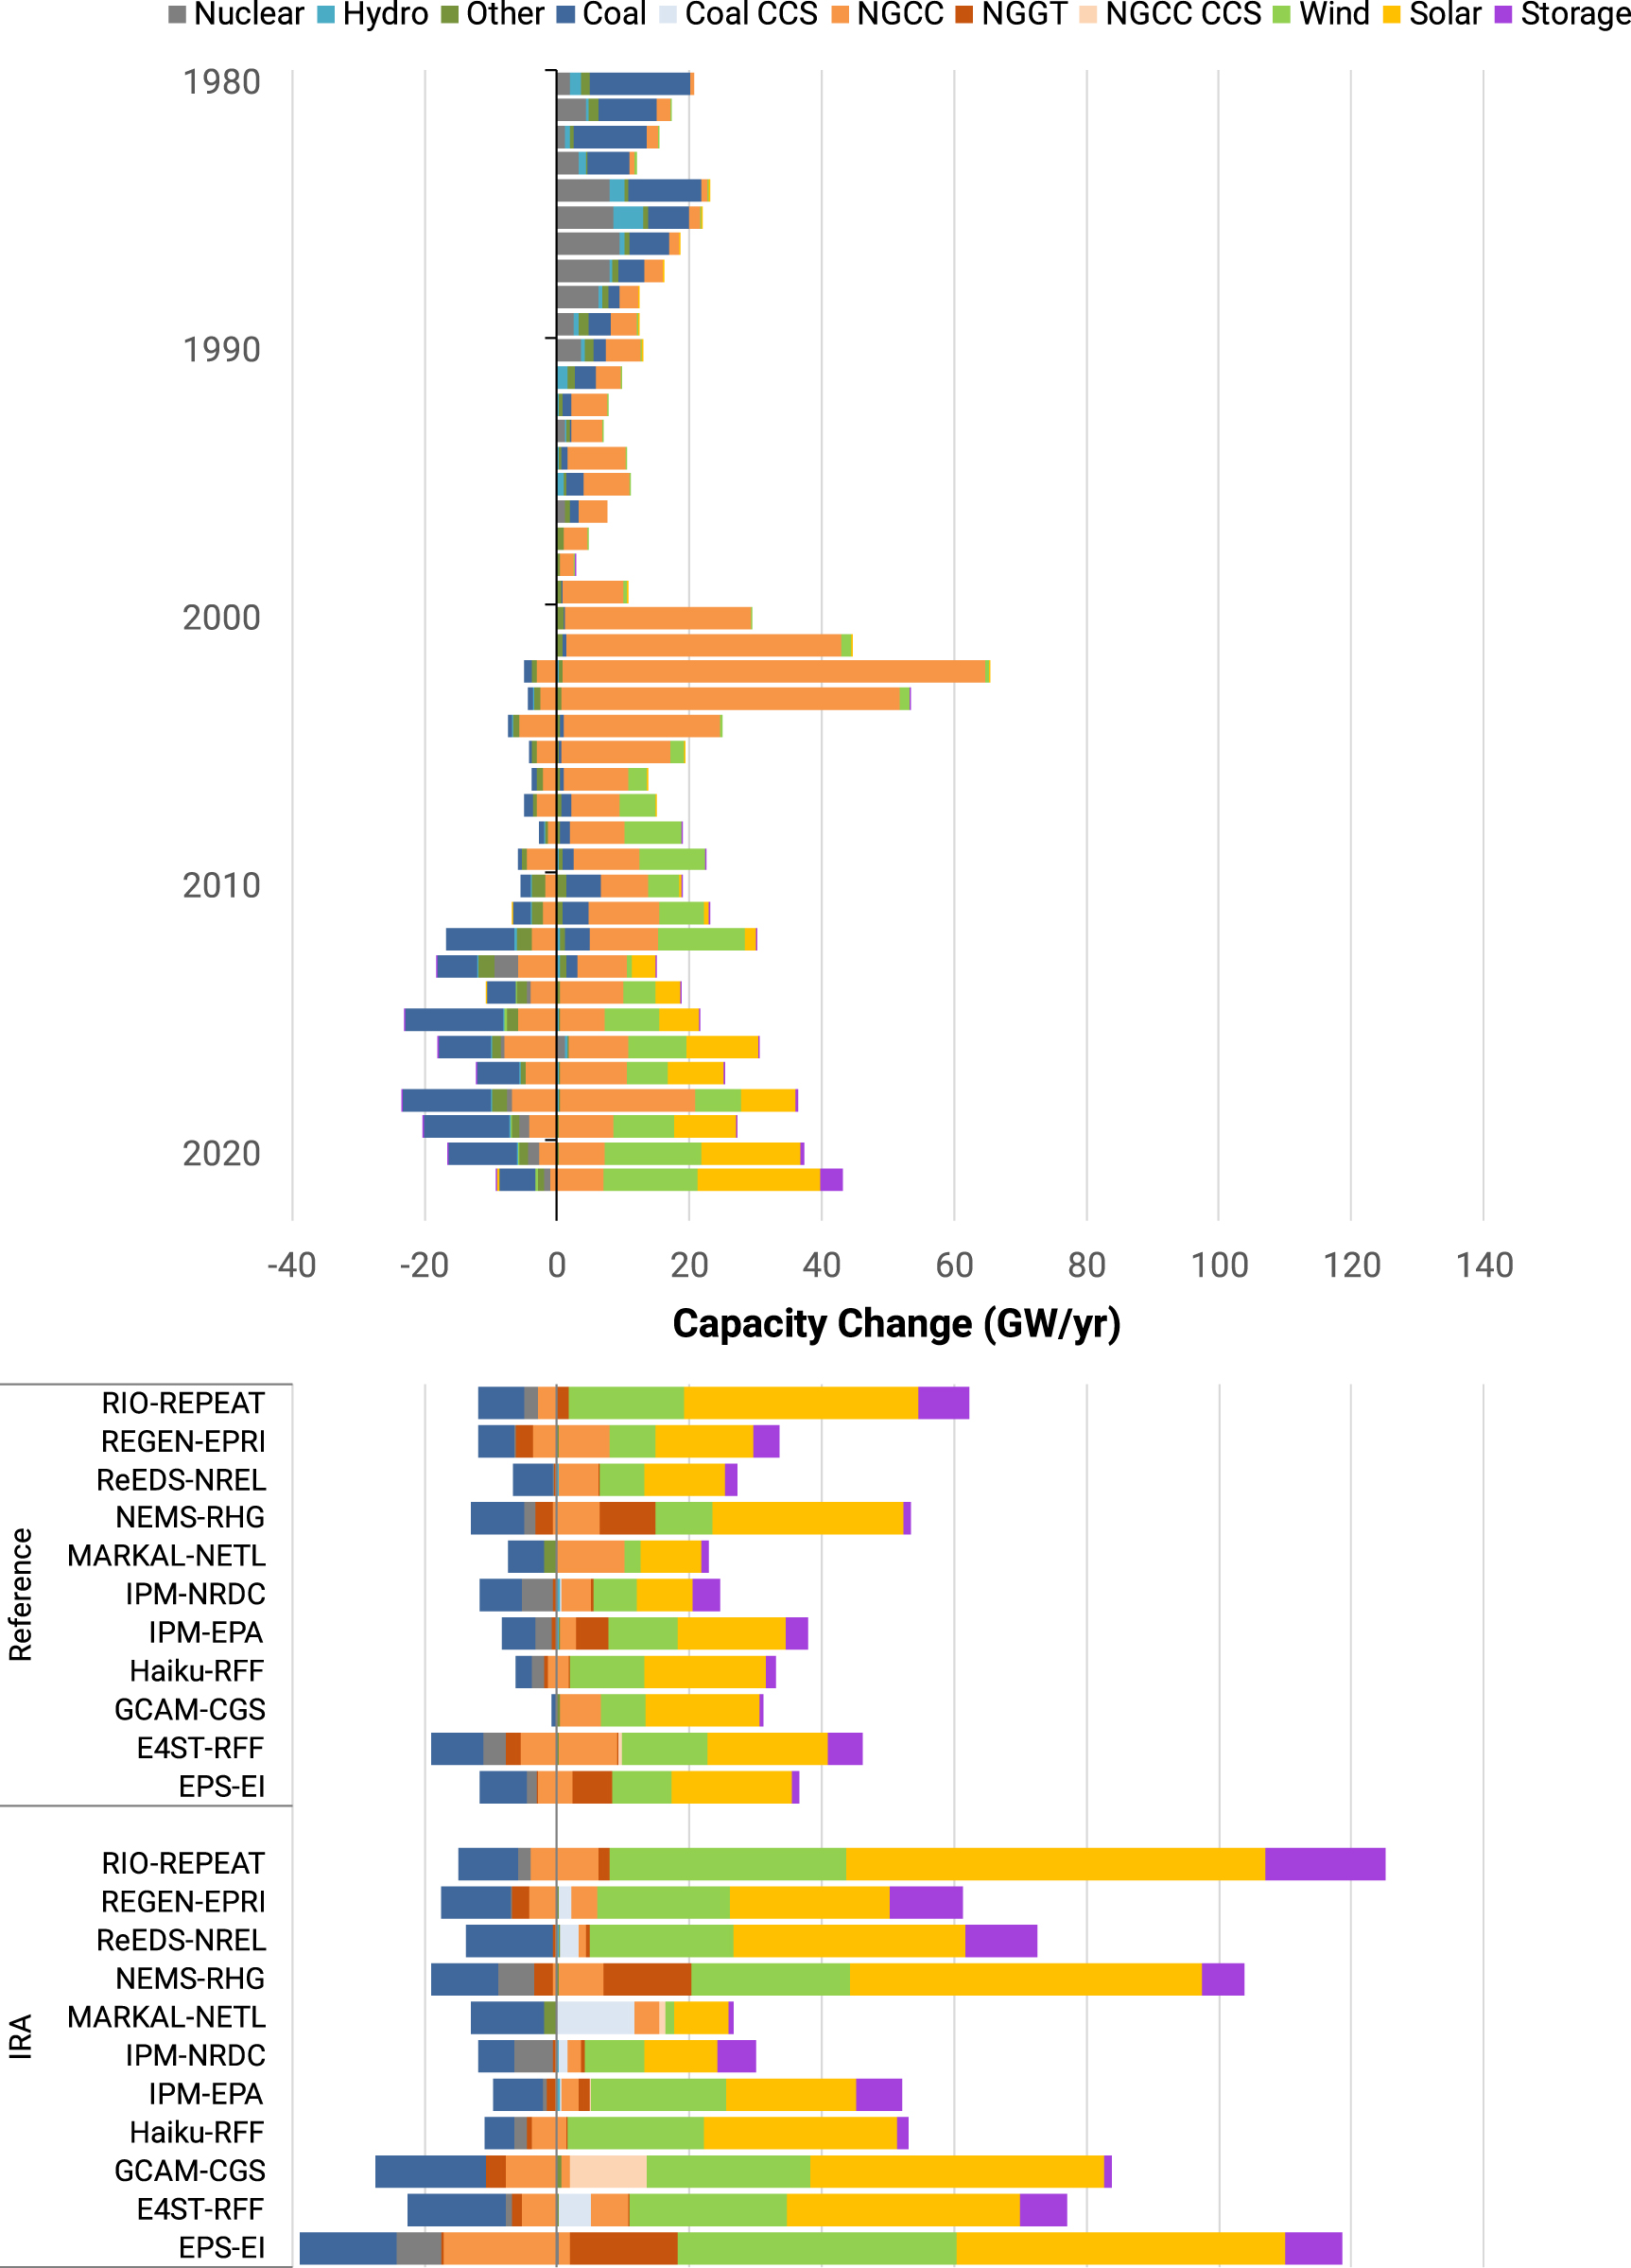
IRA accelerates deployment of low-emitting resources—defined here as renewables, nuclear, and generation with carbon capture and storage (CCS)—and leads to fewer near-term nuclear retirements relative to the reference case without IRA (figure 1). This sustained deployment of low-emitting resources and energy storage, spurred by technology-neutral PTCs and ITCs and credits for CO2 capture, is projected to be the most extensive in U.S. history. IRA increases deployment of low-emitting capacity, with 23–120 GW added annually (67 GW yr−1 mean across models) through 2035 across models. This is compared to 13–61 GW yr−1 in the reference without IRA (30 GW yr−1 average), and the annual record of 65 GW added in 2002 for all power resources, which was primarily gas-fired capacity. These increases in low-emitting capacity deployment continue through the 2030s due to most models not crossing the 25% of 2022 CO2 emissions threshold until after 2035 (as discussed in section 3.3), which means that eligible technologies could receive the PTC or ITC over a longer time horizon than other IRA tax credits that expire after 2032 21 . Such unprecedented levels of deployment require substantial scale ups of supply chains, infrastructure, and workforce, which elements of IRA aim to address and some models represent through build rate constraints, mostly for emerging technologies [8].
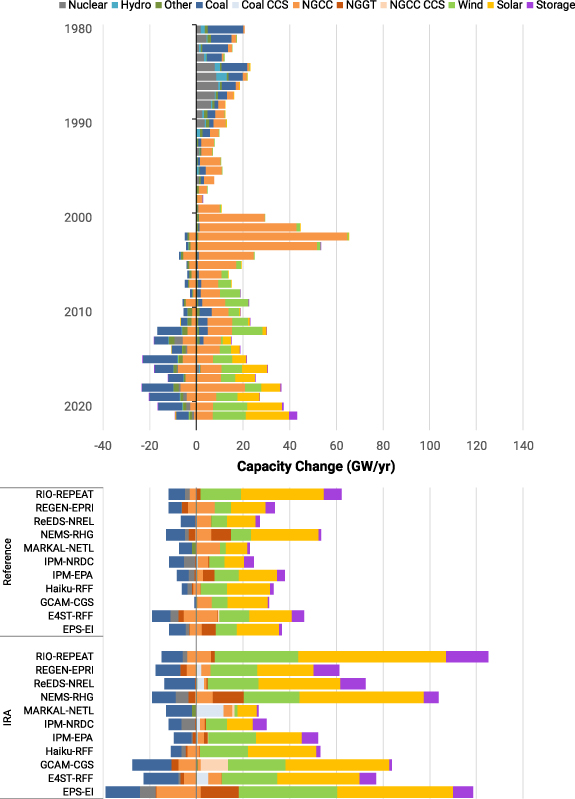
Figure 1. Capacity additions and retirements by technology and model. Average annual rate through 2035 under the reference and IRA scenarios. Utility-scale and distributed capacity are shown. Historical additions and retirements come from Form EIA-860 data. NGGT = natural gas turbines; NGCC = natural gas combined cycle; CCS = carbon capture and storage.
Download figure:
Standard image High-resolution imageAlthough there are model-specific differences in the extent of changes, most models agree that wind and solar lead IRA-induced increases in adoption (figure 1). Average growth rates through 2035 for wind and solar capacity range from 10–99 GW yr−1 (56 GW yr−1 average). This is both higher than the reference (12–53 GW yr−1 with 27 GW yr−1 average) and the annual record of 32 GW (utility-scale and distributed) installed in 2021. This expansion leads to 1.4–6.2 times current installed wind and solar capacity by 2035.
Annual installations of energy storage also increase under IRA with 1–18 GW added annually and a 7 GW yr−1 average (compared with 0.4–8 GW yr−1 and 3 GW yr−1 average in the reference). Since cumulative battery storage deployments in the U.S. are 7 GW as of 2022, IRA projections indicate exceeding 2022 installations annually (on average) over the next decade. Note that uncertainties in future cost and performance assumptions for energy storage and other technologies (figure S3) may increase the range of projected outcomes.
IRA amplifies deployment of relatively mature technologies, such as wind and solar, while also increasing the adoption of emerging technologies. IRA includes an extension and enhancement of 45Q credits, which offer up to $85/t-CO2 for captured and stored CO2 for electricity, industry, and fuels. The extent and composition of CCS deployment varies by model (figure S9) and ranges from 0–150 GW (37 GW average) by 2035 (figure S5). 4 of 11 models show <1 GW deployment of CCS in the power sector by 2035 (though each shows CCS deployed for non-power applications), 1 model shows more CO2 captured from gas CCS compared to coal CCS, while the remaining 6 models expect more coal CCS. Coal CCS capacity is driven by greater subsidies from IRA per unit of output for these plants relative to gas, due to coal's higher emissions intensity before capture. Models with higher gas CCS deployment also tend to have lower capital cost assumptions for this technology (figure S3), indicating that capital cost assumptions (combined with fuel prices) influence the extent of deployment. CCS deployment is one of the biggest departures from the reference, where little capacity is deployed by 2035, though CCS is deployed in deeper decarbonization scenarios [22, 23]. Because commercial-scale CCS and pipeline capacity are relatively nascent, projected deployment depends heavily on technological assumptions, permitting and siting timelines, CO2 storage and transportation costs, and project risk.
More existing nuclear capacity remains online with IRA through 2030, between 80–99 GW (compared with 55–100 GW in the reference), due to incentives in IRA. But after subsidies expire, the spread in model results widens significantly, ranging from 5–97 GW in 2035 (figure S5). The models with the greatest decline in nuclear generation also tend to have lower natural gas price assumptions in 2035 (figure S4). This comparison suggests that, when subsidies for existing nuclear expire, retirement risks increase, especially with lower natural gas prices and wholesale power prices. This finding aligns with the literature indicating that retirements of existing nuclear capacity are linked to natural gas prices, ongoing costs, and policy [24].
3.2. Generation
IRA lowers coal and natural gas generation while increasing low-emitting generation shares (figure 2). In 2035, unabated coal reductions from 2021 levels range from 44%–100% with IRA (84% average) versus 12%–63% in the reference (38% average). In addition to retirements, lower coal capacity factors drive this change—ranging from 7%–64% with IRA in 2035 (32% average) versus 38%–74% in the reference (57% average). Gas-fired generation shares in 2035 range from 7%–38% with IRA (21% average) versus 16%–47% in the reference (33% average), down in many scenarios from 39% in 2021. Retirements of natural gas combined cycle (NGCC) and natural gas turbine (NGGT) capacity are lower than for coal (figure 1). NGCC capacity (figure S5) declines less than its generation, as units can operate at lower capacity factors (figure S7), providing capacity in periods of system stress. NGGTs are less impacted by IRA provisions, because they are primarily used for peaking capacity rather than generation. Figure S11 illustrates the influence of gas price assumptions on generation shares, and although gas prices do not uniquely determine technology-specific deployment, these prices are generally positively correlated with wind, solar, nuclear, and coal shares and negatively correlated with gas generation shares.
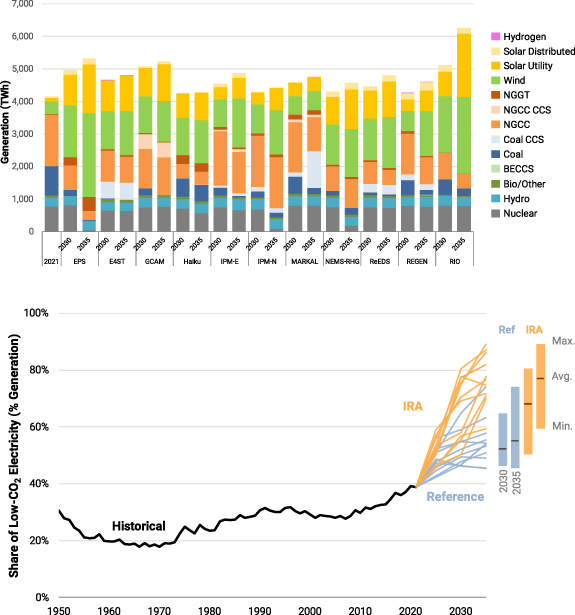
Figure 2. Cross-model comparison of electricity generation by technology over time. (A) Generation by technology under the IRA scenario. (B) Low-emissions generation share comparison under the IRA and reference scenarios, including renewables, nuclear, and CCS-equipped generation, where historical values come from the U.S. EIA's 'Monthly Energy Review.' NGGT = natural gas turbines; NGCC = natural gas combined cycle; CCS = carbon capture and storage; BECCS = bioenergy with CCS.
Download figure:
Standard image High-resolution imageGeneration shares from renewables, nuclear, and CCS-equipped generation in 2035 range from 59%–89% with IRA (77% average) versus 46%–74% reference (55% average), as shown in figure 2(B). Note that emissions reductions do not track exactly with low-emitting generation shares, since the relative share of coal and natural gas displaced by new generation also drives CO2 changes.
Given regionally varied resources, the increased deployment of renewables contributes to additional transmission expansion. IRA model projections show transmission infrastructure growing at a rate of 0.4%–2.3% per year through 2035 versus 0.2%–0.8% in the reference, which is greater for many models than the recent annual rate of ∼1.2% but similar to the longer-term growth rate of 1.9% experienced from 1978–1999 [25, 26]. However, transmission expansion is greatly influenced by the underlying model structures (e.g. spatial resolution, endogenous expansion) and input assumptions (e.g. costs, constraints).
Electricity demand increases with IRA from incentives for end-use electrification, including subsidies for electric vehicles and heat pumps. Energy system models indicate an 8%–36% increase in load by 2035 (22% average) from 2021 levels (7%–31% in the reference, 19% average). This sustained demand growth is a notable departure from the roughly constant national demand for electricity experienced in the U.S. since the mid-2000s [27]. The combination of peak load growth from electrification and deployment of variable renewables leads to greater capacity deployment than generation growth, though energy efficiency may partially offset these increases.
Although hydrogen use for power generation is nearly zero (figure 2(A)), IRA incentives for hydrogen shift production toward lower-emitting technologies (figure S21) and expand non-electric hydrogen consumption. Models differ in the degree of production from electrolysis and CCS-equipped steam methane reforming as well in the extent of growth in end-use demand for hydrogen, which ranges from near-current levels to a doubling by 2030. Models with electrolytic hydrogen production have corresponding increases in electricity demand, though this growth is modest relative to other end-use demand (figure S19).
SI S3 provides additional comparisons illustrating the relative roles of input assumptions and model structure on the power sector mix across models. Many of these factors interact to determine technology-specific deployment, though assumptions about capital costs, discount rates, and gas prices as well as structural features such as a model's temporal resolution all influence modeled effects of IRA.
3.3. Emissions
IRA accelerates emissions reductions in the power sector, which cuts emissions faster and deeper than other sectors. As shown in Bistline et al [8], the reduction in economy-wide GHG emissions from IRA by 2030 is on average 9 percentage points (ranging 3–15 p.p.), while power sector CO2 emissions are reduced an average of 18 p.p. (ranging from 5–34 p.p.) from reference levels. The electric sector constitutes most of the economy-wide GHG mitigation from IRA with declining emissions in the power sector contributing 38%–80% of reductions relative to the reference (64% average) in 2030, and the reduced emissions intensity of electricity generation amplifies additional emissions reductions in transportation, buildings, and industry due to electrification (figure S19).
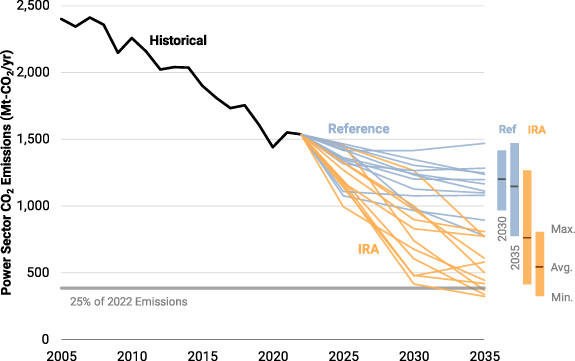
Models indicate consistent trends in power sector emissions reductions but with variation in the magnitude of reductions. By 2030, projected electricity CO2 emissions are 47%–83% below 2005 levels with IRA (68% average) compared to 41%–60% (50% average) in the reference (figure 3(A)). By 2035, the range of reductions tightens to 66%–87% (78% average) given additional time for lower costs, retirements, and ratcheting state policies. Nevertheless, the power sector falls short of reaching the U.S. goal of 100% 'carbon pollution-free electricity' [10] by 2035 in all models. Additional actions at federal, state, and local levels can narrow the gap further, given how IRA lowers costs associated with adopting policies and may encourage technological progress.
Figure 3. Comparison of CO2 emissions outcomes across models. Historical and projected electric sector emissions over time under IRA and reference scenarios. Historical emissions are based on the U.S. EPA's 'Inventory of U.S. Greenhouse Gas Emissions and Sinks'.
Download figure:
Standard image High-resolution image
Under IRA, the technology-neutral production and ITCs for zero-emitting resources could continue after 2032 if power sector CO2 emissions are above 25% of their 2022 levels. Only 3 of 11 models reach this threshold by 2035, and emissions in many models exceed these levels even in 2050 (figure S13). All three models that cross this threshold by 2035 eventually increase emissions and exceed this threshold in later periods. This timing has important implications for electric company planning, as these scenarios indicate that tax credits could be sustained well beyond 2032 to incentivize decarbonization. Nuclear retirements, load growth, and expiring CCS incentives play roles in potential emissions rebounds after 2032, which delay the point when the emissions threshold is crossed, while accelerated coal plant retirements and additional policies could mean that the threshold is reached sooner.
Moving away from carbon-intensive fuels also lowers conventional air pollutants, which can help improve air quality and lower health burdens on local communities [5, 17, 28]. Figure S14 illustrates declines in NOx and SO2 emissions over time, and IRA-induced reductions relative to the reference mirror similar trends in CO2.
3.4. Costs
Although IRA's power sector credits lower long-run costs (including all capital and operating costs after accounting for tax credit values), costs in any given year may increase or decrease, especially after accounting for IRA's electrification incentives. IRA accelerates the shift to low-emitting resources, which generally entail higher capital costs while lowering fuel and operating costs [18, 23]. Models disagree about whether IRA would increase or decrease power sector costs relative to the reference (figure S16). Increases could come from greater electricity demand (from electrification) or from higher electricity prices (due to accelerated investments). The balance of these effects depends on which tax credits are used (e.g. investment credits lower upfront costs, while production credits lower operating costs over time), and the timing of capacity deployment. However, wholesale and residential retail electricity prices decline across nearly all models and time periods between the reference and IRA scenarios (figure S17), which suggests that greater demand is the main driver of increased electricity expenditures.
IRA could lead to lower total energy costs for households and businesses, as lower fossil fuel expenditures more than offset potential increases in electricity spending (figure S16). Although net costs decline for most economy-wide models and periods, there are increases in total electricity costs due to higher electricity demand from electrification. Models showing declining electricity costs in figure S16 are electricity-only partial equilibrium models that do not account for IRA-driven electrification (figure S19). Net costs vary by model and over time: Cost declines with IRA are $10–52B per year (about $73–370 per household) by 2035 relative to the reference. Households benefit directly from energy spending and indirectly from lower prices of goods and services throughout the economy, which are both included in this total. Ultimately, the distributional impacts of IRA depend not only on direct expenditures on fuels but also on end-use incentives in IRA, how revenue is raised/recycled, and other changes in the tax code through IRA. Such comparisons require computable general equilibrium models with detailed treatments of the tax code and assumptions about pass-through of tax credits, which are beyond the scope of this analysis but are discussed in a few recent studies [9, 16, 17].
Projected federal tax credit expenditures vary across models and over time in terms of their magnitudes and compositions (figure S18). Cumulative power sector tax credit values range from $81–410B through 2030 ($230B average). These cumulative tax expenditures increase to $240–960B through 2035 ($530B average) due to the extended eligibility of power sector credits. Annual expenditures range from $28–100B in 2035 ($56B average). Tax credit expenditures across provisions with uncapped incentives, including the power sector production- and investment-based credits as well as 45Q credits for stored CO2, reflect the relative uptake across models. Note that the implied fiscal costs per unit of emissions reduced are higher in instances where there are considerable investments in subsidized resources under reference conditions even without IRA tax credits (figure 1).
3.5. Low and high sensitivities
To understand how alternate assumptions about IRA implementation and related assumptions could alter power sector outcomes, low and high IRA sensitivities were conducted used harmonized scenario assumptions (see table S4 in SI S2) in 7 of 11 models. These sensitivities vary assumptions about IRA bonus credits, tax-equity haircuts, eligibility for end-use credits, and implementation details while holding other assumptions constant (e.g. fuel and technology costs). These sensitivities highlight how these IRA assumptions can shift generation shares and levels of CO2 reductions in the power sector (figure S22). In 2035, CO2 reductions in the 'Mid' IRA case range from 66%–87% from 2005 levels, which broadens to 60%–92% under the 'Low' and 'High' sensitivities. Similarly, the 2035 low-emitting generation share ranges from 59%–89% in the 'Mid' IRA case, which broadens to 59%–95% under the 'Low' and 'High' sensitivities. Although these scenarios broaden the range of possible outcomes, they also suggest that variations in the generation mix across models can be more significant than differences across sensitivities within a single model, highlighting the value of model intercomparisons like this one.
4. Discussion
This analysis quantifies potential magnitudes of power sector changes from IRA. Across 11 models, power sector CO2 emissions reductions range from 47%–83% below 2005 levels in 2030, which directly accounts for 38%–80% of IRA-induced GHG mitigation across the economy [8]. These reductions increase to 66%–87% below 2005 in 2035, which suggests that IRA's effects may take time to be fully realized. Further federal, state, and local regulatory and legislative activity as well as voluntary private sector action is not included in these scenarios but may be strengthened by IRA incentives. This enhanced ambition could help to narrow the implementation gap for reaching targets such as the U.S. Paris Agreement pledge to reduce economy-wide GHG emissions 50%–52% below 2005 by 2030 [10, 12].
Several policy implications follow from this work:
- IRA lowers emissions relative to a counterfactual without these incentives, helping to narrow the climate policy implementation gap (figure 3). However, no models indicate that the U.S. 2030 economy-wide climate target or the 2035 'carbon pollution-free' electricity goal will be achieved with IRA and other existing policies alone. Additional federal, state, and company actions are needed to reach these emissions goals, though this increased ambition could be encouraged by the lower costs of such actions due to IRA incentives.
- Power sector IRA incentives may continue until the sector's CO2 emissions reach 25% of their 2022 levels. This analysis suggests that 3 of 11 models reach this threshold by 2035, and emissions in many models exceed these levels even in 2050 (figure S13). These results indicate that IRA tax credits may be sustained well beyond 2032, which has implications for electric company planning, regulatory analysis, and other policies where the cost of power sector investments over time influence outcomes.
- The large role of wind and solar in power sector mitigation across most models (figure 2) highlights the importance of policies to address siting, permitting, and interconnection; to encourage deployment of complementary resources such as transmission and energy storage; and to assist with financing, supply chain, and workforce issues. The variation across models in the extent of wind and solar deployment partially reflects uncertainties about the timing and pace of addressing these issues.
- IRA's incentive-driven approach through tax credits and grants can incentivize new additions of low-emitting generation technologies (figure 1). However, IRA has relatively few provisions that directly penalize emissions or preferentially encourage displacement of higher-emitting assets first (e.g. coal-fired power plants), which may mean that more existing emissions-intensive assets could remain operating longer than under other policy instruments [9]. Complementary state and federal policies, including power plant emissions standards, cap-and-trade programs, or carbon pricing, may therefore deepen power sector emissions reductions beyond current IRA scenarios.
IRA makes investments to modernize the U.S. energy system and fundamentally changes the economics of decarbonization. Incentives such as tax credits change relative prices of technologies by making low-emitting resources cheap, but not by directly pricing carbon or capping emissions. The investment-based approach of IRA could alter the decarbonization challenge from one of policy compliance to opportunity capture. The projected reduction in energy costs associated with an incentive-based policy approach is a feature that was used to enhance the political feasibility of the legislation before enactment and that has implications for its robustness against future legislative challenge.
Subsidy-based approaches have several similarities and differences from other policy instruments such as carbon pricing (e.g. cap-and-trade system, carbon fee) or performance standards (e.g. renewable portfolio standards, clean electricity standards). For equivalent CO2 emissions reductions, carbon pricing is generally expected to be the most cost-effective instrument in terms of costs per ton of CO2 abated, though the efficiency gap between instruments depends on stringency, policy design, fossil fuel prices, and relative technology costs [9, 29–32]. For instance, in a detailed comparison of subsidy-based approaches and carbon pricing, Bistline et al [9] show that average abatement costs of a CO2-equivalent policy for the power sector provisions of IRA would be approximately $10/t-CO2, compared with $45–61/t-CO2 with IRA. One complication with abatement cost comparisons across different policies is that induced technological change can vary by policy design, though the impacts of such dynamic cost effects are uncertain across different policies and are rarely represented explicitly in modeled outcomes [33]. Even when economic efficiency is similar, policies can differ in terms of their impacts on electricity prices and government outlays. Subsidies such as IRA's tax credits tend to lower electricity prices while having higher government outlays relative to other policies [9, 29, 34]. Carbon pricing, on the other hand, tends to raise revenues and electricity prices, which has implications for conservation and efficiency, fiscal impacts, and distributional outcomes. Distributional outcomes of alternate policy approaches across socioeconomic dimensions such as income depend on policy design, including how revenues are used (especially for carbon pricing), complementary measures (including the non-climate IRA provisions), and coverage of other sectors [35, 36]. Recent papers investigate some of the distributional implications of IRA [8, 16, 17], which require more specialized analysis than this paper can provide. Co-benefits associated with non-CO2 pollutant reductions also differ across power sector decarbonization policy approaches. For instance, carbon pricing tends to lower coal generation faster than other policy instruments that do not directly penalize generation based on its emissions intensity, which means that these approaches tend to have greater health benefits from air quality improvements [9, 37]. Finally, it is important to note that IRA was intended to address multiple objectives—climate policy, industrial policy, technology policy, employment policy, and others.
Baselines for power sector emissions and generation outcomes have changed significantly in recent years. Even before accounting for IRA, reference wind and solar generation exhibited in this model intercomparison generally exceeds older projections from a 2018 Energy Modeling Forum comparison that considered a $50/t-CO2 carbon tax [38] due to lower technology costs and increased stringency of state policies—trends that IRA amplifies (figure S23). Similarly, power sector CO2 emissions projections have shifted, as the updated reference scenario in this study is closer to the $25/t-CO2 carbon tax scenario from EMF 32 than it is to the older reference, and emissions with IRA are between the $25/t-CO2 and $50/t-CO2 carbon tax scenarios.
This analysis illustrates that there are many consistencies across models in some dimensions (e.g. emissions reductions in 2035), while greater variation is expected for others (e.g. extent of electric sector investments, CCS uptake, tax credit value). Cross-model differences are due to a combination of model structure and input assumptions, including constraints on scaling of low-emissions resources, supporting infrastructure, and supply chains, though a precise breakdown of these factors is left for future work. This study identifies several uncertainties that may impact IRA-induced changes to the power sector:
- Deployment frictions and execution risks: The pace and extent of wind and solar deployment (figure 1) face implementation frictions and execution risks—such as those related to permitting, siting, interconnection, supply chains, and workforce availability—which are important to capture, though these are challenging to model.
- IRA guidance and implementation: Low and high IRA implementation sensitivities illustrate how the range of potential generation mix and emissions outcomes can be broad and may be affected by the efficacy of IRA implementation, although these scenarios also suggest that differences across models may be larger than variations across assumptions for a single model, which highlights the importance of model intercomparison like this one.
- Policy uncertainty: We investigate IRA-related implementation uncertainties, but many other federal and state policies and regulations could be passed that influence IRA's impacts on the power sector, including EPA's power plant performance standards for new and existing power plants that were proposed in May 2023 [39].
- Technology uncertainty: Unknowns about future costs, fuel prices, interest rates, scaling emerging technologies, and deploying supporting infrastructure (e.g. electricity transmission, energy storage, CO2 and hydrogen pipelines) influence IRA's impact. Sensitivities around these assumptions are explored in several other IRA studies [9, 23, 40]. Technological cost assumptions and fuel prices may span a broader range than the model assumptions discussed in supplementary note 2.
- Model uncertainty: Impacts of model structure are implicitly quantified in earlier sections, where scenario assumptions are harmonized and similar input assumptions are used. Results illustrate how structural features such as a model's temporal resolution (figure S12) can shape projected impacts from IRA.
- Incidence of tax credits: The extent to which tax credits are passed through to consumers through electricity prices depends on the degree of market competition, market structure, as well as the price elasticities of supply and demand 22 . These factors vary by region and tax credit, and although the extant literature does not provide empirical evidence of pass-through for historical utility-scale wind and solar tax credits in U.S. markets, there are examples of pass-through for distributed energy credits. For instance, evidence about distributed solar is mixed—with some papers suggest value-based pricing [41], while others indicate strong pass-through [42]. Future work should study the pass-through of these credits, which affects their distributional outcomes. Existing research indicates that IRA's power sector tax credits could yield progressive outcomes [16, 17], though distributional impacts are outside of the scope of this analysis.
5. Conclusion
IRA is the most prominent piece of climate legislation in the U.S. so far. Our study investigates IRA's potential impacts on the U.S. power sector—currently the second largest emitting sector in the world's second largest emitting country [11]. The ultimate impact of IRA on U.S. emissions is notable, as countries are attempting to bridge the gap between pledged ambition and substantive action under the Paris Agreement to hold warming well below 2 °C, and IRA is intended to contribute to the U.S. pledge to reduce economy-wide GHG emissions by 50%–52% by 2030 relative to 2005 [10]. Our analysis illustrates how IRA helps to bring projected U.S. power sector and economy-wide emissions closer to near-term climate targets; however, no models indicate that these targets will be met with IRA alone, which suggests that additional policies, incentives, and private sector actions are needed.
Future work should build on these comparisons by examining how uncertainties in the planning environment, including fuel prices, technological costs, interest rates and financing, and policies, could shape power sector trajectories. Additional sensitivities are also warranted to explore how technological change may alter the decarbonization outlook. On one hand, IRA and IIJA support a range of technologies including renewables, nuclear, CCS, energy storage, hydrogen, direct air capture, and others, where deployment may further lower costs. On the other, supply constraints and the Russian invasion of Ukraine have increased supply-side technology costs higher than previously estimated [43]. Questions remain about how these countervailing drivers will alter technology costs and deployment. Finally, additional work should investigate uncertainties around IRA impacts outside of the power sector, including the extent of electrification, changing load profiles, fossil fuel demand, electrolytic hydrogen demand, and how those changes may further impact expected future decarbonization.
Acknowledgments
The views and opinions expressed in this paper are those of the authors alone and do not necessarily state or reflect those of their respective institutions or funding agencies, and no official endorsement should be inferred. The authors thank Jordan Wingenroth for his assistance with social cost of CO2 data.
Data availability statement
The data that support the findings of this study are openly available at the following URL/DOI: https://doi.org/10.5281/zenodo.8322973.
Funding
M B, A H, and D S were funded by the DOE Office of Policy through the National Renewable Energy Laboratory, operated by Alliance for Sustainable Energy, LLC, for the DOE under Contract No. DE-AC36-08GO28308. J F, J J, R J, E M, N P, and G S were funded by the William and Flora Hewlett Foundation. B K, H K, and J L were funded by Bloomberg Philanthropies, the William and Flora Hewlett Foundation, and the Heising-Simons Foundation. H M and A Z were funded by Bloomberg Philanthropies. R W was funded by Lawrence Berkeley National Laboratory under Contract No. DE-AC02-05CH11231 with the U.S. DOE.
The U.S. Government retains and the publisher, by accepting the article for publication, acknowledges that the U.S. Government retains a nonexclusive, paid-up, irrevocable, worldwide license to publish or reproduce the published form of this work, or allow others to do so, for U.S. Government purposes.
Author contributions
Conceptualization: All authors
Methodology: All authors
Investigation: All authors
Visualization: J B
Writing—original draft: J B, M B, M D, C M, N R
Writing—review & editing: All authors
Conflict of interest
John Bistline, Geoffrey Blanford, and Christopher Roney are affiliated with the Electric Power Research Institute (EPRI), which is an independent non-profit energy research, development, and deployment organization that is funded by hundreds of organizations around the world, including the energy sector, academia, and government.
Jesse Jenkins is part owner of DeSolve, LLC, which provides techno-economic analysis and decision support for clean energy technology ventures and investors. A list of clients can be found at www.linkedin.com/in/jessedjenkins. He serves on the advisory boards of Eavor Technologies Inc., a closed-loop geothermal technology company, and Rondo Energy, a provider of high-temperature thermal energy storage and industrial decarbonization solutions and has an equity interest in both companies. He also provides policy advisory services to Clean Air Task Force, a non-profit environmental advocacy group, and serves as a technical advisor to MUUS Climate Partners and Energy Impact Partners, both investors in early-stage climate technology companies.
Ryan Wiser is a senior scientist at Lawrence Berkeley National Laboratory, on partial detail under contract to the U.S. Department of Energy.
The other authors declare no competing interests.
Footnotes
- 19
Even in cases where new low-emitting generation is lower cost than higher-emitting ones, costs of operating and maintaining existing higher-emitting resources may be lower than the combined investment and operational costs of new low-emitting options. These dynamics may shift if emissions penalties are applied to higher-emitting resources through instruments such as carbon pricing or emissions regulations. In addition, new wind and solar may entail additional system costs that can shape the extent of deployment (e.g. transmission to connect resources to the grid).
- 20
Models in this study do not endogenously represent inflation and instead consider all costs in real dollar terms.
- 21
For models reaching the threshold by 2035, the majority of capacity additions in the post-subsidy period through 2050 are low-emitting generation and energy storage technologies, largely due to the low relative costs of wind, solar, and batteries.
- 22
Most electric sector capacity expansion models, including those participating in this study, assume competitive electricity markets. Hence, results related to retail and wholesale electricity prices presented in supplementary note 3 should not be interpreted as evidence of the magnitude of tax credit pass-through.
Supplementary data (0.6 MB PDF)