

Abstract
One of the most dramatic climate responses to future global warming is the near-disappearance of the perennial sea ice cover in the central Arctic Ocean, a phenomenon known as the ice-free summer Arctic. The immediate consequence of an ice-free Arctic would be the surface warming of the central Arctic Ocean, where sea surface temperatures (SSTs) used to be at freezing levels. Through an analysis of climate models participating in the climate model intercomparison project phase-6, this study demonstrates a wide range of responses in the central Arctic SSTs in August–September as a result of the projected ice-free summer Arctic. These responses vary from 0.7 to 8 °C in the shared socioeconomic pathway 2 (SSP2-4.5), referred to as the 'middle of the road' scenario, in which socioeconomic and technological trends do not significantly deviate from historical patterns. The extent of the central Arctic sea surface warming in August–September is found to have a loose correlation with the September sea ice extent (SIE), but a stronger connection to the SIE during spring to early summer (May–July), when incoming shortwave radiation is most intense. In certain climate models, the perennial sea ice cover disappears completely in September, causing central Arctic SSTs to rise by 5 °C–8 °C by the end of the 21st century. This leads to a bimodal distribution of annual SSTs. Further analysis reveals a close relationship between mid-summer SSTs in the central Arctic Ocean and preceding winter sea ice thickness (SIT). This underscores the significance of winter SIT in predicting future Arctic surface warming and marine heatwaves.
Export citation and abstract BibTeX RIS

Original content from this work may be used under the terms of the Creative Commons Attribution 4.0 license. Any further distribution of this work must maintain attribution to the author(s) and the title of the work, journal citation and DOI.
1. Introduction
The Arctic near-surface atmosphere has warmed by about 2 °C–3 °C, which is more than twice the rate of the global average over recent decades (Walsh 2014, Screen and Williamson 2017). Summer sea ice coverage has reduced by around 40% since 1979, the beginning of the satellite era, and this declining sea ice cover has been accompanied by sea ice thinning (Laxon et al 2013, Renner et al 2014). The continuous trend of sea ice shrinking and thinning will likely lead to an ice-free Arctic in summer by the middle of this century (Holland et al 2006, Wang and Overland 2009, Massonnet et al 2012, Overland and Wang 2013, Ravindran et al 2021). The term 'ice-free summer Arctic' implies the substantial disappearance of the perennial ice cover, primarily composed of thick multi-year ice, with the exception of some land-fast ice remaining along the northern coasts of Greenland and Ellesmere Island (Wang and Overland 2009, Screen and Williamson 2017).
The ice-free summer Arctic is likely to change large-scale atmosphere and ocean circulations, such as weakening of mid-high latitude westerlies (Deser et al 2015, Chripko et al 2021, Smith et al 2022) and weakening of Atlantic meridional overturning circulation (Sévellec et al 2017). On regional scale, the ice-free Arctic is accompanied by upper ocean warming (Timmermans et al 2018), sea surface freshening (McPhee et al 1998, Macdonald et al 2002, Ravindran et al 2021), and increased wind stress to Arctic Ocean (Zhao et al 2018). The most pressing problem, but is largely unknown and remains elusive, is probably the impact of ice-free Arctic on marine ecosystems. Previous studies suggest that Arctic bio-ecosystem could be vulnerable to Arctic ocean warming (Bluhm and Gradinger 2008, Laidre et al 2008, Walsh 2008, Zhang et al 2010, Wassmann et al 2011, Terrado et al 2013, Vancoppenolle et al 2013, Fossheim et al 2015). Specifically, Arctic ocean warming can lead to a borealisation of fish communities in the Arctic (Fossheim et al 2015), ∼50% decrease in thermal habitat (Dahlke et al 2018, Logerwell et al 2022).
Previous model-based studies have primarily focused on the timing of ice-free summers (Liu et al 2013, Jahn et al 2016, Screen and Williamson 2017, Sigmond et al 2018, Bonan et al 2021, Shen et al 2023) and future increases in annual-mean upper ocean heat content (Shu et al 2022) and hydrograph (Khosravi et al 2022, Muilwijk et al 2023), with relatively little attention given to the extent of sea surface warming associated with future ice-free summer conditions in the Arctic.
By examining 30 different climate model intercomparison project phase-6 (CMIP6) climate models, this study investigates the degree of the central Arctic sea surface warming and its relationship with summer sea ice extent (SIE). Specifically, we show that the degree of the central Arctic sea surface warming is loosely associated with September SIE but is highly dependent on sea ice cover in spring and early summer, from May to July.
2. Data and method
2.1. Data
This study uses data from CMIP6 model outputs obtained from the CMIP6 data archive (https://pcmdi.llnl.gov/CMIP6/) as listed in table B1 (Eyring et al 2016). The monthly mean data from the historical and future period using the shared socioeconomic pathways (SSPs) 2–4.5 and 5–8.5 simulations from these CMIP6 models are analysed. In order to assess Arctic sea surface temperature (SST) changes in response to future scenarios of global greenhouse gas emissions, we use 30 CMIP6 models. Out of total 55 CMIP6 models, 30 models provide all the necessary variables for our study: SST, sea ice concentration (SIC), sea ice thickness (SIT) and surface heat fluxes (hfls, hfss, rsds, rsus, rlds, rlus) for the calculation of net surface heat flux (NSHF). In this study, we focus on the last 30 years in the historical (1985–2014) and SSP scenario simulations (2071–2100).
The Arctic SIE is defined as the total area of grid cells, where SIC is equal or greater than 15%. Until now, the term 'ice-free Arctic' has been defined as September SIE less than 1.0 million km2 (Screen and Williamson 2017). In this study, we emphasize the need for a more detailed category for September SIE. Specifically, we divide 30 climate models into three groups: (1) complete ice-free models (13 models), in which 2071–2100 average September SIE is less than 0.2 million km2, (2) moderate ice-free models (9 models), in which 2071–2100 average SIE is less than 1.0 but is larger than 0.2 million km2, and (3) no ice-free models (8 models), in which 2071–2100 average SIE is larger than 1.0 million km2.
3. Results
3.1. Arctic sea ice loss and sea surface warming
This study focuses on a moderate climate change scenario, SSP2-4.5, in which summer Arctic SIEs simulated by CMIP6 models are widely different among the models (Kageyama et al 2021, Keen et al 2021, Long et al 2021). In SSP1-2.6 scenario, no models simulate the ice-free Arctic, whereas almost all the models simulate ice-free Arctic in SSP5-8.5 scenario (Årthun et al 2021). Figure 1 shows Arctic September SIE of CMIP6 models for historical and SSP2-4.5 scenario simulations. Consistent with previous studies (Holland et al 2006, Singarayer et al 2006, Overland and Wang 2007, Stroeve et al 2007, Ravindran et al 2021), models simulate long-term declining trend of SIE in response to increasing greenhouse gas concentrations, although large interannual variabilities are superimposed on the trend. Out of 30 models, 22 models simulate less than 1 million km2 of September SIE by the end of the 21st century. Ice-free Arctic is not defined as a complete ice-free condition in September but is defined as September SIE dropping below 1 million km2. This is because sea ice of coastal Greenland and Queen Elizabeth Islands in Canada, where land-fast sea ice is relatively thick, is probably not completely melted under global warming (Agnew et al 2008, Howell et al 2013).

Figure 1. (a) September SIE and (b) Aug-Sep SSTs, averaged over the central Arctic Ocean (>74° N) from 1950 to 2100. Solid lines represent historical (black, 1950–2014), SSP2-4.5 (blue, green, red, 2015–2100) simulations. Each blue, green, and red lines indicate no ice-free, moderate ice-free, and complete ice-free models, respectively. Thick sold lines indicate the averages of the three model groups. The vertical black solid line indicates the ending year of historical simulation, and the black dashed line indicates year 2071. In this study the last 30 years, from 2071 to 2100, are used for the SSP2-4.5 average.
Download figure:
Standard image High-resolution imageHowever, SIC in these regions becomes nearly zero in several CMIP6 models by the end of the 21st century (see figure 2(l)). In this study, we further divide ice-free Arctic into moderate ice-free (September SIE less than 1.0 but more than 0.2 million km2) and complete ice-free (September SIE less than 0.2 million km2) conditions. Models simulating complete ice-free Arctic by the late 21st century (2071–2100 average) show the most rapid declining trend from 2015 to 2050 (red line in figure 1(a)), whereas models simulating moderate ice-free Arctic show a relatively moderate declining trend (green line in figure 1(a)). Several models do not simulate ice-free Arctic by the late 21st century and the declining trends of September SIE of these models are relatively slow (blue line in figure 1(a)).
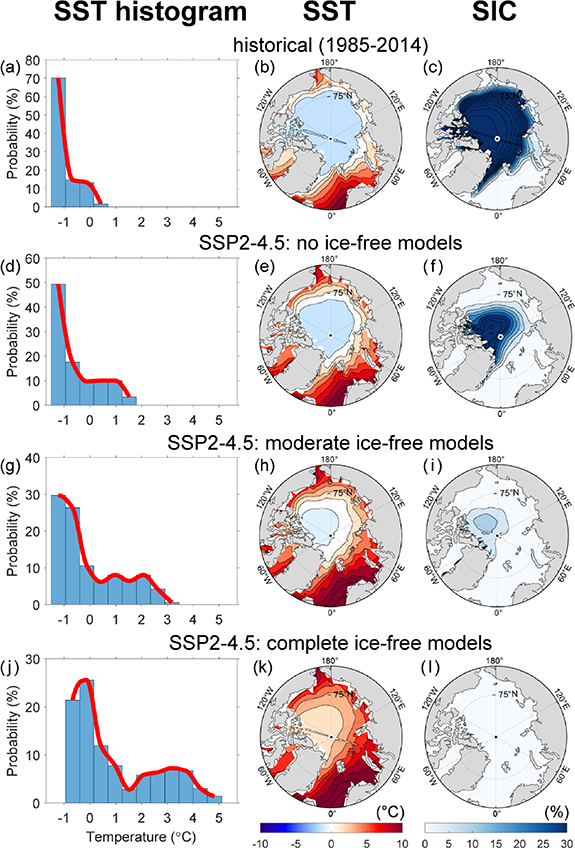
Figure 2. (Left, (a), (d), (g), (j)) Histogram for the monthly mean SSTs averaged over the central Arctic Ocean (>74° N) throughout the entire year, from January to December. In late winter (Feb-Mar), most of SSTs are below zero. (middle, (b), (e), (h), (k)) Aug-Sep average SSTs and (right, (c), (f), (i), (l)) September SIC of (b), (c) historical simulation, (e), (f) no ice-free models in SSP2-4.5, (h), (i) moderate ice-free models in SSP2-4.5, and (k), (l) complete ice-free models in SSP2-4.5. Last 30 years are averaged in historical (1985–2014) and SSP2-4.5 (2071–2100) simulations. Blue bars (left: (a), (d), (g), (j)) represent the frequency of SST in each bin.
Download figure:
Standard image High-resolution imageThe September SIE is closely tied to the central Arctic SST in August–September (Aug-Sep), during which SST reaches its maximum. Figure 1(b) shows steadily increasing trends of Aug-Sep SSTs averaged over the central Arctic (74° N–90° N) in response to future sea ice loss. There is a clear difference in the SST warming trend between the models simulating the complete ice-free and the moderate ice-free summer Arctic. The central Arctic SSTs in complete ice-free models, on average, increase up to 5.2 °C by 2100 (red line in figure 1(b)) and up to 8 °C–9 °C in several models. In the moderate ice-free models, the central Arctic SST warming, on average, is ∼3 °C (green line in figure 1(b)), which is about 2 °C lower than that of the complete ice-free models. In the no ice-free models, in which ice-free Arctic is not simulated by 2100, the central Arctic SST warming is generally within ∼1.5 °C (blue line in figure 1(b)).
3.2. Bimodal distribution of future Arctic SST
The Arctic Ocean SST covered by sea ice is close to freezing temperature, around −1.8 °C (Thomas and Dieckmann 2002, Chin et al 2017). In the historical simulation, most of the Arctic Ocean is still covered by sea ice in September (figure 2(c)), where SSTs are close to freezing temperature (blue colour in figure 2(b)). Thus, the annual (from January to December) SST distribution averaged over the central Arctic Ocean is generally confined to below −1.0 °C (figure 2(a)). The annual SST distribution averaged over the central Arctic, which is confined to around −1.5 °–0.5 °C in historical simulation (figure 2(a)), becomes a bimodal distribution by the late 21st century in the complete ice-free models (figure 2(j)). The first peak of the annual SST distribution is around −1.0 °C–0 °C and the second peak is around 3.0 °C–4.0 °C (figure 2(j)). This bimodal SST distribution is indicative of a rapid transition from freezing winter temperature to rapid Aug-Sep warming.
This rapid seasonal SST transition in the complete ice-free models is likely associated with absence of the perennial sea ice cover. In moderate ice-free models, part of perennial sea ice remains over northern coasts of Greenland and Queen Elizabeth Islands (figure 2(i)), where SSTs are close to freezing temperature (figure 2(h)). In complete ice-free models, in which almost no sea ice remains in the central Arctic Ocean (figure 2(l)), the Aug-Sep SSTs are far above the freezing temperature, mostly above 0 °C (figure 2(k)).
In several climate models, such as CanESM5, EC-Earth3, UKESM1.0-LL, the annual SST distributions in the central Arctic exhibit distinct bimodal distributions and the annual maximum SST increases up to 5 °C–6 °C in SSP2-4.5 scenario (figure A1). These bimodal SST distributions become even more distinct in SSP5-8.5 scenario (figure A2).
3.3. Aug-Sep Arctic SSTs controlled by spring-early summer NSHF
Would the September SIE be a good indicator of the degree of Aug-Sep Arctic sea surface warming? the inter-model relationship between the September SIE and the Aug-Sep SST averaged over the central Arctic shows a high correlation (r = −0.91) over the historical era, from 1985 to 2014 (figure 3(a)). This is because the September SIE is dynamically tied to NSHF, which is a controlling factor of sea ice and SST. NSHF can be written as:
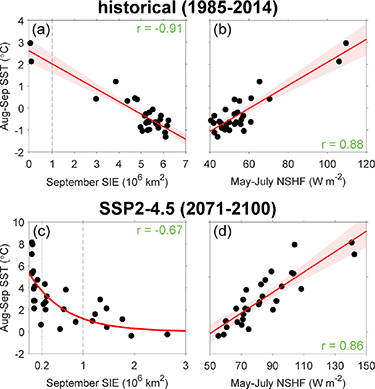
Figure 3. (Left, (a), (c)) multi-model relationship between September SIE and Aug-Sep SSTs averaged in the central Arctic Ocean (>74° N) in (a) historical and (c) SSP2-4.5 simulations. (Right, (b), (d)) multi-model relationship between May-July NSHF and Aug-Sep SST averaged in the central Arctic Ocean (>74° N) in (b) historical and (d) SSP2-4.5 simulations. The vertical dashed lines in (a), (c) are 1.0 million km2 SIE, which is the threshold for the ice-free Arctic. The solid and curved red lines indicate linear and non-linear regression fits, respectively. In (a), (b), (d) the red shadings indicate 95% confidence intervals for the linear regression lines.
Download figure:
Standard image High-resolution imagewhere  and
and  are downward and upward surface shortwave radiations, whereas
  and
and  indicate downward and upward surface longwave radiations, respectively.
  and
and  indicate surface sensible and latent heat fluxes, respectively. Downward surface heat fluxes, implying absorption of heat from atmosphere into ocean, are defined as positive values.
The temperature tendency of the ocean surface mixed layer can be explained by air-sea heat exchange and both vertical and horizontal advection (Hu et al 2020, Sharma et al 2023). Assuming that the vertical and horizontal heat advection averaged over the central Arctic is relatively small, the time-varying mixed layer temperature can be expressed as:
where Tm is mixed-layer temperature, ρw and cp denote density and specific heat of sea water, respectively. hm represents the mixed layer depth (MLD). Figure 3(b) shows the relationship between spring-early summer (from May to July) NSHF and Aug-Sep SSTs averaged over the central Arctic Ocean in historical simulation. The correlation coefficient is quite high, r = 0.88, verifying that the seasonal SST maximum is constrained by spring-early summer NSHF.
In SSP2-4.5 simulation, however, the multi-model relationship between the September SIE and the Aug-Sep SSTs is nonlinear and the correlation coefficient (r = −0.67) is relatively small (figure 3(c)). The central Arctic SSTs rapidly increase in the case when the September SIE is less than 0.2 million km2, which is consistent with figures 1(b) and 2, showing a more pronounced Aug-Sep sea surface warming in the complete ice-free models than in the moderate ice-free models. Moreover, the degree of sea surface warming is widely varying among the complete ice-free models (SIE < 0.2 million km2), as shown in figure 3(c), implying that the September SIE is not a good indicator of the Aug-Sep sea surface warming. Instead, the relationship between the spring-early summer NSHF and the Aug-Sep SST is linear (figure 3(d)) and the correlation coefficient is quite high, r = 0.86.
To better understand the process causing pronounced sea surface warming appearing in several climate models, we divided the complete ice-free models into two groups: one with the Aug-Sep SST higher than 4 °C (warm model group, red dots in figure 4(a)) and the other one with the Aug-Sep SST less than 4 °C (cold model group, blue dots in figure 4(a)). While both groups simulate complete ice-free Arctic (SIE < 0.2 million km2) in September, they show different seasonal cycle of SIE (figure 4(b)). The seasonal SIE of the warm model group is about 30%–70% smaller than that of the cold model group from winter to spring.

Figure 4. (a) Multi-model relationship between September SIE and Aug-Sep SSTs, averaged in the central Arctic Ocean (>74° N) in SSP2-4.5 simulation, where red and blue dots indicate models with Aug-Sep SSTs higher and lower than 4 °C among the 'complete ice-free' models, in which September SIE less than 0.2 million km2. Seasonal cycle of (b) SIE, (c) NSHF, and (d) differences of surface heat fluxes between the warm (red) and cold (blue) model groups: black, green, cyan, and magenta lines indicate total, net shortwave radiation, net longwave radiation, and turbulent heat flux anomalies, respectively. In (b), (c) shadings imply 1.0 standard deviation ranges of multi models. In (c), (d) positive values imply heat fluxes from atmosphere to ocean.
Download figure:
Standard image High-resolution imageIn response to reduced sea ice cover, the seasonal cycle of NSHF is amplified in the warm model group (figure 4(c)). In the warm model group, more heat is absorbed into the central Arctic Ocean from May to July, whereas more heat is released into the atmosphere from November to May. Despite increased heat loss to atmosphere, the increased ocean-to-ice heat fluxes in response to global warming may suppress sea ice growth (Cornish et al
2022). The average difference of downward heat flux between the warm and cold model groups is about 30 W m−2 in May and June, and 3–4 W m−2 in July (figure 4(d)). Observational studies suggest that the Arctic Ocean MLDs are around 35 meters in May and 25 meters in June (Peralta-Ferriz and Woodgate 2015, Zhai and Li 2023). Assuming that the May-June average MLD of the Arctic Ocean is 30 meters, equation (2) indicates that an anomalous downward NSHF of 30 W m−2 for two consecutive months (May-June) can lead to ∼1.5 °C SST difference in summer  . The difference of May–July NSHF between the warmest model (CMCC-CM2-SR5) and the coldest model (CESM2-WACCM) among the models simulating the ice-free summer Arctic is ∼70 W m−2 in May and June, leading to ∼4 °C SST difference in Aug-Sep.
Further analysis indicates that the increased shortwave absorption explains the majority of the increased downward surface heat flux from May to July (green line in figure 4(d)), highlighting the effectiveness of spring ice-albedo feedback associated with preceding winter SIT. In April, the increased downward shortwave radiation associated with less sea ice cover in the warm models is largely compensated by increased turbulent heat fluxes (figure 4(d)). These results suggest that the September SIE is not the best indicator of the Aug-Sep sea surface warming in the central Arctic Ocean. Instead, the degree of SST increase in future climate is more associated with sea ice cover in spring and early summer during which sunlight is strong and sea ice cover can effectively modulate net shortwave radiation (figure 3(d)). Further analysis shows that the interannual correlation between SIE and NSHF in spring–early summer (May–July) is quite high, with r = −0.9 (see figure A3). This result underscores the importance of spring–early summer SIE in modulating the NSHF.
3.4. Relationship between winter SIT and Aug-Sep SST
Because SIT anomalies can strongly affect the seasonal SIE anomalies for many months ahead (Blanchard-Wrigglesworth et al 2011, Ordoñez et al 2018, Bushuk et al 2020), the earlier sea ice retreat may imply relatively thinner sea ice in winter. Figure 5(a) shows the relationship between future winter (from December to March) SIT and NSHF averaged in May–July, in which both SSP2-4.5 and SSP5-8.5 scenario simulations (black vs white dots in figure 5(a)) are lumped together. Here, both SSP2-4.5 and SSP5-8.5 scenario simulations are added to increase the statistical degree of freedom (many of CMIP6 models do not provide SIT as outputs). The inter-model relationship between winter SIT and the May–July NSHF is high: the correlation coefficient is −0.71, verifying that the spring-early summer NSHF is closely tied to winter SIT. In SSP2-4.5, in which 26 models provide SIT as an output variable, the correlation coefficients between winter SIT and spring-early summer NSHF is −0.73.

Figure 5. Multi-model relationship between (a) winter (from December to March) SIT and May–July NSHF as well as between (b) winter SIT and Aug-Sep SSTs, averaged over the central Arctic Ocean in SSP2-4.5 (black dots), and SSP5-8.5 (white dots) simulations. The red solid lines and shadings indicate linear regression fits and 95% confidence intervals, respectively. In (a), (b) positive values imply heat fluxes from atmosphere to ocean.
Download figure:
Standard image High-resolution imageBecause the reduced sea ice cover in spring and early-summer is accompanied by Arctic sea surface warming, the inter-model relationship between winter SIT and the central Arctic SST in Aug-Sep is also linear (figure 5(b)): the correlation coefficient is −0.77. In each scenario simulation, the correlation coefficients between winter SIT and Aug-Sep SST are −0.78 and −0.62 for SSP2-4.5 and SSP5-8.5, respectively. These results are consistent with previous studies indicating that winter SIT can have a significant impact on the subsequent spring and summer Arctic sea ice cover. Specifically, late winter and early spring SIT initializations have been shown to substantially improve seasonal Arctic sea ice cover forecast in ocean-sea ice models, such as HadGEM1.2 (Day et al 2014), CanCM3 (Dirkson et al 2017), and NEMO3.4 (Balan-Sarojini et al 2021). Observational studies also suggest that thinner winter Arctic SIT can lead to a reduction in spring and early summer sea ice cover by lowering surface ice albedo (Nasonova et al 2018, Petty et al 2023).
4. Conclusions
By examining CMIP6 multi-models, this study shows that the future ice-free Arctic is accompanied by diverging SST responses in the central Arctic Ocean, ranging from 0.7 to 8 °C in the SSP2-4.5 scenario. So far, September has been highlighted as a key month assessing the ice-free conditions. However, this study shows the importance of the seasonal duration of the ice-free condition, specifically spring–early summer sea ice cover, which can effectively modulate the Aug-Sep SSTs. In climate models simulating the early retreat of spring sea ice cover, the central Arctic SSTs increase up to 5 °C–8 °C by the end of the 21st century. Such temperature shifts could result in profoundly altered Arctic climate and ecosystems, including a potential ∼50% decrease in thermal habitat (Dahlke et al 2018, Logerwell et al 2022).
Additional analyses show that the central Arctic SST is closely tied to winter SIT. Our findings emphasize the significant role of winter SIT in influencing the central Arctic SSTs in Aug-Sep. However, predicting the exact timing of ice-free Arctic conditions based on current Arctic sea ice conditions, such as SIT remains a formidable challenge (Liu et al 2013, Jahn et al 2016, Sigmond et al 2018, Bonan et al 2021, Diebold and Rudebusch 2022). Another limitation of this study is that the causes of inter-model differences in future SIT are not examined. Small changes in atmospheric circulations (Topál et al 2020, Luo et al 2021) and ocean heat transport (Beer et al 2020, Shu et al 2022) in the Arctic can result in significant variations in sea ice melt rates. Therefore, while studying the seasonal NSHF is valuable (shown in figure 4 of this paper), it has limitations in pinpointing the primary driver behind the inter-model variations in future SIT.
Acknowledgments
The authors thank Alek Petty for helpful comments on an earlier draft of this work. We thank three anonymous reviewers for helpful and constructive comments, which helped us improve the manuscript.
H S P and J S H were supported by the National Research Foundation of Korea (NRF) No. 2020R1A2C2010025. E S C was supported by Korea Polar Research Institute (KOPRI) grant funded by the Ministry of Oceans and Fisheries (KOPRI PE23010).
Data availability statement
The data that support the findings of this study are openly available at the following URL/DOI: https://pcmdi.llnl.gov/CMIP6 and https://esgf-node.llnl.gov/search/cmip6/.
Appendix A:
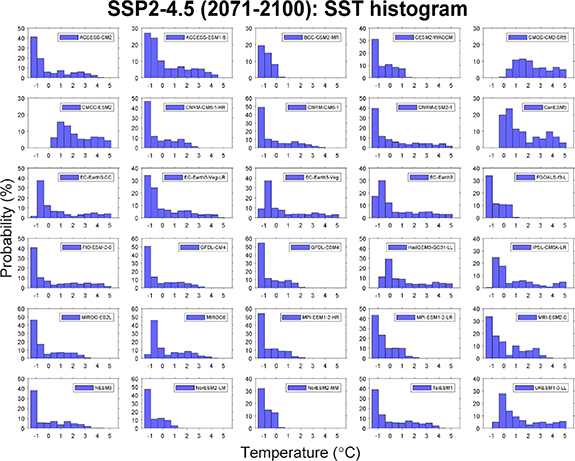
Figure A1. Histogram of monthly-mean, annual (from January to December) SST distribution, averaged in the central Arctic Ocean (>74° N) of each CMIP6 model in SSP2-4.5 simulation.
Download figure:
Standard image High-resolution image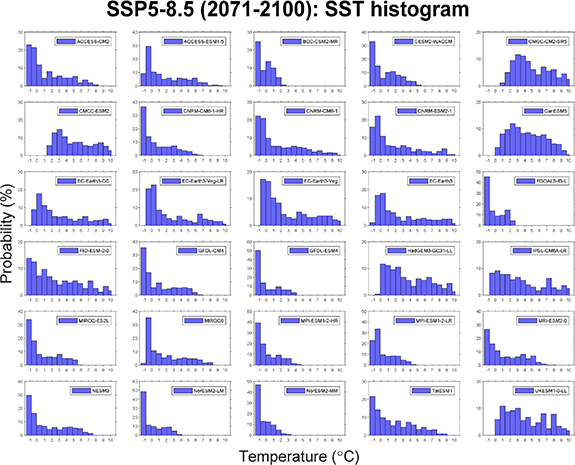
Figure A2. Histogram of monthly-mean, annual (from January to December) SST distribution, averaged in the central Arctic Ocean (>74° N) of each CMIP6 model in SSP5-8.5 simulation.
Download figure:
Standard image High-resolution image
Figure A3. Multi-model relationship between May–July SIE and May–July NSHF averaged in the central Arctic Ocean (>74° N) in SSP2-4.5 simulations. The vertical dashed line indicates 1.0 million km2 SIE, which is the threshold for the ice-free Arctic. The red solid line and shading indicates linear regression fit and 95% confidence interval, respectively. Positive values imply heat fluxes from atmosphere to ocean.
Download figure:
Standard image High-resolution image
Appendix B:
Table B1. The list of CMIP6 models.
| Model | Model expanded name | Institute |
|---|---|---|
| ACCESS-CM2 | Australian community climate and earth system simulator climate model, version 2 | Commonwealth Scientific and Industrial Research Organisation—Australian Research Council Centre of Excellence for Climate System Science (CSIRO—ARCCSS), Australia |
| ACCESS-ESM1.5 | Australian community climate and earth system simulator earth system model, version 1.5 | CSIRO, Australia |
| BCC-CSM 2 MR | Beijing climate centre, climate system model, version 2 (MR) | Beijing climate centre (BCC), China |
| CanESM5 | Canadian earth system model, version 5 | Canadian centre for climate modelling and analysis (CCCma), Canada |
| CESM2-WACCM | CESM2—whole atmosphere community climate model | NCAR, US |
| CMCC-CM2-SR5 | CMCC climate model, version 2 (SR5) | Centro euro-mediterraneo per I cambiamenti climatici (CMCC), Italy |
| CMCC-ESM2 | CMCC earth system model, version 2 | CMCC, Italy |
| CNRM-CM6-1 | CNRM-CM6-1 | Centre national de recherches meteorologiques—centre Europeen de Recherche et de formation avancee en calcul scientifique (CNRM-CERFACS), France |
| CNRM-CM6-1-HR | CNRM-CM6-1-HR | CNRM-CERFACS, France |
| CNRM-ESM2-1 | CNRM-ESM2-1 | CNRM-CERFACS, France |
| EC-Earth3 | European community earth system model, version 3 | EC-Earth-Consortium |
| EC-Earth3-CC | EC-Earth3-carbon cycle | EC-Earth-Consortium |
| EC-Earth3-Veg | EC-Earth3-vegetation | EC-Earth-Consortium |
| EC-Earth3-Veg-LR | EC-Earth3-vegetation low resolution | EC-Earth-Consortium |
| FGOALS-f3-L | Flexible global Ocean—atmosphere—land system model, version 3 (L) | CAS, China |
| FIO-ESM 2.0 | First institute of oceanography earth system model, version 2.0 | First institute of oceanography—qingdao national laboratory for marine science and technology (FIO-QLNM), China |
| GFDL-CM4 | Geophysical fluid dynamics laboratory global climate model, version 4 | National oceanic and atmospheric administration, geophysical fluid dynamics laboratory (NOAA-GFDL), US |
| GFDL-ESM4 | Geophysical fluid dynamics Laboratory earth system model, version 4 | NOAA-GFDL, US |
| HadGEM3-GC31-LL | Hadley centre global environment model in global coupled configuration 3.1 (LL) | Met office hadley centre (MOHC), UK |
| IPSL-CM6A-LR | Institut pierre simon laplace climate model, version 6 (LR) | Institut pierre simon laplace (IPSL), France |
| MIROC6 | Model for interdisciplinary research on climate, version 6 | Japan agency for marine-earth science and technology (JAMSTEC) atmosphere and Ocean research institute (AORI), national institute for environmental studies (NIES), RIKEN centre for computational science (R-CCS), Japan |
| MIROC-ES2L | Model for interdisciplinary research on climate earth system, version 2 (L) | JAMSTEC, AORI, NIES, R-CCS, Japan |
| MPI-ESM1.2-HR | Max plank institute—earth system model, version 1.2 (HR) | Max planck institute for meteorology (MPI-M), Germany |
| MPI-ESM1.2-LR | Max plank institute—earth system model, version 1.2 (LR) | MPI-M, Germany |
| MRI-ESM2.0 | Meteorological research institute earth system model, version 2 | Meteorological research institute (MRI), Japan |
| NESM v3 | NUIST Earth System Model, version 3 | Nanjing University of information Science and technology (NUIST), China |
| NorESM2-LM | Norwegian earth system model, version 2 (LM) | Norwegian climate centre (NCC), Norway |
| NorESM2-MM | Norwegian earth system model, version 2 (MM) | NCC, Norway |
| UKESM1.0-LL | U.K. earth system model, version 1.0 (LL) | MOHC, UK |
| TaiESM1 | Taiwan earth system model, version 1 | AS-RCEC, Taiwan |