


Abstract
Earth Observation data are uniquely positioned to estimate forest aboveground biomass density (AGBD) in accordance with the United Nations Framework Convention on Climate Change (UNFCCC) principles of 'transparency, accuracy, completeness, consistency and comparability'. However, the use of space-based AGBD maps for national-level reporting to the UNFCCC is nearly non-existent as of 2023, the end of the first global stocktake (GST). We conduct an evidence-based comparison of AGBD estimates from the NASA Global Ecosystem Dynamics Investigation and ESA Climate Change Initiative, describing differences between the products and National Forest Inventories (NFIs), and suggesting how science teams must align efforts to inform the next GST. Between the products, in the tropics, the largest differences in estimated AGBD are primarily in the Congolese lowlands and east/southeast Asia. Where NFI data were acquired (Peru, Mexico, Lao PDR and 30 regions of Spain), both products show strong correlation to NFI-estimated AGBD, with no systematic deviations. The AGBD-richest stratum of these, the Peruvian Amazon, is accurately estimated in both. These results are remarkably promising, and to support the operational use of AGB map products for policy reporting, we describe targeted ways to align products with Intergovernmental Panel on Climate Change (IPCC) guidelines. We recommend moving towards consistent statistical terminology, and aligning on a rigorous framework for uncertainty estimation, supported by the provision of open-science codes for large-area assessments that comprehensively report uncertainty. Further, we suggest the provision of objective and open-source guidance to integrate NFIs with multiple AGBD products, aiming to enhance the precision of national estimates. Finally, we describe and encourage the release of user-friendly product documentation, with tools that produce AGBD estimates directly applicable to the IPCC guideline methodologies. With these steps, space agencies can convey a comparable, reliable and consistent message on global biomass estimates to have actionable policy impact.
Export citation and abstract BibTeX RIS

Original content from this work may be used under the terms of the Creative Commons Attribution 4.0 license. Any further distribution of this work must maintain attribution to the author(s) and the title of the work, journal citation and DOI.
1. Introduction
The estimation of forest biomass is well recognized as a crucial component in addressing climate change by scientists, policymakers, investors and society at large. Earth observation (EO) has shown potential to aid this effort; it has helped to produce numerous map-based aboveground woody live biomass density (AGBD) estimates, each produced using a variety of data acquired from spaceborne instruments and methods ranging from spatial modeling to artificial intelligence (Rodriguez-Veiga et al 2017), and distributed publicly on open-science principles. Broadly, such maps have supported decades of research on carbon cycle and climate modeling, biodiversity assessments, ecosystem management and land-use planning (e.g. Ross et al 2021, Harper et al 2023). Amongst the various space-borne sensors used in AGBD estimation, NASA's Global Ecosystem Dynamics Investigation (GEDI) was specifically optimized to retrieve vegetation vertical structure, and launched to the International Space Station in 2018 to fill knowledge and data gaps in forest AGBD (Dubayah et al 2020). The upcoming launches of ESA's BIOMASS, the NASA-ISRO Synthetic Aperture Radar (SAR), the Advanced Land Observing Satellite-4 (ALOS-4), and a suite of other sensors, will support regular global forest monitoring to develop targeted emission mitigation strategies (Quegan et al 2019, Ochiai et al 2023).
The rapidly advancing science of forest biomass mapping is, however, challenged when map-based AGBD estimates and their underlying methods are inter-compared. Several studies have highlighted global, continental and local-scale differences in estimates (e.g. Mitchard et al 2013, Avitabile et al 2016) and systematic deviations from ground reference data (e.g. Araza et al 2022), although independent validation remains a challenge due to the paucity of globally-distributed samples of in situ data (Duncanson et al 2019). Large differences exist not only between the map AGBD estimates, but also in the analytical frameworks used to estimate uncertainties, their underlying scope, definitions, assumptions and level of transparency. The lack of consistency amongst AGBD maps is a cause of confusion, and hinders objective comparisons and uptake of maps for policy-level reporting in line with the Intergovernmental Panel on Climate Change (IPCC) Guidelines for National Greenhouse Gas Inventories (IPCC 2006, 2019). For example, a compilation of 75 submissions to the United Nations Framework Convention on Climate Change (UNFCCC) reveals that not only do a mere 5% of countries use such AGBD maps, they use decade-old versions (i.e. Saatchi et al 2011 and (Baccini et al 2012)) only to compare estimates or support national-level decision-making (Melo et al 2023), rather than to directly and independently estimate AGBD.
To assess the world's collective progress towards emissions reductions, the first Global Stocktake (GST) under the Paris Agreement of the UNFCCC is underway (UNFCCC 2023a, 2023b), with updates expected at 5 year intervals. The aggregation of national greenhouse gas inventories (NGHGIs), which all country-Parties to the Paris Agreement will submit biennially from 2024 forward on, will be the main source of information in the collective assessment of the next GST cycles. Countries should facilitate 'transparency, accuracy, completeness, consistency and comparability' of reported statistics, particularly from time-series (IPCC 2006, 2019). Although satellite data are well-positioned to aid policy under these principles, if the many approaches to AGBD estimation are not harmonized, map producers risk delivering discrepant estimates and ambiguous information to the public. Particularly as maps from the New Space commercial sector (Ochiai et al 2023) enter the market, any conflicting estimates of forest AGBD will be detrimental to their use for climate change mitigation. Without harmonization, it will be impossible to reliably quantify the progress of mitigation actions or the effective role of forests in achieving the goals of the Paris Agreement.
The operational uses of space-based AGBD maps for national assessments are few or entirely non-existent (GFOI 2020, Melo et al 2023). This fundamental data-policy gap has been a catalyst for action amongst scientists in internationally coordinated teams, such as the Committee on Earth Observing Satellites (CEOS), towards collaboration on harmonizing the generation and validation of published AGBD maps (Herold et al 2019, Ochiai et al 2023). It has facilitated an open exchange of data and information, resulting in the publication of key guidance. For example, the CEOS Biomass Validation Protocol (Duncanson et al 2021) recommends approaches for validating AGBD map estimates with in situ reference data, accounting for uncertainties, forest definitions and plot-pixel size mismatches. Labriére et al (2023) calls for the design and maintenance of a permanent in situ 'forest biomass reference measurement' system to independently validate maps and estimate their uncertainty. With regard to model-based inference from AGBD maps, McRoberts et al (2022) demonstrates a statistically rigorous method to account for model prediction variability and residual variability, and their contribution to overall standard error (SE). Finally, on practical policy-relevant applications, Næ sset et al (2020) and Málaga et al (2022) demonstrate the use of global AGBD maps to increase the precision of sub-national estimates. Leading on from this research, an important contribution to the CEOS Biomass Harmonization activity (NASA 2021) is the inter-comparison of current published AGBD maps, and transparent communication of the differences both between the maps, and between the maps and ground-reference data.
In this article, we report on the inter-comparison for two of the newest (as of 2023) released space-based AGBD maps—NASA's GEDI-derived AGBD product (Healey et al 2022) and the ESA's Climate Change Initiative (CCI) 2020 version 4 AGBD product (Santoro et al 2023a). The research objectives are (1) to identify geographical regions over which the maps agree and disagree, (2) compare their sub-national estimates with those of National Forest Inventories (NFIs) for a selection of countries, (3) comparatively assess the uncertainty estimation frameworks and limitations (if any) in the products' underlying models, and (4) discuss if and how the maps, and product documentation, can be improved to align with policy guidance. In doing so, we address whether the maps currently provide sufficient information to inform the GST. We conclude with a concrete set of actions that can be taken by the science-teams to improve the dissemination of AGBD maps for policy.
2. Materials and methods
The methodological approach involves the inter-comparison of AGBD estimates from maps, and comparisons to NFI estimates (figure 1), upon which we provide recommendations for aligning the products with policy guidance.
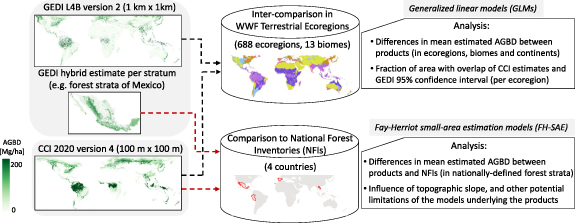
Figure 1. Methodological workflow for the comparison of NASA's GEDI-derived and ESA's Climate Change Initiative (CCI) 2020 version 4 aboveground biomass density (AGBD) products.
Download figure:
Standard image High-resolution image2.1. Inter-comparison of AGBD maps
The two products compared in this study, i.e. GEDI and CCI estimates of AGBD, are produced independently using different approaches. Fundamentally, the GEDI approach is based on regression models and in situ reference data, and the CCI on both regression and simplified semi-empirical models, and various national/sub-national reports of AGBD (see table 1). Below, we state some of the common challenges relevant to AGBD estimation.
- 1.The GEDI products are estimates derived at the footprint-level from waveform light detection and ranging (LiDAR), covering tropical and temperate forests between 51.6∘ latitude N & S, which are used to extract information on canopy height and 3D structure (Dubayah et al 2020). GEDI relative height (RH) metrics have shown high consistency with forest structure (e.g. Adrah et al 2021, Liu et al 2021, Li et al 2023), although the over/under-estimation of ground elevation over seasonally flooded waters, or in complex topography, can hinder the extraction of these metrics (Urbazaev et al 2022, Bruening et al 2023). The GEDI L4B version 2, which is an AGBD estimate over 1 km × 1 km grid cells, has gaps owing to limited spatial coverage up until 2021.
- 2.The CCI product is at a wall-to-wall global scale, produced using a variety of sensors, particularly imaging sensors of SAR. It relies primarily on the inversion of the semi-empirical water cloud model (WCM) (Askne et al 1997), relating AGBD (as a covariate) to SAR backscatter (as a response variable) (Santoro et al 2023a). Backscatter is known to be sensitive to surface moisture and prone to signal attenuation (Joshi et al 2017). To prevent the prediction of unrealistic AGBD values, multiple steps are taken; these involve (1) weighting stacks of multi-temporal SAR images (Santoro et al 2021), (2) constraining model parameters to a theoretical model of signal attenuation, number of observations and topography (Santoro et al 2021), and (3) constraining spaceborne-LiDAR height estimates, and AGBD estimates, to maxima based on height distributions and various literature across global regions (Santoro et al 2022).
Table 1. Summary of the NASA Global Ecosystem Dynamics Investigation (GEDI) and ESA Climate Change Initiative (CCI) 2020 Biomass map products. Product Algorithm Theoretical Basis Documents are available at Healey et al (2022) and Santoro et al (2023a).
| GEDI hybrid product | CCI 2020 version 4 | |
|---|---|---|
| Input type | LiDAR | LiDAR and SAR |
| Mission | GEDI | ALOS-2, Sentinel-1, ICESat and ICESat-2 |
| Years | 2019–2021 | 2020 |
| Area or pixel size | Arbitrary or gridded (e.g. 1 km × 1 km) | ∼100 m × 100 m at equator |
| Domain |
 51.6∘ lat 51.6∘ lat | Global |
| Source of AGBD reference data | Compilation of globally distributed in situ plots with coincident airborne LiDAR (Duncanson et al 2022) | National/sub-national AGBD estimates, acquired from published NFI reports or FAO Forest Resource Assessments (FAO 2020). |
| Method |
|
|
| Data masks | Urban areas, open water-bodies and vegetation phenology from a set of external land cover data sources. | Cropland, urban areas, bare soil, permanent snow and ice, and water bodies from a set of external land cover data sources. |
| Precision of estimated AGBD | The standard error (SE) is reported per arbitrary region or per grid cell. Estimation is based on statistical sampling theory; the algorithm uses hybrid inference accounting for model parameter variability (i.e. in the covariance of the field-to-LiDAR L4A models) and sampling variability (e.g. the variation of AGBD means in GEDI tracks). Model residual errors are considered comparatively negligible at scales of 1 km grid-cells or larger (Patterson et al 2019). | The standard deviation (SD) is reported per 100 m pixel, or spatially aggregated to coarser resolutions. Estimation is based on the variance in numerous inputs to the many sequential regression or semi-empirical models in the algorithm. Specifically, the variance in model parameters and covariates, and residual errors, are accounted for. The variance in input AGBD training values from the public reports, however, is not accounted for Santoro et al (2023b). |
Before inter-comparing the products, a clarification of the terminology used for products' uncertainties (i.e. their precision and systematic errors) is warranted; precision is the 'variability around an estimated value' (i.e. the spread of its confidence interval (CI)), systematic error is the 'degree to which the estimated value deviates from the true population value', and negligible or non-existent systematic errors are an indication of accurate estimates Duncanson et al (2021), ch 4.
Crucially, the two products use different analytical frameworks to describe and estimate precision (table 1). As a product based solely on discrete samples, hybrid inference is used to estimate the SE of AGBD in each 1 km × 1 km grid cell of the GEDI L4B product, and over larger arbitrary-sized regions. The hybrid estimate combines (1) sampling variability (i.e. the variability among the GEDI tracks, each consisting of shots with predicted AGBD) and (2) model parameter variability (i.e. the uncertainty in the parameter estimates used to predict AGBD in the 25 m footprint-level L4A models). Residuals of the models (i.e. differences between observed and predicted AGBD) are comparatively negligible (relative to the sampling and model components) when aggregated over 1 km or larger cells/areas, and hence are not included in variance estimates (Patterson et al 2019, Dubayah et al 2022b). In contrast, the CCI product, on account of the suite of input data, is described by a number of regression and semi-empirical models that sequentially include estimates, whose errors arise from preceding models and propagate to subsequent models (Santoro et al 2021, 2023b). The variance of final AGBD predictions incorporates (1) the variance in all models' parameter estimates and in some covariates and response variables, and (2) model residual errors. However, the challenge in a comprehensive one-to-one comparison with GEDI products arises from differing statistical terminology with a lack of explicitly reported model results. The sampling variance, i.e. the variance associated with national/sub-national AGBD estimates in the various reports contributing to the compiled reference dataset (see table 1), is not rigorously assessed, primarily due differences in reporting protocols and incomplete information in the source documents. Hence, overall, the same components of variance in the final estimated AGBD, as those of the GEDI product, are not captured in the CCI product.
The above-mentioned differences imply that the products' reported precisions are not directly comparable. At the very best, the products can be compared to in situ data and the overlap of their prediction CIs, insofar as they are rigorously estimated and reported, can be investigated. To avoid erroneous inference in this study, the CCI product is treated as point estimates at pixel-level with unknown CIs, and the need for aligned analytical frameworks discussed in section 4.
For the purpose of map inter-comparison, the WWF Terrestrial Ecoregions of the World (TEOW), which defines lands 'containing distinct assemblages of natural communities and species' (Olson et al 2001), is used to delineate the 688 ecoregions grouped in 13 biomes across the GEDI range of observation. For these ecoregions, the CCI and GEDI L4B product (i.e. the 1 km gridded hybrid estimate), with GEDI's reported precision, are compared as follows:
- 1.At the ecoregion-level, the mean estimated AGBD from each product is compared to identify if, where, and by how much the products differ. The values are also aggregated by continent and TEOW biomes (each containing a variety of ecoregions), to test whether systematic differences (if any) are driven by geographical location or climate zones.
- 2.At the 1 km grid level, the 95% CI (i.e.
 SE) for each cell is estimated in the GEDI product to test if the mean CCI AGBD is contained within its range. Then, for each ecoregion, the fraction of pixels where this difference is non-significant, i.e. CCI falls within the GEDI 95% CI, is recorded. This exercise is not a validation of either product and the assumptions made here are important to note - (1) for GEDI, the hybrid estimator of mean AGBD and variance is unbiased (Patterson et al
2019), and violations of the assumptions of the estimator can be identified by systematic deviations to ground-truth data (Dubayah et al
2022b), and (2) for CCI, we assume the estimator of the mean is unbiased, until the contrary is proven with ground-truth data.
SE) for each cell is estimated in the GEDI product to test if the mean CCI AGBD is contained within its range. Then, for each ecoregion, the fraction of pixels where this difference is non-significant, i.e. CCI falls within the GEDI 95% CI, is recorded. This exercise is not a validation of either product and the assumptions made here are important to note - (1) for GEDI, the hybrid estimator of mean AGBD and variance is unbiased (Patterson et al
2019), and violations of the assumptions of the estimator can be identified by systematic deviations to ground-truth data (Dubayah et al
2022b), and (2) for CCI, we assume the estimator of the mean is unbiased, until the contrary is proven with ground-truth data.

Neither of the two approaches informs on products' accuracies. The first reveals if, by how much, and where the products differ most. The second reveals if the AGBD estimates reported in one have CIs that contain the AGBD estimates of the other; areas with very precise GEDI hybrid estimates (narrow CIs), but large differences between the maps, are likely to most require independent reference data to assess accuracy. Further, areas with imprecise estimates (wide CIs) and large differences between the maps are likely to most benefit from reference plots to improve model calibration. Statistical inference for the above is based on generalized linear models (GLMs).
2.2. Comparisons with NFIs
Across four countries—Mexico, Peru, Lao People's Democratic Republic (Lao PDR) and Spain—NFIs were compiled to compare against the AGBD map estimates (table 2). The developing countries, where reporting to UNFCCC is infrequent or incomplete (Grassi et al 2022, Melo et al 2023), could benefit from regular biomass assessments while transitioning to more stringent requirements of the Paris Agreement (UNFCCC 2019). Spain was chosen for two reasons: (1) Spain's NFI covers diverse ecosystems from Atlantic forests and fast-growing plantations in the North, to the Pyrenees mountains and sparse vegetation in Central Spain and the Canary Islands, and (2) it is a country where there are few differences between the CCI and GEDI estimates of AGBD, and where an advanced, systematically-designed, and dense NFI plot network allows sub-national comparisons. These exercises serve only as a means to comparatively assess the performance of products; the use of NFI reports to calibrate the CCI models (see table 1), although without plot-level data, precludes independent product validation with NFIs.
Table 2. Summary of the national forest inventory (NFI) data analyzed. The sample size indicates the number of plots/sub-plots visited on the field, based on each country's sampling design. The designs, and the equations of the statistical estimators, are detailed in supplementary information, section 2.
| Country | Sample size | NFI cycle (years) | No. of forest strata | Sampling design | Statistical estimator |
|---|---|---|---|---|---|
| Mexico | 9955 | 3 cycle (2015 to 2019) cycle (2015 to 2019) | 11 | Systematic grids of  km for temperate/tropical forests, km for temperate/tropical forests,  km for semi-arid, and km for semi-arid, and  km for arid areas, with 1-ha plots consisting of four sub-plots of ∼11 m radius (CONAFOR 2017) km for arid areas, with 1-ha plots consisting of four sub-plots of ∼11 m radius (CONAFOR 2017) | Simple expansion estimator |
| Peru | 358 | Ongoing (2011 to date) | 5 | Non-aligned systematic sampling, with plots located randomly within grid-cells of varying sizes (SERFOR 2019) | Nationally-defined estimators |
| 30 Spanish regions/ provinces | 39 534 | 4th cycle (2008 to 2019) | 2 | Systematic 1 km grid, with sample units of four circular concentric plots of radius 5, 10, 15, and 25 m (Álvarez-González et al 2014) | Simple expansion estimator |
| Lao PDR | 1394 secondary sampling units (SSUs) | 3 cycle (2019) cycle (2019) | 5 | Two-stage stratified random sampling; primary sampling units (PSUs) were 3 km wide squares, and 4 circular plots (SSUs) of 20 m radius were chosen within selected PSUs (DOF 2019) | Two-stage estimator for unequal areas of strata within PSUs |
Comparisons to NFIs follow the CEOS Biomass Validation Protocol (Duncanson et al 2021), wherein the mean, SE and 95% CI of AGBD are estimated over each nationally-defined forest stratum, with forest/non-forest masks. The estimates are compared to the mean estimated CCI AGBD or GEDI hybrid AGBD (i.e. a single AGBD and variance estimate for each arbitrary-sized forest stratum). Since GEDI's hybrid inference framework provides the precision of AGBD estimates, deviations from reference data can be assessed in a fully probabilistic manner. The CCI product does not have a comparable framework for large-area assessments, and only the mean stratum-wise AGBD estimate is examined.
Statistical inference is based on Fay–Herriot small area estimation (FH-SAE) models (Fay III and Herriot 1979, Rao and Molina 2015). FH-SAE models account for sampling error in the response variable, the stratum population estimates, and infer the relationships between the true (but unknown) population means and model covariates. Here, 'sampling error' refers to random variation in the NFI estimates due to finite within-stratum samples, and for the map-products, finite AGBD training data. Accounting for such variation allows inference on underlying systematic deviations, while filtering random deviations occurring simply due to finite sampling. Specifically, we assume

where  is the given stratum population estimate, y is the unknown expected value of this estimate, and δ is the sampling error. Error δ is assumed to have zero mean and known variance, where the variances are inherited from the associated product- or NFI-estimated AGBD (note, CCI's contribution to δ is omitted by necessity). The difference in the product and NFI estimates is set to
  , and y is the expected value of this difference upon infinite re-sampling. We further assume the regression model

where x is a model covariate,  are regression coefficients, and ε is model prediction error, giving the remaining variation between the unknown expected value, y, and the regression line. We can also entirely omit covariate effect
  , leaving only the intercept α and model prediction error, creating a null model where α represents the expected difference in estimates across all forest strata (supplementary information, section 1). Code for the FH-SAE models is available at Hunka et al (2023).
The estimation of mean AGBD and associated variance from NFIs (inputs to the FH-SAE models) required different approaches in the four countries. For Peru, estimates were provided directly by the Servicio Nacional Forestal y de Fauna Silvestre (SERFOR 2023) for five strata from the Amazonian lowlands to coastal areas. For the other countries, estimators were developed taking into consideration their NFI sample designs. Plot/sub-plot AGBD estimates were acquired in Mexico and Spain, where one can assume equal probability systematic sampling designs, and use simple expansion estimators (supplementary information, section 2a). In the Lao PDR, tree-level information and a land strata map were provided by the Department of Forestry (DOF 2019). The mean AGBD and variance estimates required consideration of two-stage sampling accounting for the occurrence of various forest types (e.g. mixed broadleaves, conifers, dry deciduous forests etc) in each map-delineated stratum. A two-stage estimator of Lohr (2010), equations (5.26) and (5.28) was applied (supplementary information, section 2b). Hence, stratum-wise mean AGBD and variance are not to be compared with nationally-reported forest-type estimates in the Lao PDR.
3. Results
3.1. Inter-comparison of CCI and GEDI AGBD
Globally, averaged over ecoregions, the differences in estimated means of AGBD from the CCI and GEDI products range largely between −50 and +25 Mg ha−1 (the 10th to 90th percentile) and show a geographic pattern (figure 2(a)); they are largest in the tropical-subtropical moist broadleaf biomes, where CCI predicts greater AGBD than the GEDI product, and in tropical-subtropical conifers, where CCI predicts less than GEDI. By continent, systematic and significant differences are found, e.g. the CCI product is found to systematically predict more AGBD in nearly all biomes in South America (GLM, p
 0.05, supplementary information, section 3). In contrast, large parts of east Asia (e.g. southern China) and southeast Asia show systematically less AGBD across biomes including temperate and tropical forests, in the CCI product (GLM, p
 0.05).

Figure 2. (a) Difference in estimated aboveground biomass density (AGBD) between ESA CCI and NASA GEDI, averaged across WWF Terrestrial Ecoregions of the World (TEOW). Histograms show distribution of differences (in Mg/ha) in 1 km × 1 km grid cells per continent. Significant differences found in generalized linear models (GLMs) are indicated with *p
 0.05. (b) The fraction of 1 km grid cells where the CCI estimate falls within the GEDI 95% confidence interval (CI), in each ecoregion. Histograms show distribution of GEDI standard errors (as percentage of mean estimated AGBD) in 1 km grid cells in selected ecoregions. For visualization purposes, desert ecoregions are greyed-out. No external forest/non-forest masks are used, other than those inherent in the products (see table 1).
Download figure:
Standard image High-resolution imageDespite the differences in the products across the tropical belt, the CCI product's estimates fall within the reported 95% CI of GEDI's hybrid estimates across many tropical ecoregions. This is true in the tropics of South America and Southeast Asia, where in some ecoregions up to 50% of cells have an overlap of AGBD estimates (figure 2(b)). In contrast, AGBD differences over the Congolese moist broadleaves in Africa are large, GEDI 95% CIs are relatively narrow, and the estimates overlap in only ∼20 of cells. Disagreements are also observed in temperate biomes of South America and Indochina (i.e. the continental region of southeast Asia), highlighting particularly mismatched ecoregions. Finally, the low fraction of overlap of CCI estimates with GEDI 95% CIs in the African woodlands/savanna/grasslands, central Asia and northern Australia are noted, although these areas generally have low absolute differences in estimated AGBD (∼20 Mg ha−1) between the two products (figure 2(a)).
3.2. Comparison with NFI estimates
Unlike the product inter-comparison, comparisons of map-estimated and NFI-estimated AGBD provide a basis to assess the relative performance of the products (note, since stratum-wise variance in CCI estimates are omitted, its results must be interpreted with caution). Overall, the relation between stratum-wise mean estimated AGBD of the maps and NFIs is found to be strong for both products (figure 3); the trend from high to low AGBD estimates is largely captured across all strata in the four countries combined, with no significant under- or over-prediction in either product (p
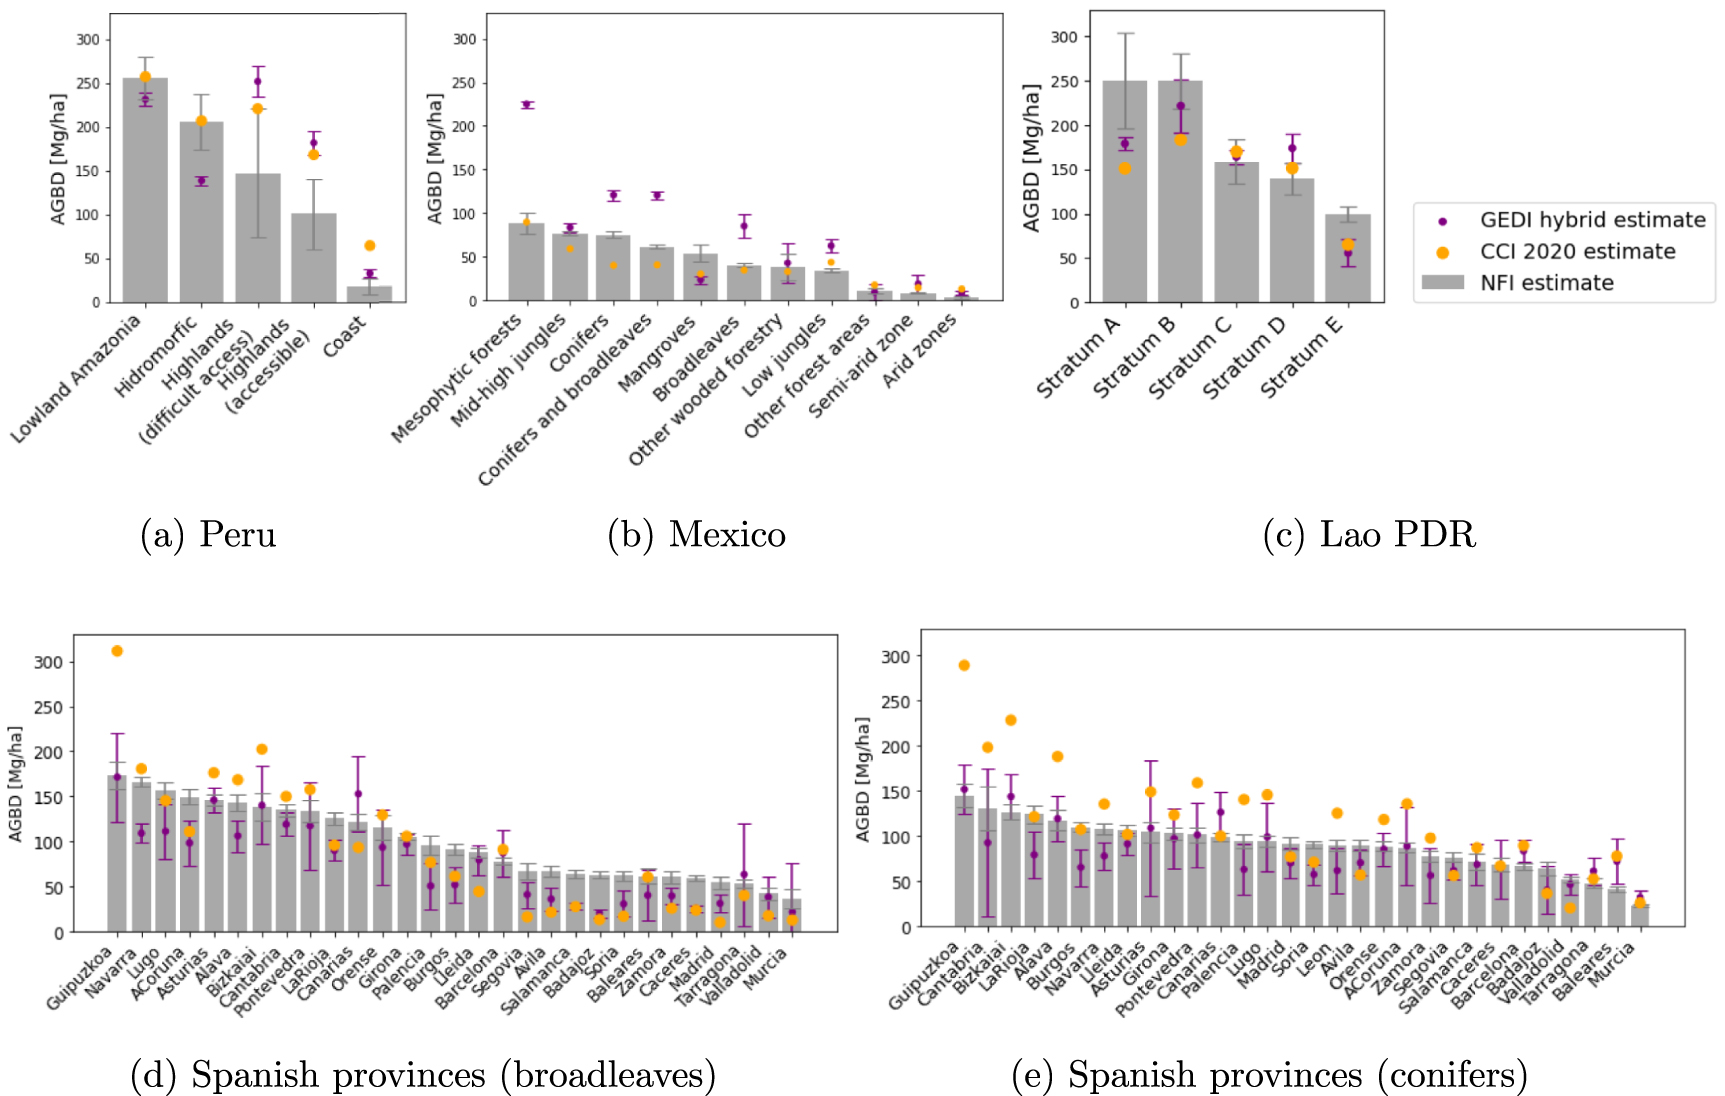
 0.05, null FH-SAE models (1) and (3), table 3). In over half the forest strata (47 of 80), either one or both products are accurate, i.e. they overlap the 95% CIs of NFI-estimated AGBD (figure 4). Note, this fraction may have been larger if the 95% CIs of estimated AGBD were assessed for CCI. In the Peruvian Amazon, which is the AGBD-richest stratum with largest area, both products perform particularly well. Stratum-specific deviations, however, remain problematic for operational use of the products for national reporting. In the following, we examine their possible causes more closely.
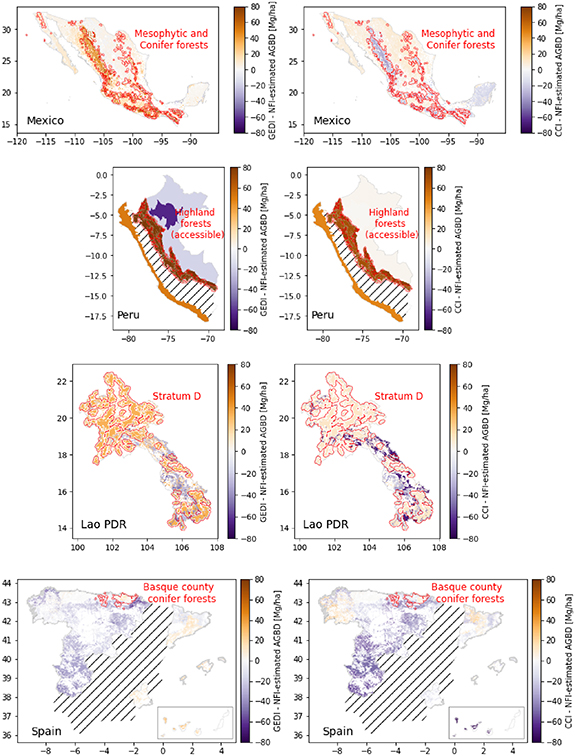
Figure 3. Stratum-wise differences in NFI-estimated and product-estimated aboveground biomass density (AGBD) in Mexico, Peru, Lao PDR and 30 regions/provinces of Spain (Canary Islands are shown in lower right). Strata discussed in section 3 are outlined in red (with 0.3–0.5∘ distance buffer). Regions with forests for which NFI data were unavailable are marked-out with lines.
Download figure:
Standard image High-resolution image
Figure 4. A comparison of aboveground biomass density (AGBD) estimated in National Forest Inventories (NFIs), and in ESA's CCI 2020 and NASA's GEDI hybrid product, over strata in Mexico, Peru, Lao PDR and 30 provinces/regions of Spain (broadleaves and conifers individually). Error bars denote the 95 confidence interval (CI) of estimated AGBD. The CCI values are reported as point estimates without CIs.
Download figure:
Standard image High-resolution imageTable 3. Results of FH-SAE models (equation (2)) relating stratum-wise product- and NFI-estimated AGBD. The null models have a single response variable equal to the difference of the estimates, and no covariate effects.  values can be interpreted as the fraction of variation in this difference, omitting sampling error, explained by Slope90p (i.e. the 90th percentile of SRTM slopes mapped at a 1 km). Parameter
  is the estimated variance of the model prediction error and SE is the standard error the coefficient estimate.
| FH-SAE Model | Coefficient | Estimate | SE | t-value | p-value |

|

| |
|---|---|---|---|---|---|---|---|---|
| (1) | GEDI − NFI ∼ null |
 (Intercept)
| 0.36 | 5.81 | 0.06 | 0.95 | 396.77 | NA |
| (2) | GEDI − NFI ∼ Slope90p |
 (Intercept)
| −48.54 | 9.39 | −5.17 | 2.00 | 20.28 | 0.95 |
 (slope) (slope) | 3.15 | 0.52 | 6.07 | 4.34
| ||||
| (3) | CCI − NFI ∼ null |
 (Intercept)
| 9.33 | 5.2 | 1.79 | 0.08 | 247.27 | NA |
| (4) | CCI − NFI ∼ Slope90p |
 (Intercept)
| −23.36 | 10.02 | −2.33 | 1.98 | 67.55 | 0.73 |
 (slope) (slope) | 2.34 | 0.57 | 4.09 | 1.06
|
3.2.1. Estimates in mountainous forest strata
Over mountains (e.g. mesophytic and conifer forests of Mexico, and highlands in Peru and Lao PDR), AGBD is over-predicted in the GEDI hybrid product. Topographic slope (here, the within-stratum distribution of Shuttle Radar Topography Mission (SRTM, averaged to 1 km) slopes (NASA 2013)) was tested as a covariate to explain the differences in stratum-wise mean GEDI and NFI AGBD estimates. FH-SAE models reveal that the 90th percentile of slope distribution in each stratum can largely explain these differences, while filtering sampling error (p
 0.01 on
  -slope, FH-SAE model (2), table 3). This observation is a subject of ongoing research (e.g. Bruening et al
2023); signal processing errors caused by multi-modal LiDAR waveforms over complex terrain, or mis-identification of waveform noise as ground/canopy signal, can cause underestimation of ground elevation and/or overestimation of canopy height. This can lead to high values of RH metrics (e.g. RH98 in Mexico, figure 5(a), that in turn result in an over-estimation of L4A 25-m footprint AGBD and the subsequent over-estimation in the GEDI hybrid product. A significant (p
-slope, FH-SAE model (2), table 3). This observation is a subject of ongoing research (e.g. Bruening et al
2023); signal processing errors caused by multi-modal LiDAR waveforms over complex terrain, or mis-identification of waveform noise as ground/canopy signal, can cause underestimation of ground elevation and/or overestimation of canopy height. This can lead to high values of RH metrics (e.g. RH98 in Mexico, figure 5(a), that in turn result in an over-estimation of L4A 25-m footprint AGBD and the subsequent over-estimation in the GEDI hybrid product. A significant (p
 0.01 on
  -slope, FH-SAE model (4), table 3) influence of topographic slope is also noted when relating the CCI to NFI estimates. However, constraining spaceborne LiDAR height metrics to maxima in the CCI algorithm challenges conclusive interpretations of the FH-SAE model results.
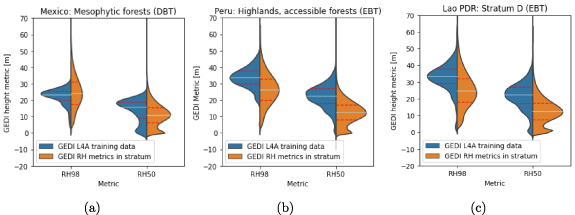
Figure 5. Kernel density estimates of GEDI Relative Height metrics (RH98 and RH50) used in the training of the GEDI L4A models, and of the metrics typically observed in (a) Mexican mesophytic forests, (b) Peruvian highlands, and (c) Lao stratum D (dominated by mountainous mixed deciduous forests). Data quartiles are shown within the distributions (median = light blue, range = red). Dominant plant functional types (PFTs) used in the GEDI L4A models are deciduous broadleaf trees (DBTs) or evergreen broadleaf trees (EBTs), indicated in plot titles.
Download figure:
Standard image High-resolution image3.2.2. Limitations of the underlying models
To further understand the source of deviations from NFIs, the training data and global strata underpinning product estimates were examined (table 1). An example for GEDI is demonstrated; RH metrics (i.e. RH98 and RH50) in the Peruvian highlands are generally lower than those used in training the L4A models (figure 5(b)), suggesting that the latter may not be representative of highland forests. The broad strata of plant functional types (PFTs) in the L4A models label Peruvian mountainous forests as evergreen broadleaf trees (EBTs), implying that the same model is applied in the highlands as for the moist Amazonian basin. Estimated model parameters evidently capture the allometry better in AGBD-rich lowlands than in the comparatively lower-AGBD highlands. A problem is also observed in Stratum D in the Lao PDR, dominated by mixed deciduous forests (figure 5(c)), over which GEDI models for EBT are fitted rather than deciduous broadleaf trees. Here, the use of national delineations, rather than broad global strata, could have resulted in more accurate AGBD estimates. Generally, however, finer strata delineations need to be backed by ecologically-diverse and geographically-representative training data, which are currently scarce in many global regions (Duncanson et al 2019, Labriére et al 2023). Regional-level discrepancies remain a fundamental challenge for global AGBD products; the examples above support the need for local calibration before committing to their operational use for policy (McRoberts et al 2019).
The provinces of Spain display strong relations between both map-based and NFI-based estimates of AGBD; systematic deviations are negligible (p
 0.05), and the overlap with NFI CIs indicates potential for the operational use of the maps in national-level accounting. This is particularly true for GEDI, where the mean estimated stratum-wise difference is ∼12 Mg ha−1, and largest in either the fragmented, vegetation-sparse or mountainous forests. The lack of training data in the GEDI L4A models in plantation forests (Duncanson et al
2022) may explain some of these minor discrepancies. For the CCI product, the extent of Spain was classified as a single stratum for the construction of allometric models (Santoro et al
2023a), whereby minor differences to NFI estimates could arise from constraining AGBD to a single maximum value across varying ecological conditions from north to south of the country. The largest over-estimates are in mountainous conifers of Basque Country (Guipuzkoa, Bizkaia and Alava; figure 4(e), which may be driven by the active management (rotational thinnings but not clear-cuts) of eucalyptus and pines over short temporal periods. Nevertheless, like the GEDI product, mean stratum-wise differences from the NFI estimates across the country are small (∼22 Mg ha−1).
0.05), and the overlap with NFI CIs indicates potential for the operational use of the maps in national-level accounting. This is particularly true for GEDI, where the mean estimated stratum-wise difference is ∼12 Mg ha−1, and largest in either the fragmented, vegetation-sparse or mountainous forests. The lack of training data in the GEDI L4A models in plantation forests (Duncanson et al
2022) may explain some of these minor discrepancies. For the CCI product, the extent of Spain was classified as a single stratum for the construction of allometric models (Santoro et al
2023a), whereby minor differences to NFI estimates could arise from constraining AGBD to a single maximum value across varying ecological conditions from north to south of the country. The largest over-estimates are in mountainous conifers of Basque Country (Guipuzkoa, Bizkaia and Alava; figure 4(e), which may be driven by the active management (rotational thinnings but not clear-cuts) of eucalyptus and pines over short temporal periods. Nevertheless, like the GEDI product, mean stratum-wise differences from the NFI estimates across the country are small (∼22 Mg ha−1).
4. Discussion
The comparisons of the NASA GEDI and ESA CCI global estimates of AGBD to each other and to NFI data reveal promising results, albeit with the need to improve regional-level estimates and narrow the science-policy gap. The optimistic outlook pertains to the following observations -
- At the ecoregion level, large differences in estimated AGBD means between the two products are restricted to a few regions globally. For example, only ∼13% ecoregions show an absolute AGBD difference 50 Mg ha−1. The most concerning of these (in terms of the differences in mean AGBD and the least overlap of estimated CIs) in the tropical-belt are the Congolese lowlands, likely due to the lack of reference data in these forests.
- The statistical differences between mean AGBD estimated in the products and NFIs show no systematic deviation in the four countries examined. This is an important finding; it suggests that an increase in the precision of the AGBD estimates, as the products are improved in subsequent releases, may potentially enable accurate (i.e. without large systematic errors) national-level assessments.
- Some limitations in the predictive models, underlying data and uncertainty estimates of the products are observed, and subsequent product iterations may be able to address these and provide realistic opportunities to improve space-based AGBD estimation.

The above outlook should not overshadow the need to improve regional-level estimation of AGBD, particularly since stratum-specific deviations from NFI estimates are often large. Here, the distinction between statistical significance and operational significance must be stressed, i.e. even if the differences between product and NFI estimates are not statistically significantly different (in the four countries examined), they may be so large as to render them operationally significantly different. Where the differences in the two product AGBD estimates are large, where stratum-specific deviations to NFI estimates are significant, or in regions of the world where NFI data were unavailable for this study, the validation and calibration of estimates with independent reference data remains paramount to their operational use for UNFCCC reporting. Further, the use of NFIs in this study provide a basis to comparatively evaluate the regional-level performance of the global maps. However, since national/sub-national NFI reports were used in CCI's allometric models (table 1), albeit without the underlying in situ data, this exercise is inapt to replace an independent validation of the map. The caveat in our analysis is that one can compare the NFI-based and product AGBD estimates only insofar as the precision reported by the map producers allows. While it remains to be tested, not accounting for the variance in AGBD training datasets in the CCI method may have produced erroneously high precision (i.e. narrow prediction CIs) (McRoberts et al 2022), and hence CCI's AGBD predictions are treated simply as point estimates. Importantly, given the dissimilarity in the uncertainty estimation frameworks of the two AGBD maps, it is currently impossible to conclude whether both products truly capture the variance of estimated AGBD, and hence, whether they can be fused to a single map of predicted AGBD, i.e. be 'biomass harmonized', over the globe. However, an effort to align with IPCC good practice guidance (i.e. uncertainties are (i) 'neither over- nor under-estimates as far as can be judged and (ii) 'uncertainties are reduced as far as practicable' (IPCC 2006, 2019), will have a mutual benefit of resolving the above-mentioned shortcoming in the next iteration of the maps.
So far, bridging science-to-policy to use AGBD maps in the context of the UNFCCC has entailed identifying generic gaps in meeting user requirements (e.g. Herold et al 2019). Below, we provide a concrete set of actions that can be taken by the map producers, and scientists involved in space-based AGBD estimation broadly, to align with IPCC guidance and facilitate the uptake of maps by nations. These actions must be viewed in the context of how nations with varying degrees of NFI maturity (i.e. from non-existent to advanced NFIs) could use space-based AGBD maps; (a) as stand-alone datasets to directly estimate AGBD, (b) as auxiliary datasets to enhance NFI-based AGBD estimates (GFOI 2020), or (c) as independent estimates for NGHGI reporting and verification, and to support expert-reviews of submissions to the UNFCCC.
4.1. Align uncertainty assessment frameworks
First, regardless of the use of the AGBD maps, they must move towards a consistent and common analytical framework for defining and reporting information on the precision of AGBD estimates. Conflicting statistical terminology is unappealing and has led to considerable confusion on the products' alignment with IPCC terminology and their applicability to national/sub-national assessments. The GEDI products provide a strong example of such a framework, breaking down reported precision into the categories of sampling, model prediction and residual variability (negligible over large areas). This holistic overview of the precision of AGBD predictions implies that meeting IPCC guidelines for large-area assessments (see below) is a likely prospective. For the CCI product, specifically, setting the many model results (including values of variance-covariance matrices of each model's estimated parameters and variance of each response variable), in a comparable analytical framework is recommended. If the error arising due to variance in the AGBD training dataset is estimated, the contributing sources of error in the predictive models of the two maps will be aligned. If addressed in future iterations, the information may not only enable direct comparisons to GEDI products, but also assessments of how changes in the CCI methods impact the precision of its estimates.
4.2. Provide source codes for large area estimations
Second, primarily if the maps are the only source of data (e.g. for countries without NFIs), the development of transparent, well-documented and open-source code to estimate mean and total biomass stocks with associated uncertainties over arbitrarily large areas must be resourced and publicly released. This is crucial; users cannot estimate uncertainty at national or sub-national scales, nor validate the maps in any statistically rigorous way without input from the map producers, and often do not have the expertise to do so even if relevant data are available. Such open-source codes must incorporate processing the covariance amongst map-unit values, i.e. spatial correlations of uncertainties from pixel to pixel, when aggregating maps-units. Further, they should be flexible to allow users to mask map-units based on national definitions of forest strata. Finally, if they are designed to allow for the insertion of reference data, they must return the 'residual differences between map unit values and reference data' as well as 'the covariance among the residual differences' (GFOI 2020). It is only with such information can a comprehensive and statistically rigorous report of uncertainty be generated for policy purposes. As open-science developments at both ESA and NASA shift to high-computing cloud-based platforms, the operational launch and upkeep of such codes is already feasible. The NASA-ESA Multi-mission Analysis and Algorithm Development Platform (MAAP) is one such ideally-positioned platform; it is a collaborative open-source science tool being developed at both space agencies, it can host multiple global AGBD maps, and it can support fast computing for large-area AGBD estimation transparently and comprehensively for research and public use.
4.3. Provide guidance on enhancing NFIs with AGBD maps
Third, in the context of nations with NFIs (whether preliminary or advanced), guidance on methods and open-source codes to enhance national-level biomass stock estimates are urgently required. For these nations, the map-based AGBD products will be used as a auxiliary source of data to facilitate compliance with the second IPCC good practice guideline to reduce uncertainties. Here, design-based estimators that underlie the integration of the two (i.e. the NFI data and AGBD maps) do not rely on an exhaustive breakdown of the sources of uncertainty (see examples in Næ sset et al (2020) and Málaga et al (2022)). Instead, the nations need practical guidance on how to relate plot-based to map-based AGBD estimates for their specific NFI sampling designs. For this, scientists should agree on rigorous statistical procedures to enhance national and sub-national estimates with AGBD maps. These exercises must be conducted with, and ideally co-led by, designated national experts to ensure adequate collaboration, knowledge transfer and trust in the products. They should also be open-source, transparent and flexible to allow for the inclusion of new AGBD maps, as they are publicly released. Active support and liaising with the Global Forest Observations Initiative's Methods and Guidance Documentation component (GFOI 2020) to provide unambiguous examples, for a range of data from countries with basic to advanced NFIs, is strongly advised.
4.4. Make documentation and usability practical for UNFCCC reporting
Current documentation supporting space-based AGBD maps, including products beyond the two examined in this study, appeals primarily to scientific readership. While a number of recent CEOS initiatives have narrowed the science-communication gap (e.g. biomass harmonization portal (NASA 2021) and Online Biomass Inference using Waveforms and iNventory with GEDI (OBIWAN 2023)), considerable effort is needed to effectively support UNFCCC processes, i.e. NGHGI measurement and reporting, and the provision of independent estimates to inform the GST. For both of these processes, the products made available in public platforms need to be presented in a manner consistent with IPCC guidance. This may be achieved, for example, by clearly declaring if map-based AGBD estimates can be used in the equations recommended in IPCC Generic Methodologies to estimate carbon stock changes (ch 2 in IPCC 2006, with examples in supplementary information, section 4). The generation of map-based AGBD estimates as in the IPCC tables for Tier 1 approaches (i.e. tables 4.7 to 4.10 in ch 4, IPCC (2019)) is another such practical presentation of the maps. The release of such independently assessed and unambiguous information, particularly if accompanied with estimates of uncertainty, can also effectively support technical expert reviews of submissions to the UNFCCC.
5. Conclusion
Our study has shown how the methodological approaches and AGBD estimates of the current NASA GEDI and ESA CCI biomass maps compare, identifying strong relations between both products and NFI estimates in four countries, yet stressing the need for validation with independent reference data. These results are remarkably promising. Direct comparisons were, however, limited by the dissimilarities in the two uncertainty estimation frameworks. In view of the expected release of numerous space-based AGBD maps over the next decade, including those from the New Space sector (Ochiai et al 2023), this shortcoming must be overcome. NASA and ESA must set the stage on how the precision of estimated AGBD is documented; they must provide aligned, comparable, and rigorously assessed estimates, particularly for large-area assessments, such that future products follow suit. Further, while map producers improve the accuracy estimates and increase their precision, it is likely that they will offer well-posed opportunities to be used as stand-alone datasets, or be fused with the NFI data, for policy reporting. Map producers must actively liaise, with each other and policy experts, to formalize the approaches for the operational use of AGBD maps in national-level reporting. Together, they must take a step toward publicly releasing AGBD estimates (and associated variance) comparably and comprehensively, and in a practical manner in line with IPCC guidance to ensure adequate and actionable policy impact. It is with these concrete recommendations that a consistent, reliable and replicable message on global biomass stocks can be conveyed to the public.
Acknowledgment
Algorithm-development and rapid-computing in this research is supported by the NASA-ESA Multi-mission analysis and algorithm development platform (MAAP). We would like to thank the team of scientists and developers who have enabled open-science and transparent collaboration amongst research groups on this platform. We are also grateful for the support of the CCI Biomass team, the GEDI team, and Committee on Earth Observation Satellites (CEOS) space biomass harmonization effort, which has encouraged open dialogue and communication between the various scientific bodies involved in forest carbon estimation from space.
Data availability statement
The NASA GEDI products are publicly available through the NASA ORNL DAAC. ESA CCI Biomass products are publicly available on the ESA Climate Data Dashboard. Of the national forest inventory databases analyzed, the Mexican and Spanish datasets are publicly available at Comisión Nacional Forestal (CONAFOR) and Ministerio de Agricultura, Alimentación Y Medio Ambiente, respectively. For Lao PDR, data were acquired from the Lao Ministry of Agriculture and Forestry. For Peru, NFI estimates were provided by the Servicio Nacional Forestal y de Fauna Silvestre (SERFOR).
NFI data from Laos cannot be shared because it is owned by a third part with restricted public distribution. The data that support the findings of this study are available upon reasonable request from the authors.
The code to conduct the comparison of NFI and map AGBD estimates is available on Zenodo at Hunka et al (2023). The Biomass Harmonization repository associated with this article is accessible on Gitlab (https://repo.maap-project.org/lduncanson/biomass_harmonization/-/tree/master/Hunka_2023_ERL).
Funding
The research is funded by NASA through the NASA-ESA Multi-mission analysis and algorithm development platform (MAAP) and Terrestrial Ecology programs (GEDI science team Grant 80NSSC21K0196).
Conflict of interest
Authors declare that they have no competing interests.
Supplementary data (0.4 MB PDF)