

Abstract
A low-carbon energy transition is essential for mitigating climate change, but can also cause energy justice and equity impacts on Black, Indigenous, and People of Color (BIPOC), low-income, and other frontline communities. Examples include exacerbating energy burden, inaccessibility and unaffordability of low-carbon energy and electric end-use technologies, property value loss and displacement from renewable energy siting, and unequal health benefits and employment losses from fossil fuel retirement. To avoid perpetuating historical and creating new injustices, an equitable and just energy transition will require careful planning and execution. To this end, measuring and evaluating the effects of existing and proposed programs and policies aimed at decarbonizing energy systems is critical. However, methods and metrics for evaluating equity effects vary across disciplines and transitions, making it challenging to identify effective evaluation strategies. This paper presents a comprehensive review of the equity implications of low-carbon energy transitions and identifies key metrics that have been used across disciplines to quantify energy injustices and equity impacts. We focus on four key low-carbon energy transitions: (1) renewable energy deployment; (2) fossil fuel infrastructure retirement; (3) transportation electrification; and (4) residential building decarbonization. We classify energy justice and equity metrics into the dimensions of health, access, and livelihood, and construct an analytical framework that supports policymakers, planners and other stakeholders in identifying important equity considerations and quantitatively evaluating the effects of decarbonization initiatives. While our framework can serve as a starting point for evaluating justice and equity impacts of energy transitions, further work is needed to address the limitations of existing metrics and additional evaluation methods will be critical to effect energy transitions that are truly equitable.
Export citation and abstract BibTeX RIS

Original content from this work may be used under the terms of the Creative Commons Attribution 4.0 license. Any further distribution of this work must maintain attribution to the author(s) and the title of the work, journal citation and DOI.
1. Introduction
Energy services are fundamental to meeting people's basic needs and well-being, inextricably linking energy systems with equity and justice goals. The structure of energy systems has historically resulted in inequities on both local and global scales. Energy development has caused widespread displacement, energy extraction and generation have created local pollution and adverse health impacts, and energy costs have constrained energy access and affordability. Importantly, these burdens have disproportionately affected Black, Indigenous, and People of Color (BIPOC), low-income, and low-wealth households (VanCleef 2016, Drehobl et al 2020, Tessum et al 2021). Energy systems have also contributed to economy-wide fossil fuel reliance and increased global greenhouse gas (GHG) emissions, impacts of which are disproportionately borne by these same communities. A transition to low-carbon energy offers a chance to not only mitigate the broader environmental impacts of existing energy systems, but also to remediate past burdens and prioritize equitable outcomes for frontline communities that have experienced those burdens.
Some observers might rightly ask whether focusing on equity and frontline communities constitutes a special interest emphasis that is secondary to what could be construed as more primary concerns around energy and climate change as they impact the entirety of global society. The empirical record indicates that social inequality is perhaps the single most important driving force behind climate and environmental crises (Torras and Boyce 1998, Boyce 2007). The evidence is clear that the first financial supports for the economic systems that produced global climate change have come from practices and policies that involved social injustice and institutional violence, including colonialism, chattel enslavement, and the reinforcement of generally brutal, low-wage workplace conditions across national economies (Heynen 2016, Pulido 2017). Thus, addressing various forms of inequality is central to solving our global climate and energy challenges, which will likely also result in shared benefits for society as a whole. The low-carbon energy transition offers an unprecedented opportunity to simultaneously address the climate and inequality concerns stemming from existing energy systems.
However, low-carbon energy transitions are not guaranteed to be just and equitable. It has become increasingly apparent that decarbonization efforts can perpetuate or even exacerbate inequities. Already we are starting to see how low-carbon energy transitions, which broadly encompass sectoral shifts from fossil fuel-based energy to cleaner, renewable energy sources, are both perpetuating longstanding energy injustices as well as creating new ones (Sovacool et al 2019, Carley and Konisky 2020). While these energy transitions generally coincide with broader environmental benefits, social and economic benefits are less clear. For example, studies have shown that marginalized communities have not received equal shares of the benefits of the transition due to exclusion from renewable energy labor markets and limited access to low-carbon technology and incentives (Borenstein and Davis 2016, Muehlegger and Rapson 2018). Still, the transition is in the early stages with many pathways yet to unfold, which offers ample opportunities to intervene and prioritize equitable outcomes. In reckoning with the fact that energy transitions do not necessarily equate to more just energy services—and that there might be continued or even increased disparities in the distribution of both costs and benefits of low-carbon energy systems—researchers and policymakers must make careful evaluations and targeted efforts before programs and policies are implemented. Thus, identifying, evaluating, and addressing energy inequities now is critical for achieving a just and equitable transition in the future.
One tool that researchers and policymakers can use to assess the potential efficacy of decarbonization initiatives are metrics for evaluating complex and diverse data and associated issues. Identifying and incorporating metrics into an equity evaluation can assist in determining baseline system characteristics, identifying and quantifying disparities, and setting actionable targets for improvements. Metrics also have the potential to aid communities experiencing energy injustices by providing data-driven evidence to supplement their firsthand accounts, and developing quantifiable metrics and goals can lead to accountability and transparency from relevant government agencies and corporations. Consequently, scholars have recently called attention to a pressing need to measure and evaluate energy justice concerns, needs, and goals (Baker et al 2021a). In efforts to address this need and provide a useful tool for policymakers, this review uses a wide-ranging set of scholarly work to identify key equity metrics associated with energy transition pathways, and presents a framework for evaluating outcomes as they relate to energy equity and justice.
Although metrics and quantitative measurements can be effective for assessing energy justice outcomes, they do of course have limitations. Energy justice is multi-dimensional by nature, and a single metric cannot be used to evaluate or predict its achievement. More importantly, certain energy injustices, many of which have long histories, cannot be adequately measured. For example, the cultural impacts of energy extraction in Indigenous communities and on sacred sites have been immense and cannot be reasonably quantified (Orellana 2005). Similarly, mental health effects in communities living near hazardous sites cannot be reduced to a set of quantitative metrics (Hirsch et al 2018). Still, there is value in documenting these complicated issues in hopes of remedying them. Thus, while metrics should not be relied upon exclusively for evaluating outcomes of potential energy pathways, they offer researchers, policymakers, and community members an important tool to identify and incorporate justice considerations into transition planning.
The overarching goal of this article is to move beyond theory and toward more practical applications of energy justice and energy transition scholarship. It does so by offering a review of metrics used to evaluate equity outcomes throughout four distinct energy transitions: renewable energy deployment, transportation electrification, fossil fuel infrastructure phaseout, and residential building decarbonization. The article presents specific examples of how each metric has been used in the literature across multiple disciplines, including economics, public health, social science, and energy science, and contributes a framework that demonstrates how these metrics can be used when planning for equitable energy transitions. While the analytical framework is informed in large part by foundational energy justice theories, it is geared toward practical use—to act as a guide and tool for stakeholders to consider equity outcomes. This approach is in line with the ultimate goal of the paper: to provide diverse stakeholders, including energy planners, policymakers, and energy justice practitioners, with metrics that can be used to quantitatively evaluate energy inequities arising from the low-carbon energy transition, to make sure it is a just transition.
2. Background
Energy justice as a concept emerged out of a necessity to recognize and address social disparities found within existing energy systems (McCauley et al 2013). Low-income communities, Indigenous communities, and People of Color in the US spend more on existing energy services as a share of their income (Drehobl and Ross 2016, Ross et al 2018), are exposed to greater levels of air pollution originating from energy extraction and production operations (Thind et al 2019, Tessum et al 2021), and face additional inequities related to energy services and systems. As such, scholars and advocates have adapted principles from environmental and social justice research to develop several approaches to conceptualizing energy justice. As a whole, energy justice researchers advocate for energy services that are more affordable, accessible, clean, sustainable, and democratically managed for all, while centering the needs of marginalized communities and remediating energy related burdens (Initiative for Energy Justice 2019).
Several distinct conceptual models have evolved from the energy justice literature, with the most dominant framework utilizing three dimensions of justice: distributional, procedural, and recognition (Jenkins et al 2021). This energy justice framework was first presented by McCauley et al, and it draws from earlier environmental justice scholarship that relies on the same tenets (Schlosberg 2004, McCauley et al 2013). The principles of the environmental justice movement have been applied specifically to energy research to account for equity concerns related to affordability, accessibility, participation, and remediation of burdens associated with energy systems. Distributional justice refers to the distribution of burdens and benefits related to energy systems, and this encompasses issues such as disproportionate pollution exposure from fossil fuels or inequitable allocation of incentives for low-carbon technologies. Procedural justice refers to meaningful participation and representation in decision-making processes, especially for historically disenfranchised and underrepresented communities. Equitable participation in decision-making processes for all communities is crucial as society undergoes significant changes through energy transition planning. Recognition justice refers to recognition of the diversity of identities and experiences in different groups or communities (Schlosberg 2004), and this emphasizes the importance of identifying the distinct needs and vulnerabilities of communities impacted by energy systems. While these dimensions are most commonly cited throughout the energy justice literature, other scholars and frameworks integrate additional dimensions including restorative justice, cosmopolitan justice, and the capabilities approach (Sovacool and Dworkin 2015, McCauley and Heffron 2018, Melin et al 2021).
Moving beyond justice theories, Sovacool and Dworkin propose a framework that presents energy justice as a conceptual tool for scholars, an analytical tool for energy researchers, and a decision-making tool for energy planners and consumers (2015). The decision-making tool presents eight principles: availability, affordability, due process, good governance, sustainability, intergenerational equity, intragenerational equity, and responsibility (Sovacool and Dworkin 2015). This type of multifaceted model provides a comprehensive and practical understanding of how energy justice can be used to address energy-related problems. In applied settings, energy justice is framed in different ways. For example, energy access is the focal point of one of the United Nations' 17 sustainable development goals (SDGs); the goal of SDG 7 is to ensure energy access for all with dimensions of affordability, reliability, sustainability, and modernity (United Nations 2015). There is also a significant portion of the energy justice literature that focuses on energy insecurity, which is the inability to adequately meet basic household energy needs (Hernández 2013, 2016), and energy burden, which is the proportion of annual household income that is spent on energy utility costs (Drehobl and Ross 2016).
Past review articles have primarily taken a qualitative, descriptive approach to summarizing the energy justice literature by reviewing various frameworks, definitions, and concepts of energy justice (Jenkins et al 2016, Lacey-Barnacle et al 2020, Pellegrini-Masini et al 2020). Some reviews focus on particular aspects of energy justice, such as US household energy burdens (Brown et al 2020) or energy insecurity as it relates to health and climate change (Jessel et al 2019). Additionally, many reviews focus on energy justice as a whole, rather than considering the specific equity concerns of low-carbon energy transitions that we focus on in this review. Notable exceptions include a recent review of advocacy within energy justice and just transition literatures (Shelton and Eakin 2022) and a review that qualitatively synthesized the equity implications of the just transition (Carley and Konisky 2020).
All of these approaches are valuable in conceptualizing and defining energy justice in a qualitative manner, but lack guidance to assess equity and justice within energy transitions, policies, and programs. A limited but growing number of studies have developed quantitative assessment frameworks for energy justice, including an energy justice metric to assess national energy infrastructure development (Heffron et al 2015), a social life cycle assessment for low-carbon energy systems (Fortier et al 2019), a standardized national framework to evaluate energy equity (Energy Equity Project 2022), and a collection of energy equity metrics relevant to electricity infrastructure in the US (Barlow et al 2022). Additionally, some reviews have compiled metrics to evaluate specific aspects of energy justice related to energy poverty (Lowans et al 2021), renewable energy policy (Lanckton and DeVar 2021), and energy efficiency (EE) programs (Martín and Lewis 2019). However, there remains a need for a comprehensive review of metrics that assess energy justice concerns and outcomes across various low-carbon energy transitions. In this paper, we present a metrics-based analytical framework that complements past research contributions and is designed as a tool for researchers and practitioners to evaluate energy justice and equity outcomes.
3. Framework and methodology
This study is based on a literature review of energy transitions, justice scholarship, and methods and metrics that quantify equity outcomes. After our literature review, we developed an analytical framework to synthesize those metrics and present them for practical use by stakeholders such as researchers, communities, and other decision-makers. Our framework is intended for use by diverse stakeholders, and thus aims to synthesize complex and interconnected challenges facing equitable energy transitions.
3.1. Literature review
We use a combination of standard literature review methodology and expert knowledge of wide-ranging disciplines to compile key articles from a variety of disciplines, including public health, economics, sociology, and public policy. Our literature search focused specifically on research with quantitative assessments of energy systems and transitions. Our aim is to provide a comprehensive, though not exhaustive, review of metrics used to quantify existing and potential energy inequities in energy transition policies and programs.
We selected literature through thematic searches on two academic search engines, namely Google Scholar for general queries and PubMed Central for health-related queries. Searches were filtered with a time period of 2000–2023 to account for both recent scholarship in energy justice as well as earlier work assessing equity impacts from energy systems, with the final search occurring in October 2023. The lack of consistent terminology related to energy justice concepts (e.g. energy equity, energy security, energy poverty, fuel poverty, etc) combined with a review of multiple sub-transitions ranging from building decarbonization to transportation electrification renders the possibility of a systematic review process quite challenging. The review instead takes a narrative approach to synthesize literature from several disciplines and develops an analytical framework to guide quantitative evaluations of energy equity.
We assessed initial search results based on article title and abstract, and papers meeting the search inclusion criteria were set aside for full review. Inclusion criteria included the following: identifiable assessment method, quantitative metric relevant to equity, articles available through University of California institutional access, and articles written in English. Articles that did not meet these criteria were excluded from further review. The snowball citation approach was used to identify additional potentially relevant papers from reference lists and citations to expand the study (Wohlin 2014). We assessed over 400 articles and reports, and we identified metrics from 132 of these sources. We also referenced an additional 67 articles to provide more background and context to the review. From the selected literature, we first documented the energy injustices and inequities and the metrics used to quantify them and then derived an analytical framework that categorized these metrics.
3.2. Analytical framework
To develop our analytical framework, we used the studies identified in the literature review to compile and categorize energy equity metrics. The structure of our framework figure was inspired by the vulnerability scoping diagram (VSD), originally developed by Polsky et al (2007) to assess vulnerabilities to hazards stemming from global environmental changes (Polsky et al 2007). The VSD has been used and adapted by scholars to evaluate various types of vulnerability, including vulnerability to energy transition policies like the US renewable portfolio standards (Carley et al 2018). Instead of assessing vulnerability, our framework categorizes metrics that can be used to evaluate equity and justice within energy transitions. Categorizing complex and interconnected socioeconomic issues into individual categories is not easy or always ideal. In spite of this challenge and recognizing its limitations, we designed this framework (figure 1) to allow stakeholders to conceptualize and evaluate the efficacy of their programs, policies, and regulations in producing equitable outcomes.
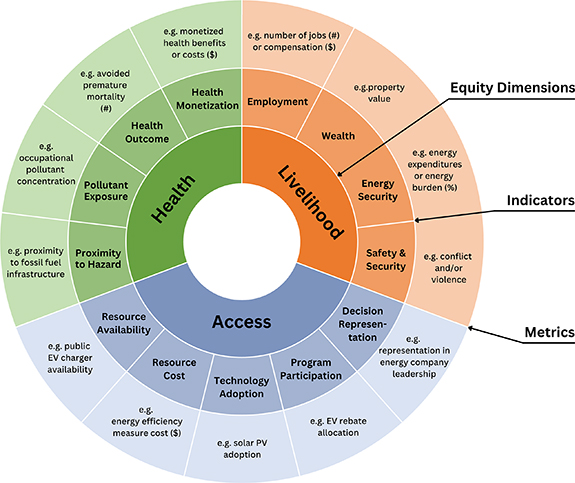
Figure 1. Energy equity evaluation framework.
Download figure:
Standard image High-resolution image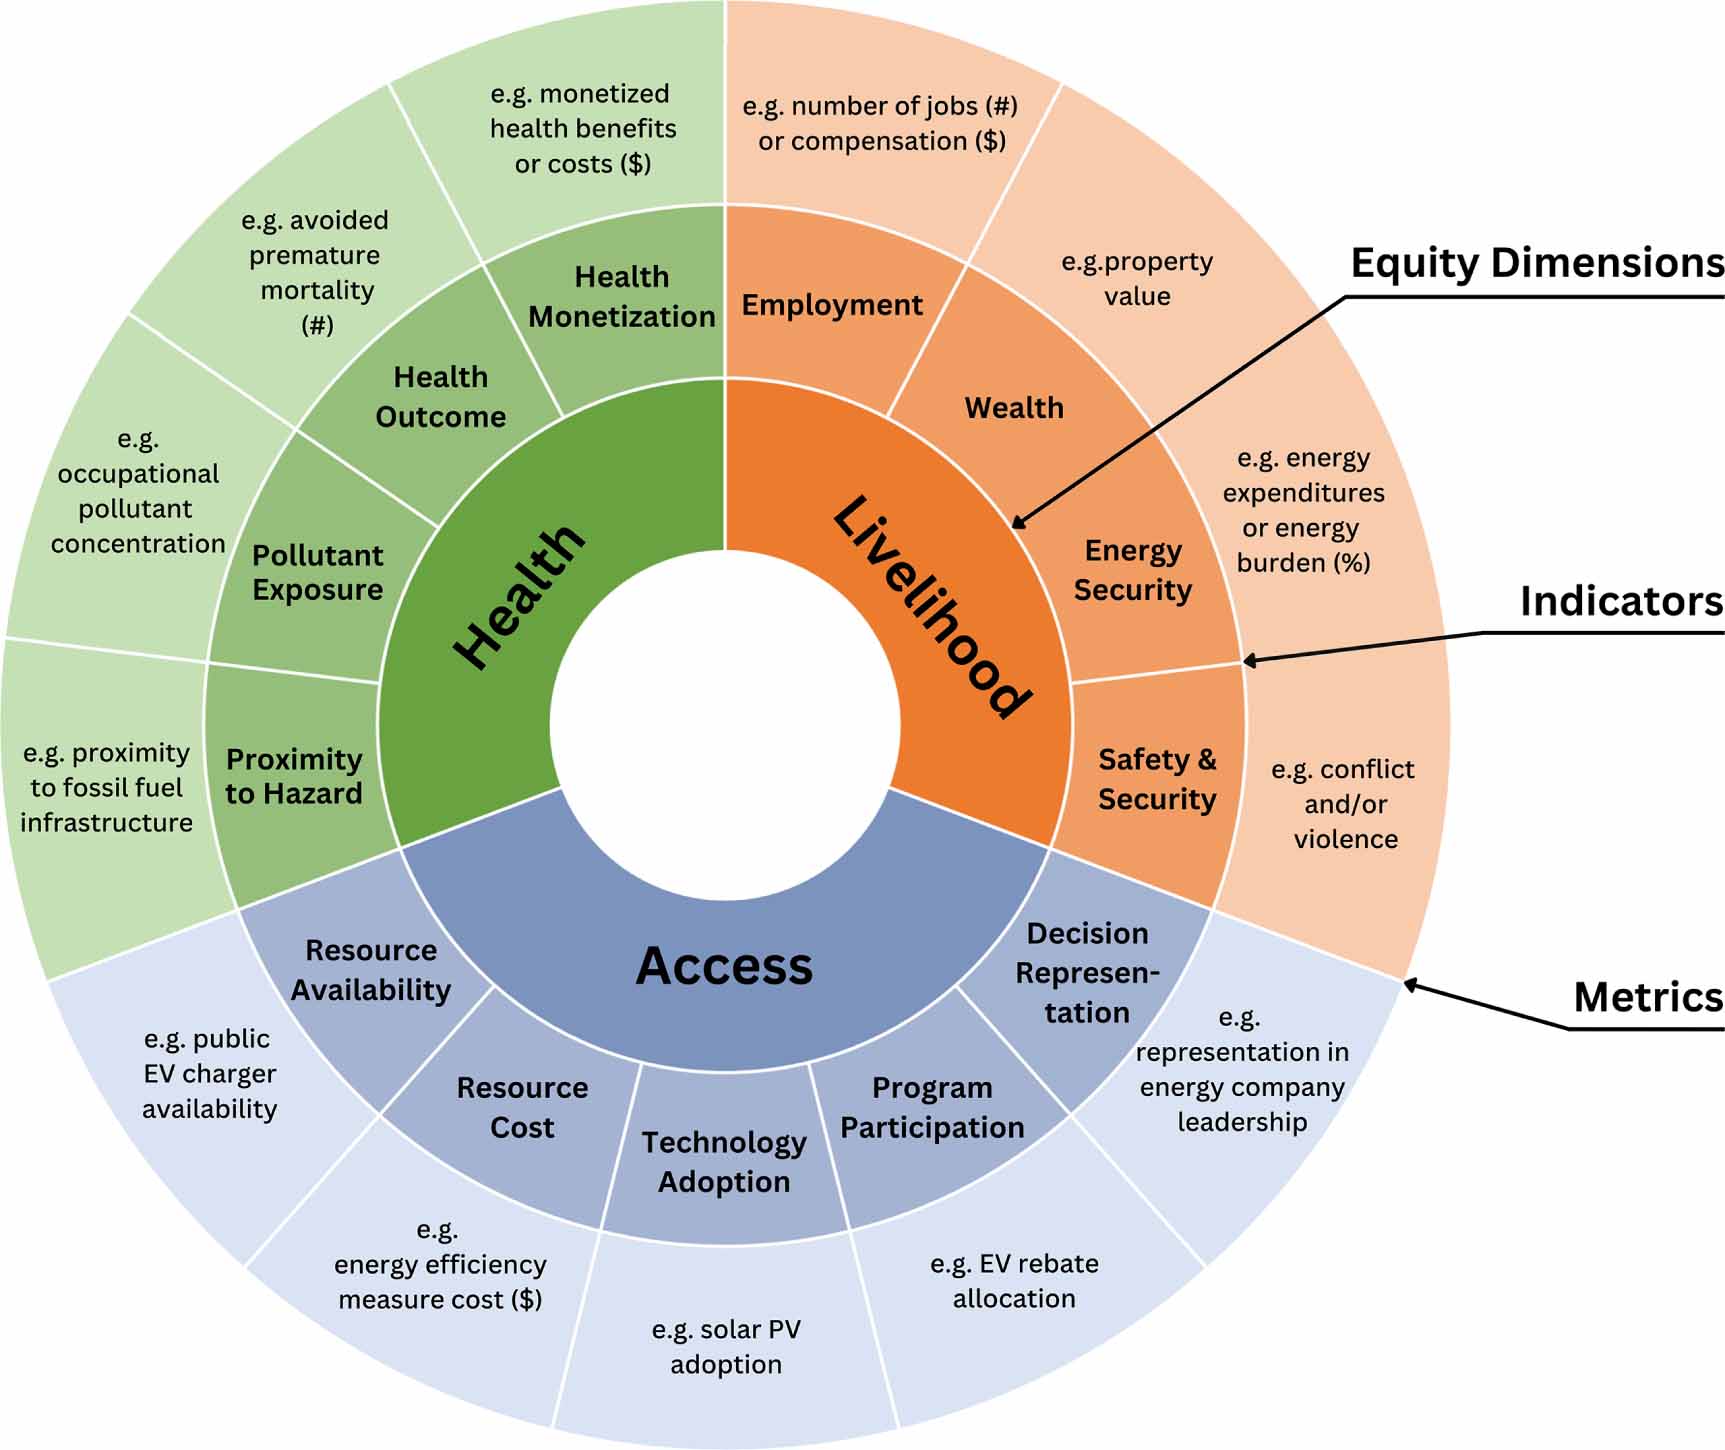
Our framework categorizes equity outcomes associated with energy programs, policies, or transitions into three main categories, called 'Equity Dimensions.' These include health, access, and livelihood (table 1). Each equity dimension has multiple 'Indicators,' which can be quantified and evaluated. For example, livelihood can be assessed by examining trends in employment, wealth creation, and energy security. Finally, each indicator encompasses multiple quantitative 'Metrics' that enable quantifying, monitoring, and evaluating that indicator. These metrics were compiled through an extensive interdisciplinary literature review, but they are not exhaustive. Furthermore, although we categorized the different indicators and metrics under each equity dimension, the categorization is not perfect. Equity outcomes are highly interconnected, and as such, it is likely that certain indicators and metrics fall under more than one equity dimension. For example, an energy transition policy that impacts a household's ability to access affordable energy services (an access issue) can have compounding negative effects, such as potentially putting the household at greater risk of using indoor solid-fuels (a health issue). In such interconnected cases, we use categories that appear to have the most direct connection to the related policy or energy initiative. Thus, we intend this framework to serve as a simplified, practical guide for stakeholders to quantitatively evaluate equity outcomes, and users can adapt it based on data availability and community needs.
Table 1. Equity dimensions.
| Equity dimension | Description |
|---|---|
| Health | Physical and emotional health externalities (positive or negative) associated with energy systems and transitions |
| Access | Ability of individuals to equitably use, benefit from, and have control of energy transition resources (programs, technologies, services) |
| Livelihood | Opportunities for individuals to achieve social and economic well-being in relation to energy transitions |
3.2.1. Equity dimension: health
The health dimension in our framework includes the physical or mental health externalities associated with energy systems and transitions. These externalities could be negative (e.g. local air pollution from a coal-fired power plant and sleep disturbance induced by noise from wind power plants) or positive (e.g. reduced pollution and associated health benefits from decommissioning a fossil fuel power plant). This dimension includes health impacts related to extracting, harvesting, and processing fuels, siting new and phasing out old energy infrastructure, operating power plants, transportation technologies, industries, and appliances, and other activities that lead to increased or decreased pollutant exposure. Previous studies have evaluated health impacts associated with energy transitions according to four indicators shown in table 2, each of which falls along a continuum of measurement where the subsequent indicator is dependent on the previous indicator.
Table 2. Indicators for health.
| Indicator | Description |
|---|---|
| Proximity to hazard | Physical distance to an environmental hazard such as a power plant, mineral extraction site, etc |
| Pollutant exposure | Concentration of and exposure to a pollutant |
| Health outcome | Actual occurrence or projected risk of developing an adverse health effect based on exposure (e.g. cancer, respiratory disease, mental health disorder, etc) |
| Health monetization | Monetized estimate of health effects (e.g. monetized value of morbidity and premature mortality) |
The first two indicators—'proximity to hazard' and 'pollutant concentration'—represent the pathways to potential exposure to harmful substances. 'Proximity to hazard' measures the physical distance to some type of environmental hazard such as a power plant, mining operation, or other source of pollution. This indicator includes metrics of proximity evaluated by race, ethnicity, income, education, and other identifiers. The second indicator is 'pollutant exposure', which refers to the concentration of a pollutant in the air, water, or within the human body. Examples of metrics for this indicator include air concentration of pollutants near fossil fuel operations, methane concentrations in local water sources, and metal concentrations in urine of mine workers and nearby residents.
'Health outcome' and 'economic valuation' are indicators that represent the effect of an exposure. The third indicator, 'health outcome', is the occurrence or risk of an adverse health effect resulting from exposure to a pollutant. Examples of metrics include incidence rates of cancer or other diseases associated with fossil fuel operations, mortality rates associated with PM2.5 pollution, and the incidence of respiratory illness associated with indoor natural gas cooking. Other examples include estimates of mental health effects associated with energy insecurity or proximity to fossil fuel operations, as well as reported levels of psychological distress associated with wind power development. Lastly, under the 'health monetization' indicator, health outcomes—morbidities and mortalities—are monetized. Debates and uncertainties around monetization of human life and health notwithstanding, this indicator is commonly applied in research and policymaking to evaluate health effects as well as assess equity outcomes. Examples of metrics associated with this indicator include monetized health benefits of an energy transition initiative such as the cumulative value of avoided mortality from coal power plant retirements or the annual health benefits from replacing natural gas appliances with electric appliances.
3.2.2. Equity dimension: access
We define the access dimension as one that encompasses the ability of individuals and households to equitably use, benefit from, and have control of energy transition resources (e.g. programs, technologies, services) regardless of their socioeconomic status, or racial and ethnic identity. While the term 'access' has various interpretations in the literature, our conceptualization acknowledges that it extends beyond mere rights and ownership of resources; it also involves the ability to derive benefit from those resources (following Ribot and Peluso 2003). This dimension includes barriers and opportunities to accessing low-carbon energy transition resources, and we strive to be specific about the type of 'access' measured in related metrics. Thus, the indicators presented in table 3 cover not only physical aspects of access to resources (e.g. proximity to an electric vehicle [EV] charger), but also factors indicating the ability to derive benefit from these resources, such as incentive program participation rates and decision-making representation.
Table 3. Indicators for access.
| Indicator | Description |
|---|---|
| Resource availability | Presence, extent, and physical attainability of resources (e.g. availability of energy efficiency incentive programs, spatial proximity to EV chargers, space for rooftop solar photovoltaic [PV]) |
| Resource cost | Financial cost of resources and associated affordability issues |
| Technology adoption | Ownership of technologies such as solar PV, electric vehicles, and energy efficient appliances |
| Program participation | Extent of participation in energy transition related programs and incentives (e.g. participation rates in energy efficiency programs or allocation of EV incentives across groups) |
| Decision representation | Control and governance over energy systems and decision-making processes |
The first two indicators under this dimension are 'resource availability' and 'resource cost.' 'Resource availability' is the presence, extent, and physical attainability of energy transition resources. Under this indicator, access could be impeded by an uneven or inequitable spatial distribution of resources, physical constraints, or a lack of programs and services. Examples of metrics that measure 'resource availability' include low-income EE program offerings by utility companies and the number of public EV charger stations available by income and race/ethnicity. The 'resource cost' indicator refers to the financial cost of energy transition resources and their associated affordability challenges. Metrics include EV charging costs, differences in energy efficient appliance costs by neighborhood, and other low-carbon technology costs that may be prohibitive to low-wealth households.
Next, the 'technology adoption' and 'program participation' indicators represent the actual utilization of a resource, and they each indicate potential disparities in access to resources and the distribution of their benefits. The 'technology adoption' indicator refers to the ownership of technologies that enable a low-carbon transition. Examples of quantifying equity outcomes in technology adoption include levels of ownership (and leases) of rooftop solar photovoltaic (PV), EVs, and energy efficient appliances across income, race/ethnicity, and other demographic variables. The 'program participation' indicator refers to enrollment and participation in incentive and training programs related to the low-carbon energy transition. EV rebate allocation, EE incentive distribution, and estimates of eligible customers enrolled in energy assistance programs are examples of evaluations under this indicator.
Finally, the 'decision representation' indicator incorporates aspects of energy democracy as it refers to the ability of individuals to participate in energy transition decision-making processes. Examples of participation in decision-making include the proportion of community members involved in various stages of decision-making and representation in leadership roles evaluated by income, race/ethnicity, gender, language, and other socioeconomic and demographic variables.
3.2.3. Equity dimension: livelihood
The livelihood dimension comprises the opportunities of individuals to achieve social and economic well-being in relation to energy transitions. This dimension includes impacts related to economic development and a satisfactory, safe, and secure quality of life, with four key indicators shown in table 4.
Table 4. Indicators for livelihood.
| Indicator | Description |
|---|---|
| Employment | Labor impacts resulting from energy transitions |
| Wealth | Individual or community asset ownership |
| Energy security | Stable and affordable access to energy services needed to meet basic needs |
| Safety and security | Physical well-being and the ability to securely live and access natural resources in a place of choice |
Under the livelihood dimension, the 'employment' and 'wealth' indicators represent economic opportunity and security. The 'employment' indicator refers to any labor impacts resulting from energy transitions such as estimates of job losses due to the phase down of fossil fuels as well as job gains in renewable energy sectors. Compensation differences, geographic distribution of labor opportunities, and workforce representation by gender, race, and ethnicity are all evaluated under this indicator. The 'wealth' indicator refers to both individual and community asset ownership, and it indicates economic development and financial security. Metrics that evaluate equity outcomes under the 'wealth' indicator include business ownership, residential property value changes as a result of nearby renewable energy development, and changes in annual community tax revenue from the fossil fuel industry.
'Energy security' and 'safety and security' are indicators that represent the necessary components to achieve a satisfactory quality of life, including material, social, and cultural needs. These indicators hinge on the belief that all individuals are entitled to a certain standard of living that meets basic human needs. The 'energy security' indicator refers to stable and affordable access to energy services needed to meet an individual's or household's basic needs. Metrics for equity outcomes include estimates of energy burden, projected changes in energy expenditures, and rates of utility disconnections. The 'safety and security' indicator refers to physical safety and consistent access to places or natural resources that an individual or community has significant ties to, which could be a home, water source, or ancestral land. This indicator encompasses measures of conflict, violence, displacement, and gentrification. However, there are certain aspects of this indicator that cannot be quantified, which is addressed further in the discussion.
4. Equity metrics for evaluating energy transitions
In 2020, the power, transportation, and building sectors were responsible for the majority of global CO2 emissions from energy, accounting for 44%, 23%, and 8% of the total, respectively (IEA 2021a). These sectors have created and maintained energy injustices through their extraction, generation, distribution, and consumption, both in the US and around the world. At the same time, energy transitions within these sectors provide a unique opportunity to address both historical and future injustices while mitigating GHG emissions. Our review focuses on four main energy transitions—renewable energy deployment, transportation electrification, fossil fuel infrastructure phaseout, and residential building decarbonization. We selected these transitions because they will play a significant role in achieving economy-wide decarbonization and because they will directly affect communities and households in the process. Through this review of the literature, we identify quantitative metrics to assess equity outcomes within these energy transitions, and synthesize each transition according to the equity dimensions detailed in the analytical framework: health, access, and livelihood.
Diverse stakeholders, including researchers, policymakers, and other decision-makers, have used a wide range of metrics to evaluate equity outcomes of energy transitions. These metrics vary across energy transitions and disciplines, and according to choices made by stakeholders based on data availability, capacity, and perceived value. We collated the main metrics identified through our review in tables 5–8, which we classified according to the equity dimensions and indicators presented in our analytical framework. As the focus on energy justice and equity continues to grow, the metrics used by decision-makers are rapidly evolving. As such, this list of metrics should be used as a starting point for evaluating equity outcomes in energy transitions, and expanded with better data availability and context-specific application.
Table 5. Energy equity metrics for renewable energy deployment. Each metric is classified by 'Equity Dimension' and 'Indicator' with measurements and examples compiled from the literature.
| Indicator | Metric | Measurement | Example |
|---|---|---|---|
| Health dimension | |||
| Proximity to hazard | Proximity to renewable energy infrastructure | Cumulative population living near RE infrastructure (#), proportion of population living near RE infrastructure (%) | Under a high electrification scenario, approximately 12%–15% of the current western US population (9.5–12.5 million people) could live within 16 km of a wind plant or 3 km of a solar plant to reach net-zero emissions by 2050 (Wu et al 2023) |
| Pollutant exposure | Occupational pollutant concentration and exposure | Air concentration of pollutants (mg m−3), maximum worker exposure concentration (kg m−3) | In a manufacturing facility for solar PV components, air concentration samples of indium, a toxic metal, ranged from 0.072 mg m−3 to 5.4 mg m−3 compared to accepted occupational exposure limits of 0.1 mg m−3 (Hines et al 2013) |
| Environmental pollutant concentration | Proportion of samples exceeding environmental quality standards (%), relative pollutant concentrations | A study of cadmium concentrations near mining sites in China found that between 64.6% and 94.1% of soil samples across four sites exceeded Chinese environmental quality standards for soil (Zhou et al 2018) Soil samples from China's Lanping mining valley revealed lead concentrations 56 times higher and zinc concentrations 47 times higher than global averages, and downstream soil samples also revealed higher concentrations of lead (eight times), zinc (eight times), and cadmium (18 times) compared to global averages (Li et al 2019) | |
| Health outcome | Avoided premature mortality | Cumulative avoided premature mortalities (#), annual avoided premature mortalities (# year−1) | US renewable energy deployment between 2007 and 2015 resulted in an estimated 3000–12 700 avoided premature mortalities associated with avoided SOx , NOx , and PM2.5 emissions from other generation sources (Millstein et al 2017) |
| Sleep disturbance and psychological effects | Proportion of respondents reporting sleep disturbance (%), sleep quality index, mental health score | Reported sleep disturbance increases with increasing sound pressure levels from nearby wind turbines, and at levels over 45 dB(A), 48% of survey respondents report sleep disturbances. For comparison, the World Health Organization recommends less than 40 dB(A) for night noise (Bakker et al 2012) In a study of residents living near industrial wind turbines in Maine, respondents with the nearest residential proximity reported a mean Pittsburgh Sleep Quality Index (PSQI) score of 8.7 compared to scores ranging from 6.0 to 7.8 for further distances, as well as worse mental health as evidenced by a mean SF36-V2 Mental Component Score (MCS) of 40.7 compared to the furthest group's score of 52.9 (Nissenbaum et al 2012) | |
| Health monetization | Monetized health benefits or costs | Cumulative health benefits ($), annual health benefits ($ year−1), health benefits per ton of CO2 reduced ($ tCO2 −1), health benefits per unit of energy produced ($ MWh−1) | US renewable energy deployment between 2007 and 2015 led to approximately $29.7–112.8 billion in health benefits associated with avoided SOx , NOx , and PM2.5 emissions from other generation sources (Millstein et al 2017) In 2013, new renewable energy deployed to meet state renewable energy targets in the US led to $5.2 billion in health and environmental benefits, equivalent to 5.3¢ kWh−1 of new renewable energy (Barbose et al 2016) Renewable energy targets enforced in the Rust Belt region of the US are expected to produce health benefits of $94 per ton of CO2 reduced in 2030 (Dimanchev et al 2019) In the US Pennsylvania–New Jersey–Maryland (PJM) Interconnection region, projected annual benefits of various decarbonization pathways range from $14 to 170 MWh−1, varying substantially by renewable energy project type and location (Buonocore et al 2016) |
| Access dimension | |||
| Resource availability | Solar PV installation limitations | Proportion of solar PV systems installed by building type (%), proportion of solar PV systems installed by homeownership status (%) | Approximately 3% of US solar systems have been installed on multifamily buildings (including condos), most of which were owner-occupied (Forrester et al 2022) According to the 2020 Residential Energy Consumption Survey (RECS), approximately 97% of solar systems on single family and mobile homes in the US (excluding apartment buildings) are on owner-occupied housing units and 3% are on renter-occupied units (EIA 2022a) According to a 2019–2020 survey, approximately 6% of Australian rental properties had solar PV compared to 30% of owner-occupied properties (Australian Bureau of Statistics 2022) |
| Resource cost | Solar PV cost | Total solar PV system cost ($), willingness to pay for solar PV system ($), LCOE from solar PV by country ($) | In Ireland, a study found that homeowners were willing to pay an average of €6200 for a 3 kW solar PV system, when the actual cost for that system was between €20 000 and 25 000 (Claudy et al 2011) Researchers calculated country-specific levelized costs of electricity (LCOE) from solar PV in Africa to demonstrate the importance of regional context in energy transition planning, finding that Liberia, Sudan, and Sierra Leone have LCOE 2.5 times higher than those in Botswana, Namibia, South Africa, and Morocco (Mulugetta et al 2022) |
| Technology adoption | Solar PV adoption | Median income of solar adopters compared to US household median income ($), share of solar adopters classified as low-to-moderate income (%), relative solar PV adoption across census tracts by race/ethnicity (%), relative solar adoption shares across census tracts by disadvantage scores | In 2020, US households who installed solar PV had a median income of $115 000 compared to the US household median income of $63 000 (Forrester et al 2022) In 2020, 20% of US solar adopters were considered low-to-moderate income at <80% of area median income (AMI) while 6% of solar adopters were at <150% of the federal poverty level (FPL) (Forrester et al 2022) The median solar-adopter income ranges from 130% to 175% of the county-median household income, though this income skew is gradually decreasing over time indicating an increase in adoption among less affluent households (Forrester et al 2022) For the same median household income, Black-majority census tracts installed 69% fewer rooftop PV and Hispanic-majority census tracts installed 30% fewer rooftop PV compared to no-majority census tracts; this trend was similar when controlling for home ownership (Sunter et al 2019) In California, the most disadvantaged census tracts have more than eight times lower deployment rates than the least disadvantaged census tracts (Lukanov and Krieger 2019) |
| Solar PV penetration (adoption as a share of potential) | Low-to-moderate income (LMI) solar PV penetration rate (# LMI solar systems per 1000 owner-occupied LMI households per quarter), change in rooftop PV penetration by English proficiency, LMI market share, and other factors (%) | For 2010–2018, the average LMI solar PV penetration rate was approximately 2.1 LMI adoptions per 1000 households per quarter; analysis of interventions suggest that LMI incentives increase LMI PV penetration by 0.7 adoptions per quarter and leasing increases LMI PV penetration by 1.5 adoptions per quarter (O'Shaughnessy et al 2021) In San Bernardino, California, a 10% increase in limited English proficiency and a 10% increase in LMI market share (the proportion of suitable rooftops that are occupied by low-to-moderate income households) were both associated with 36% lower rooftop penetration (Reames 2020) In Riverside, California, a 10% increase in households without internet access was associated with 33% lower rooftop penetration (Reames 2020) | |
| Program participation | Renewable energy incentive allocation | Solar incentive distribution by income (%), share of solar incentives distributed from low-income incentive programs (%) | Between 2006 and 2012, the bottom 50% of tax filers received only 10% of all renewable energy credits, while the top 5% received approximately 20% of all credits (Borenstein and Davis 2016) Approximately 1% of all incentives distributed are from low-income incentive programs (Paulos 2017, O'Shaughnessy et al 2021) |
| Solar PV leasing program participation | Proportion of solar adopters leasing PV systems (%) | Approximately 49% of solar adopters in low-income communities utilized solar PV leasing programs compared to 42% of solar adopters in other areas (O'Shaughnessy et al 2021) | |
| Decision representation | Representation in energy/utility company leadership | Proportion of executives by race, sector, and gender (%) | A 2019 report of the solar industry found that 88% of senior executives were White and 80% were men (The Solar Foundation 2019) Women make up approximately 13.9% of senior management within the global energy and utilities sectors and 10.8% within the renewable energy sector (IEA, 2021d) |
| Livelihood dimension | |||
| Employment | Number of jobs | Jobs per unit of energy (job-years GWh−1), cumulative direct jobs (#), annual direct jobs (# year−1), | Models suggest that all low-carbon energy technologies create more jobs per unit of energy than their coal and natural gas counterparts—e.g. solar PV creates an average of 0.87 job-years per GWh compared to 0.11 job-years per GWh for natural gas (Wei et al 2010) A well-below two degree transition scenario could result in an increase in direct energy jobs from the current 18 million to approximately 26 million by 2050, compared to job growth to 21 million under current policy scenarios (Pai et al 2021) A net zero transition is projected to lead to an average of approximately 3 million annual direct jobs in the first decade and 4–8 million direct jobs during the 2040s (Mayfield et al 2021) |
| Compensation | Relative median hourly wage ($ h−1) | While natural gas and coal employees have a median hourly wage of $30.33 and $28.69, respectively, wind and solar employees are at $25.95 and $24.48 (NASEO, EFI and BW Research 2021) | |
| Workforce changes | Change in workforce availability (%), employee turnover rate (%) | During the construction of the Belo Monte dam in Brazil, nearby rural communities experienced a 50% decrease in farm labor compared to the pre-construction period, which farmers believed to be motivated by job opportunities from the dam and its associated urban growth (Calvi et al 2020) Employment data from the dam's construction period reveal that 76% of construction hires had a maximum employment time of three months indicating a high employee turnover rate (Calvi et al 2020) | |
| Workforce representation | Proportion of female workers in workforce (%), proportion of Black workers in workforce (%) | Women make up approximately 30% of the US solar workforce and 31% of the wind power workforce compared to compared to 47% of the national workforce (NASEO and EFI 2020) Black Americans make up approximately 8% of the solar and wind workforce compared to 12% of the national workforce (NASEO and EFI 2020) | |
| Wealth | Property value | Change in property value associated with proximity to energy development (%) | Wind energy projects within 2 km reduced residential property value 4%–5% in the UK and 1.4%–5.4% in the Netherlands compared to control groups, with values dependent on turbine height and proximity (Dröes and Koster 2016, 2021, Jarvis 2021) The effect of solar development on property value is less clear; some studies report no effect while others estimate reductions of 1.7% in certain US states and 2.6% in the Netherlands compared to control groups (Dröes and Koster 2016, 2021, Gaur and Lang 2020, Jarvis 2021) |
| Energy asset ownership | Proportion of energy assets owned by women, BIPOC, or local residents (%) | On average, women make up only 22% of owners in citizen-owned renewable energy plants in Germany (Fraune 2015) | |
| Energy security | Energy expenditures | Average utility rate increase ($ kWh−1), average annual utility rate increase ($ year−1) | US states with renewable portfolio standards (RPS) have experienced greater increases in electricity prices by 0.91 cents per kWh (or 11.6%) compared to non-RPS states (Upton and Snyder 2017) In California, researchers estimate that solar incentive policies led to an average rate increase of 3–5 cents per kWh, which translates into an annual household bill increase of $124–230 (Borenstein et al 2021) |
| Safety and security | Displacement | Cumulative estimate of displaced population (#), estimate of affected population (#), share of affected population identified as Indigenous (%) | Large hydropower development has resulted in an estimated 40–80 million people displaced worldwide (WCD 2000) Brazil's Belo Monte dam project was projected to displace approximately 20 000 of the 25 000 Indigenous people living adjacent to the Xingu River (VanCleef 2016) Hydropower developments led to approximately 25 million people displaced in India and another 15 million people deprived of land or livelihood without physical displacement, with over 40% of affected individuals belonging to a tribal group (Fernandes 2004) |
| Natural resource security | Change in annual fish harvest (%), change in fish habitat area (%), cumulative estimate of affected population (#) | Annual harvest of four major commercial carp species declined by 50%–70% after the construction of Three Gorges Dam on the Yangtze River (Xie et al 2007) In Washington, large hydropower dams on the Elwha River reduced salmon habitat by 90% (Pess et al 2008) Large hydropower projects may affect an estimated 472 million people living downstream through altered river flows, reduced food security, or loss of ecosystem services (Richter et al 2010) | |
| Conflict and/or violence | Total reported mining-related conflicts (#), share of mining-related conflicts by mineral type (%) | According to data from the International Council for Mining and Metals (ICMM), there were 167 mining-related conflict incidents reported from 2012 to 2013, with 26% of those conflicts associated with aluminum, copper, lead, nickel, and zinc—minerals that are critical to renewable energy technologies (Andrews et al 2016) | |
Table 6. Energy equity metrics for transportation electrification. Each metric is classified by 'Equity Dimension' and 'Indicator' with measurements and examples compiled from the literature.
| Indicator | Metric | Measurement | Example |
|---|---|---|---|
| Health dimension | |||
| Proximity to hazard | Proximity to major roadways | Total population living near roadways (#), proportion of population living near roadways by race/ethnicity (%) | An estimated 3.7% of the US population (11.3 million people) live within 150 m of a major highway; this includes 3.1% of the White population, 5.0% of the Hispanic population, and 4.4% of the Black population (Boehmer et al 2013) |
| Pollutant exposure | Pollutant emissions | Pollutant emissions per vehicle (lbs vehicle−1) | In the PJM interconnection region, vehicle electrification combined with high dependency on existing coal power plants could result in up to 1.2 lbs vehicle−1 of additional annual PM2.5 emissions (Weis et al 2015) |
| Community pollutant concentration and exposure | Relative urinary cobalt concentration, relative blood cobalt concentration | Subjects living within 3 km of a mining area in the Democratic Republic of Congo had urinary cobalt concentrations 43 times higher than the US general population, and a follow up study found that exposed residents had 5.7 times higher blood cobalt concentrations than the nearby control group, while mine workers had 13.1 times higher concentrations (Banza et al 2009, Nkulu et al 2018) | |
| Health outcome | Avoided premature mortality | Cumulative avoided premature mortalities (#), annual avoided premature mortalities (# year−1) | Shifting to 100% EV sales and non-combustion electricity generation could result in 111 000 avoided premature deaths by 2050 (American Lung Association 2022) Electrification of public buses and rail in the United States is estimated to result in 4200 fewer deaths per year due to reductions in criteria air pollutants (Data for Progress 2021) |
| Health monetization | Monetized health benefits or costs | Cumulative health benefits ($), health benefits per mile ($ mile−1) | Shifting to 100% EV sales and non-combustion electricity generation could result in $1.2 trillion in health benefits by 2050 (American Lung Association 2022) Electrification of public buses and rail in the United States is estimated to result in approximately $100 billion in avoided health damages (Data for Progress 2021) US study finds that light-duty vehicle electrification in large metropolitan areas could lead to public health benefits equivalent to 3.4 ¢ mile−1 to 11.5 ¢ mile−1 driven, depending on the region (Choma et al 2020) |
| Access dimension | |||
| Resource availability | Public EV charger availability | Likelihood of public EV charger access (odds ratio), rate of EV chargers per 1000 households | Black and Hispanic majority block groups are 0.7 times as likely to have access to public chargers compared to no-majority reference groups, with the disparity increasing for publicly funded charging stations which are half as likely to exist in Black and Hispanic majority block groups (Hsu and Fingerman 2021) In California, disadvantaged communities have approximately 0.67 public level 2 EV chargers and 0.61 DC fast chargers per 1000 households, compared to non-disadvantaged communities with 0.92 public level 2 EV chargers and 0.13 DC fast chargers per 1000 households (Canepa et al 2019) |
| Home EV charging availability | Proportion of households with parking availability near electrical outlet (%) | Researchers estimate that approximately 50% of US households park a vehicle within 25 ft of an electrical outlet at home (Axsen and Kurani 2012) According to the 2020 RECS, approximately 55% of US households (excluding apartments with five or more units) are able to park a car within 20 ft of an outlet (EIA 2022a) | |
| Resource cost | Up-front technology costs | Cost difference between EV and internal combustion engine models ($) | Recent estimates report that EV models still cost between $8000 more for short-range cars and $21 000 more for long-range SUVs than comparable conventional vehicles (Lutsey and Nicholas 2019) |
| EV charging costs | Relative cost difference between public and at-home EV charging | Public charging is typically 2–3 times more expensive than the per-kWh prices of at home EV charging (Bauer et al 2021) | |
| Technology adoption | EV adoption | Relative EV adoption by income and zip code; income disparity between used EV and ICE vehicle purchasers ($); proportion of purchases by vehicle type and race/ethnicity (%); likelihood of EV ownership by homeownership status; proportion of households owning EVs (%) | Internal combustion engine (ICE) vehicle adoption is approximately two times higher in high-income zip codes than low-income zip codes, but EV adoption in high-income zip codes ranges from 3 to 5.7 times higher (Bauer et al 2021) The median income for households purchasing used plug in electric vehicles (PEVs) in California between 2012 and 2014 was $150 000 compared to $90 000 for used ICE vehicles (Turrentine et al 2018) Black and Hispanic car buyers make up 41% of gasoline vehicle purchases, yet they account for only 12% of EV purchases (Muehlegger and Rapson 2018) Homeowners are approximately three times more likely than renters to own an EV (Davis 2019) In California, less than 0.5% of households in disadvantaged communities (communities affected by combination of economic, health, and environmental burdens according to an index defined by CalEnviroScreen) own electric vehicles compared to 1.7% of households in non-disadvantaged communities (Canepa et al 2019) |
| Program participation | EV rebate allocation | EV subsidy allocation by income and disadvantage score (%), share of EV incentive dollars by income (%) | From 2010 to 2018, the bottom 75% of census tracts (based on median income) in California received only 38% of the total EV subsidies, while the top 12.5% of the most advantaged census tracts (according to CalEnviroScreen scores) received 25% of the total rebate amount (Guo and Kontou 2021) Disadvantaged communities (according to CalEnviroScreen scores) received 77% fewer rebates per 1000 households than advantaged communities (Ju et al 2020) From 2009 to 2012, US taxpayers with adjusted gross incomes greater than $75 000 received approximately 90% of the total federal electric vehicle incentive dollars, and the bottom 80% of US taxpayers received approximately 10% of the federal EV incentives (Borenstein and Davis 2016) |
| EV rebate awareness | Share of households aware of EV rebates (%) | Less than 40% of surveyed low- and moderate-income households in California reported awareness of state rebates to reduce the cost of purchasing EVs (Pierce et al 2020) | |
| Livelihood dimension | |||
| Employment | Number of jobs | Cumulative job losses (#), relative direct labor hours | A recent report found that without significant policy efforts, a shift to 50% BEV sales by 2030 could result in approximately 75 000 lost jobs in the US auto sector (Barrett and Bivens 2021) The California Air Resources Board (CARB) estimates that California's mandate of 100% EV sales by 2035 will result in 64 700 job losses throughout the economy, but there will also be job creation in other sectors which leads to an estimated net loss of 39 800 jobs by 2040 (Lopez 2022) Industry leaders have reported that manufacturing an EV requires 30% fewer hours per unit than manufacturing a traditional gasoline vehicle (Hackett 2017) |
| Workforce representation | Relative share of workers in vulnerable occupations by race and education level (%) | Black workers make up 12.5% of the US economy-wide workforce, but 16.6% of workers in the auto sector, and workers without a bachelor's degree make up 62.2% of the economywide workforce but 74.6% of the auto sector (Barrett and Bivens 2021) | |
| Safety and security | Conflict and/or violence | Proportion of child labor by industry (%), share of mines with children present (%), cumulative child labor estimates (#) | Cobalt, a critical mineral for EV production, is mostly mined in the Democratic Republic of Congo (DRC) where child labor is prevalent in the mining industry. A large-scale survey found that in households reporting child labor, 23% of those children worked in the mining industry, while another survey found that 29% of artisanal mines have children present (Faber et al 2017, BGR 2019) An estimated 40 000 children work in dangerous conditions in the Southern Katanga region (UNCTAD 2020) |
Table 7. Energy equity metrics for fossil fuel infrastructure phaseout. Each metric is classified by 'Equity Dimension' and 'Indicator' with measurements and examples compiled from the literature.
| Indicator | Metric | Measurement | Example |
|---|---|---|---|
| Health dimension | |||
| Proximity to hazard | Proximity of fossil fuel infrastructure | Cumulative population living near FF infrastructure (#), proportion of population compared to proportion of population living near FF infrastructure (%) by race and ethnicity, likelihood of power plant siting by neighborhood grade (%) | In the United States, an estimated 17.6 million people live within 1600 m of an active oil or gas well (Czolowski et al 2017) and an estimated 6.1 million people live within 3 miles of an oil refinery (U.S. EPA 2015) Approximately 5.4 million people live within one mile of an oil or gas well in California, with more than one-third (1.8 million) of these people living in the most pollution-burdened communities according to CalEnviroScreen scores (Srebotnjak and Rotkin-Ellman 2014) In an analysis of fracking wells in Colorado, Oklahoma, Pennsylvania, and Texas, People of Color disproportionately live near fracking wells, with the effect ranging between states. For example, although Black Americans represented 8% of Oklahoma's population, they represented 28% of the population living within 1.5 km of a fracking well (Zwickl 2019) US neighborhoods that were historically 'red-lined' (assigned a D-grade by the US federal Home Owners' Loan Corporation) are associated with a higher risk of power plant siting upwind and within 5 km; these red-lined neighborhoods had a 72% higher likelihood of power plant siting between 1940 and 1969, 20% higher likelihood between 1970 and 1999, and 31% higher likelihood between 2000 and 2019 compared to C-grade neighborhoods (Cushing et al 2023) |
| Density of fossil fuel infrastructure | km of natural gas pipelines/km2 of land | Counties in the highest quartile of the social vulnerability index have a mean density of 7.5 km of pipeline per 100 km2 of land area compared to counties in lowest quartile with a mean density of 4.5 km of pipeline per 100 km2 of land area (Emanuel et al 2021) | |
| Pollutant exposure | Community pollutant concentration and exposure | Reduction in absolute PM2.5 pollution burden (%), relative air pollution exposure between racial/ethnic groups, pollutant concentrations relative to federal guidelines, projected relative PM2.5 exposure across racial and income groups | The retirement of 92 coal-fired power plants in the US from 2015 to 2017 decreased PM2.5 emissions overall, but decreases were not proportional; White subgroups had an 11% reduction in absolute pollution burden compared to a 5% reduction in non-White subgroups (Richmond-Bryant et al 2020) While exposure to industrial air pollution declined on a national scale between 1994 and 2005 in the US, disparities in exposure remained consistent with African Americans still exposed to more than 1.5 times more air pollution than their White counterparts (Ard 2015) A community-based exploratory study measured air quality near unconventional oil and gas production areas and found levels of eight volatile chemicals that exceeded federal guidelines, including benzene by 35–770 000 times background levels, hydrogen sulfide by 90–60 000 times, and formaldehyde by 30–240 times (Macey et al 2014) Without implementing targeted decarbonization policies for the electric power system, high poverty communities and Black communities may face 26%–34% higher PM2.5 exposure over the energy transition compared to the national average; however, certain decarbonization pathways can reduce this inequality faster than others (Goforth and Nock 2022) |
| Occupational pollutant concentration | Pollutant concentration relative to occupational standards (%), pollutant concentration (g m−3) | Exposure to respirable crystalline silica has been identified as an occupational hazard in hydraulic fracturing sites, with over 51% of air samples exceeding OSHA's permissible exposure limit (PEL) and over 83% of samples exceeding the threshold limit value (TLV) recommended by the American Conference of Governmental Industrial Hygienists (ACGIH) (Esswein et al 2013) An analysis of coal mine dust samples in the US found a geometric mean of 0.02 mg m−3 for respirable quartz with over 15% of samples exceeding the federal exposure limit and certain occupations and regions facing higher exposure levels (Doney et al 2020) | |
| Health outcome | Incidence and risk of disease | Relative cancer and subchronic disease risk by proximity, risk of disease associated with exposure (odds ratio) | A risk assessment of a natural gas development in Colorado estimated that residents living within 1/2 mile from wells experience greater health risks than residents living further than 1/2 mile, including 1.67 times higher cancer risks and 10 times higher subchronic non-cancer hazard index (McKenzie et al 2012) In Taiwan, children living in areas with the highest petrochemical air pollution exposure had 1.75 times higher risk of developing leukemia compared to children living in areas with the lowest exposure (Weng et al 2008) In Colorado, children ages 5–24 with acute lymphocytic leukemia were 4.3 times more likely to live near oil and gas wells than children with non-hematologic cancers (McKenzie et al 2017) A community comparison study found that a community living near a retired oilfield in New Mexico was ten times more likely to have a rheumatic disease or systemic lupus erythematosus compared to their unexposed counterparts (Dahlgren et al 2007) |
| Adverse birth outcomes | Change in preterm birth probability with increasing proximity to power plants (%), preterm birth rate associated with power plant retirement (%), change in fertility rates (births per 1000 women) | Oil and gas power plants were found to increase adverse birth outcomes in pregnant women in Florida with each 5 km increase in proximity leading to an increased probability of 1.8%–2.2% for preterm delivery (Ha et al 2015) In California, power plant retirements were associated with a reduction in preterm births from 7.0% to 5.1% within 5 km as well as increased annual fertility rates per 1000 women by eight births within 5 km and two births within 5–10 km (Casey et al 2018a, 2018b) | |
| Avoided premature mortality | Cumulative avoided premature mortalities (#), monthly mortality rate reduction (%), annual avoided premature mortalities (# year−1), share of premature mortality by region (%), historical mortality rates by subpopulation (# per 100 000 people) | Research on decommissioning coal-fired power plants in the Eastern US revealed that a 1 μg m−3 reduction in PM2.5 concentrations leads to a 1.7% lower monthly mortality rate in individuals over 65 years old, or 7.17 fewer deaths per 100 000 per month (Fan and Wang 2020) Decommissioning two coal-fired power plants in Colorado was projected to result in approximately two avoided premature deaths in the region per year due to reduced PM2.5 exposure (Martenies et al 2019) Approximately 92% of deaths related to power plant emissions from 2010 to 2018 occurred in low-income or emerging economies, but models suggest that strategic fossil fuel power plant retirements can improve health outcomes in these regions. In 2030, early retirement could reduce PM2.5-related deaths by 77 000 in China and 136 100 in India compared to a scenario with strong pollution controls and historical retirement trends (Tong et al 2021) In 2018, the US average mortality rate associated with coal power plant emissions was 3.60 deaths per 100 000 people, but there were disparities in mortality rates between population subgroups—for example, lowest income group (3.87) compared to highest income group (3.22), rural communities (5.97) compared to urban communities (3.09), and Black populations (3.88) compared to average US population (3.60) (Mayfield 2022) | |
| Health monetization | Monetized health benefits or costs | Cumulative health benefits ($), annual health benefits ($ year−1) | Decommissioning two coal-fired power plants in Colorado was projected to result in estimated health benefits of $270 million over the remaining lifespan of the plants from 2020 to 2035 (Martenies et al 2019) |
| Access dimension | |||
| Resource availability | FF transition policy or program availability | Presence of just transition legislation by state; proportion of bills including various transition support resources | Researchers surveyed state-level just transition legislation in the US and found that nine states had enacted a total of 16 bills related to the coal transition (Wang et al 2022) Of the 16 transition-related bills across nine states, seven bills included assistance (e.g. worker training and education) for displaced coal workers; seven bills included policies for infrastructure development or reinvestment in coal communities; one bill provided funding that can be used to address the cultural impacts of the coal transition; and three bills included provisions to help communities build local capacity to access these transition support resources (Wang et al 2022) |
| Program participation | Benefits and funding allocation | Proportion of program funding granted by region, project type, and career sectors (%) | Over 75% of funding from the POWER Initiative was allocated to just five states: Kentucky, West Virginia, Pennsylvania, Ohio, and Virginia; 79% of coal counties across the US had no grant recipients (Shelton et al 2022) |
| Decision representation | Community consultation and collaboration | Proportion of transition bills requiring community involvement in decision-making | While 8 of the 16 transition bills include some type of stakeholder advisory group to assist in decision-making, only two bills include specific mandates for public meetings to guide coal recovery (Wang et al 2022) |
| Livelihood dimension | |||
| Employment | Number of jobs | Cumulative jobs (#), job-years (#), sectoral share of total employment by county (%) | Projections for a well-below 2 °C warming scenario estimate that global fossil fuel jobs will decline from today's 12.6 million jobs to approximately 3.1 million jobs by 2050 (Pai et al 2021) A study of coal-fired power plant closures in Adams County, Ohio found that the decommissioning of two facilities would result in more than 1100 lost jobs (Jolley et al 2019) From 2004 to 2016, the shale gas sector in the Appalachian basin supported approximately 469 000 direct and induced job-years (a job for one person over a single year) (Mayfield et al 2019) |
| Distribution of jobs | Proportion of coal mining regions suitable for RE development (%), sectoral share of total employment by county (%) | Only 29% of China's coal mining areas are suitable for solar power generation and only 5% are suitable for wind power generation; nearly all of India's coal mining areas are suitable for solar, and almost none of the areas are suitable for wind. A majority (62%) of US coal mining areas are suitable for solar but only 7% of the areas are suitable for wind; 96% of Australia's coal mining areas are suitable for solar power generation, with around 4% suitable for wind (Pai et al 2020) In the Appalachian basin from 2004 to 2016, the share of shale gas employment ranged from less than 1% of total employment in urban counties to over 60% of total employment in rural and high-producing counties (Mayfield et al 2019) | |
| Compensation | Median hourly wage ($ h−1) | While natural gas and coal employees have a median hourly wage of $30.33 and $28.69, respectively, wind and solar employees are at $25.95 and $24.48 (NASEO, EFI and BW Research 2021) | |
| Union membership | Proportion of workers represented by a union by sector (%) | Natural gas, oil, and coal electricity generation have higher rates of union representation (16%–17%) than solar and wind (10%–11%). However, fuel extraction, mining, and processing have lower rates of unionization ranging from 7% for oil and gas to 12% for coal (Herschell et al 2022) | |
| Wealth | Government revenue | Annual government revenue ($ year−1), change in revenue (%), cumulative lost tax revenue ($), annual lost tax revenue ($ year−1) | Fossil fuels generated $138 billion in annual US government revenue from 2015 to 2020, and these revenues will decline 16%–80% by 2050 depending on the transition scenario (Raimi et al 2022) A study of coal-fired power plant closures in Adams County, Ohio found that the decommissioning of two facilities would result in $8.5 million in lost tax revenue for local governments (Jolley et al 2019) Projections of decarbonization pathways for California's oil sector from 2020 to 2045 estimate annual tax revenue losses for counties ranging from less than $1 million up to $27 million compared to a business as usual scenario (Deschenes et al 2021) |
Table 8. Energy equity metrics for residential building decarbonization. Each metric is classified by 'Equity Dimension' and 'Indicator' with measurements and examples compiled from the literature.
| Indicator | Metric | Measurement | Example |
|---|---|---|---|
| Health dimension | |||
| Proximity to hazard | Household fuel usage | Total households using natural gas cooking (#), proportion of households using natural gas cooking (%), total households using solid fuels for cooking (#) | According to the 2020 RECS, approximately 47 million US households (38%) use natural gas for cooking (EIA 2022a) Globally, approximately 2.6 billion individuals rely on solid fuels for cooking (IEA et al 2021) |
| Pollutant exposure | Household pollutant concentration and exposure | Percentage of households exposed (%), change in personal pollutant exposure (%) | Models estimate that in homes using residential natural gas cooking burners without venting range hoods, approximately 62% of occupants are exposed to NO2 levels that exceed acute health-based standards (Logue et al 2014) In a randomized trial in Guatemala, replacing indoor open wood fires with improved chimney wood stoves reduced CO concentration levels by 90% within kitchens and reduced personal CO exposure by 52% for children and 61% for mothers (Smith et al 2010) |
| Pollutant emissions | Pollutant emissions per unit of energy (g J−1) or per unit of time (g h−1) | Natural gas stovetops emit approximately 21.7 ng NOx per joule during use, and in homes without range hoods or adequate ventilation, emissions can exceed the 1 h national standard (100 ppb) in just a few minutes of use (Lebel et al 2022) | |
| Health outcome | Incidence and risk of disease | Proportion of asthma cases attributable to gas stove use (%), increased asthma risk associated with gas cooking (%), disability-adjusted life years (DALY) | An Australian study determined a population attributable fraction that associates 12.3% of Australian childhood asthma cases with gas stoves, which corresponds to 2756 disability-adjusted life years (Knibbs et al 2018) A meta-analysis of 42 studies estimated that children exposed to gas cooking had a 32% increased risk of having current and lifetime asthma (Lin et al 2013) There are approximately 2.3 million deaths and 91 million disability-adjusted life years attributed each year to associated household air pollution from solid fuels (Murray et al 2020) |
| Avoided premature mortality | Cumulative avoided premature mortalities (#), annual avoided premature mortalities (# year−1) | The transition from natural gas to electric appliances in California could result in approximately 354 fewer deaths per year (Zhu et al 2020) Intensive energy efficiency improvements for buildings throughout the US could lead to a projected 1800–3600 annual avoided premature mortalities by 2050 (Gillingham et al 2021) | |
| Avoided morbidity | Annual avoided bronchitis cases (# year−1) | The transition from natural gas to electric appliances in California is estimated to result in approximately 900 fewer cases of bronchitis annually (Zhu et al 2020) | |
| Health monetization | Monetized health benefits or costs | Cumulative health benefits ($), annual health benefits ($ year−1) | The transition from natural gas to electric appliances in California is estimated to result in approximately $3.5 billion in monetized health benefits per year (Zhu et al 2020) |
| Access dimension | |||
| Resource availability | Energy efficiency measure availability | Proportion of stores selling energy efficient light bulbs by neighborhood poverty level (%); relative likelihood of landlord installing energy efficiency measure between rental and owner-occupied properties (%); difference in number of energy efficiency measures by building type and home ownership status (#) | In Wayne County, Michigan, LED light bulbs were available in 91% of stores located in neighborhoods with the lowest poverty levels compared to 57% of stores located in neighborhoods with the highest poverty levels (Reames et al 2018) Landlords are approximately 10% less likely to employ caulking, weather stripping, and multi-pane windows in their rental properties compared to owner-occupiers (Melvin 2018) In 2009, multifamily rental units occupied by low-income households in the United States had approximately 4.7 fewer energy efficiency features (e.g. appliances, HVAC systems, building features) than their counterparts, which equated to between $200 and $400 per year in potential energy savings (Pivo 2014) |
| Resource cost | Energy efficiency measure cost | Relative cost of energy efficiency measures across communities ($), cost difference of efficiency upgrades across communities | In Wayne County, Michigan, neighborhoods with the highest poverty levels had a mean LED light bulb price of $7.87 compared to a price of $5.20 in neighborhoods with the lowest poverty levels, and the mean price difference between inefficient (IHL) and efficient (LED) light bulbs was $6.24 compared to just $3.10 in neighborhoods with the lowest poverty levels (Reames et al 2018) |
| Technology adoption | Energy efficiency measure adoption | Relative energy efficiency measure adoption by home ownership status (%) | Renters are less likely to report having energy-efficient refrigerators (−6.7%), dishwashers (−9.5%), and lighting (−4.9%) compared to homeowners (Davis 2012) |
| Program participation | Energy efficiency (EE) program participation | Participation rates in EE programs by income (%), relative likelihood of EE program participation | Low-income households have disproportionately low participation rates in energy efficiency (EE) programs, with the exception of free or subsidized light bulb programs. 1.6% of low-income households (LIH) received tax credits for new efficient appliances/equipment compared to 11.8% of high-income households (HIH), and 4.9% of LIH received free or subsidized efficient light bulbs compared to 4.6% of HIH (Xu and Chen 2019) In the US, heads of household with at least a bachelor's degree were 8 percentage points more likely to receive some type of energy efficiency assistance than those without a high school degree (Pigman et al 2021) |
| Livelihood dimension | |||
| Employment | Number of jobs | Job years (#), full-time equivalent jobs (#) | Decarbonization of Los Angeles' existing residential building stock could create between 261 000 and 389 000 job years (full-time job for one person for 1 year), and investment in decarbonizing the city's affordable housing over 10 years could create 4600–7400 FTE union construction jobs per year (Jones 2021) |
| Energy security | Energy insecurity | Share of households reporting energy insecurity pre and post energy efficiency program (%), relative risk ratio (RR) of experiencing energy insecurity by race, immigration status, and other factors, the difference between the highest and lowest median household inflection temperatures across income groups (°F or °C) | In households that participated in the US Weatherization Assistance Program (WAP), a low-income energy efficiency program, 75% reported difficulty paying their utility bills before receiving WAP assistance compared to 49% after receiving WAP assistance (Tonn et al 2014) Among low-income households with children, the relative risk ratio of experiencing energy insecurity (spending more than 10% of household income on utility expenses) is 2.11 for native-born Black families compared to native-born White families (Hernández et al 2016) In an Arizona study, researchers evaluated the differences in household inflection temperatures between income groups and estimated the energy equity gap to be between 4.7 °F and 7.5 °F (Cong et al 2022) |
| Energy consumption | Changes in electricity consumption across income and racial groups (%) | COVID-19 mitigation measures in Arizona and Illinois increased residential electricity consumption by 4%–5% while decreasing commercial electricity consumption by 5%–8%; in Arizona, low-income non-White populations had a 9.69% increase in electricity consumption, and low-income White populations had a 3.69% increase (Lou et al 2021) | |
| Energy expenditures | Annual energy cost changes ($ year−1), annual household energy savings ($ year−1) | A 15% reduction in gas customers by 2030 could result in an average $30 annual bill increase, a 40% reduction by 2040 could result in an average $120 annual bill increase, and a 90% reduction by 2050 could result in an average $1600 annual bill increase for remaining gas customers (Davis and Hausman 2022) A new construction electrification mandate would have a financial impact of less than $300 annually on average for warm states, but that impact increases to $1000+ annually for households in cold states (Davis 2021) Targeted energy efficiency improvements in US single family households below 200% of the federal poverty level could result in an average of $670 in annual household savings, which equates to about 1 exajoule of annual primary energy savings (Wilson et al 2019) | |
| Utility disconnections | Increase in utility disconnections (%), utility disconnection rates across zip codes by race and ethnicity (%) | Utility disconnections in California rose 64% from 2010 to 2016 and disconnections in Texas tripled from 2006 to 2016 (Verclas and Hsieh 2018) SoCal Edison's service territory is approximately 33% White, but the 20 zip codes with the highest shutoff rates are made up of less than 17% White customers. Latinos comprise 45% of the service territory but represent 63% of the population in the most affected zip codes, and Black residents represent 18% of the population in zip codes with the highest disconnection rates but only comprise 6% of the service territory (Sandoval and Toney 2018) | |
| Safety and security | Displacement | Difference in average rent increase by renovation type (%), share of households facing rent increases due to energy efficiency renovations (%), proportion of tenants displaced from rent increases due to energy efficiency renovations (%) | In Sweden between 2013 and 2019, multifamily housing renovations with large energy performance improvements were correlated with increased cost burdens for tenants (3–6 percentage points higher rent increases) than renovations without energy performance improvements (von Platten et al 2022) A case study of 10 retrofitted multifamily buildings in Germany found that despite a 70% reduction in energy consumption, more than 50% of the households faced increased costs due to rent increases (Weber and Wolff 2018) Building renovations in Sweden have been linked with rent increases and increased displacement, with approximately 25% of tenants moving out from renovated apartments compared to 14% from non-renovated apartments (Baeten et al 2017) |
4.1. Renewable energy deployment
All low-carbon energy transitions must be coupled with widespread renewable energy development to successfully reduce emissions. Current global installed capacity of renewable energy is approximately 3400 GW (IRENA 2023), and researchers estimate that achieving net-zero emissions by 2050 will require renewables share of total energy generation to grow from 29% in 2020 to 88% in 2050, with annual capacity additions of wind and solar reaching 1020 GW by 2030 (IEA 2021b). Increased deployment of renewable energy will have benefits in the form of avoided health impacts and related costs, but this transition also has a documented history of inequities across the three dimensions.
4.1.1. Health
Widespread adoption of renewable energy has far-reaching health benefits through reduced fossil fuel production and decreased emissions, but there are also documented health concerns associated with mineral extraction and project development. Although these health benefits stem from the fossil fuel infrastructure phaseout transition, they are also partly driven by the deployment of renewable energy technologies and standards. As such, there is some expected overlap between metrics within these two inter-related transitions. Health benefits associated with renewable energy deployment have been evaluated using past or projected health outcomes such as avoided premature mortality or hospital visits (Barbose et al 2016, Millstein et al 2017), as well as monetized estimates of health benefits in total dollars, dollars per ton of CO2 reduced, or dollars per unit of renewable energy deployed (Barbose et al 2016, Buonocore et al 2016, Millstein et al 2017, Dimanchev et al 2019). While some communities will benefit from these health benefits, others will face additional or new health risks. The transition to renewable energy entails increased demand for mineral resources such as copper and silicon for solar PV and copper, zinc, and rare earth elements for wind turbines, and these minerals pose health risks through occupational exposure, water contamination, and hazardous waste production (IEA 2021c). These effects have been quantitatively evaluated using metrics (table 5) such as pollutant concentrations in workplace settings and indices that estimate relative health risk between mineral production processes (Hines et al 2013). Communities may also face adverse health outcomes due to the development of renewable energy projects, including increased levels of environmental toxicants following reservoir flooding for hydropower and worse sleep quality or mental health associated with noise pollution from wind turbine operations. These effects have been evaluated using projected community exposure and pollutant concentrations in waterways post-flooding compared to baseline levels (Calder et al 2016), reported sleep disturbance across sound pressure levels (Bakker et al 2012), and sleep quality and mental health index scores (Nissenbaum et al 2012).
4.1.2. Access
Renewable energy technologies and incentives have not been distributed evenly across communities. There are regional differences in resource costs that can affect access and adoption of renewable energy, such as country-specific levelized costs of electricity from utility-scale solar PV across Africa (Mulugetta et al 2022). Research also demonstrates that residential solar PV adoption skews toward wealthier, whiter, and more advantaged communities. Although recent reports show that the solar PV adoption income skew is gradually decreasing (Forrester et al 2022), other studies reveal that disparities by race and ethnicity persist even when controlling for income or homeownership (Sunter et al 2019). To evaluate equity in technology adoption, scholars have used metrics (table 5) that combine technology penetration rates with demographic data to identify disparities in adoption across income groups (Forrester et al 2022), race/ethnicity (Sunter et al 2019), and according to disadvantage indices like CalEnviroScreen (Lukanov and Krieger 2019). Renewable energy incentives and low-income programs exist to increase adoption, but standard incentives have disproportionately benefited higher income individuals and low-income programs do not distribute the same amount of incentives. Inequities in program participation have been evaluated using metrics that examine availability of programs, incentive allocation by tax filing status and income (Borenstein and Davis 2016), and share of low-income incentives compared to total incentives (Paulos 2017, O'Shaughnessy et al 2021).
4.1.3. Livelihood
The development of utility-scale renewable energy has been shown to affect the physical, emotional, and economic well-being of nearby communities. These issues have been particularly visible with large hydropower projects in developing countries, which have contributed to mass displacement and disruption of local populations' way of life, especially Indigenous communities. While the cultural and emotional damage is difficult to quantify, researchers have evaluated the effects of displacement from energy infrastructure development using metrics such as estimates of displaced populations (WCD 2000), amount or percentage of population identified as Indigenous (Fernandes 2004, VanCleef 2016), and estimates of populations affected without physical displacement (Fernandes 2004) (table 5). Large hydropower projects also affect the livelihoods of nearby communities through disruption of ecosystems and natural resources, which researchers have quantified using metrics such as reduced fish habitat (Pess et al 2008) and changes in annual fish catch or population (Xie et al 2007).
Despite common promises of economic development, some renewable energy projects have had negative economic impacts such as rural employment losses, unstable employment opportunities, and even decreased property values. These economic effects have been evaluated using metrics that examine regional employment pre- and post-energy development and employee turnover rates (Calvi et al 2020), as well as property value estimates compared to control groups (Dröes and Koster 2016, 2021, Gaur and Lang 2020, Jarvis 2021). The transition to renewable energy sources may indirectly affect energy security through electricity bill increases or rate changes. Incentive policies allow solar PV customers to offset a large portion of their electric bills with solar generation, which ultimately disrupts the revenue of investor-owned utilities. Lost revenue from these solar customers is passed on to ratepayers without solar systems, leaving them to bear the cost of operating the grid—often referred to as cost shifting. Researchers have evaluated these effects using metrics such as average rate increase ($ kWh−1) or annual household bill increases ($ year−1) (Borenstein et al 2021). As solar adoption skews toward higher-income and white households, lower-income and BIPOC households are faced with increased costs and higher energy burdens.
4.2. Transportation electrification
The transportation sector is one of the largest contributors of GHG emissions across the world, making transportation electrification a crucial element of the low-carbon energy transition. To achieve global net-zero emissions by 2050, studies estimate that EVs must account for over 60% of light-duty vehicle sales and 30% of heavy truck sales by 2030, with EVs reaching a share of 86% of light-duty vehicle stock and 59% of heavy truck stock by 2050 (IEA 2021b). While mass transport electrification will certainly have environmental and health benefits, early stages of the transition indicate potential equity effects that must be considered.
4.2.1. Health
While transportation electrification projections generally predict net positive health outcomes, the benefits vary based on factors such as region, population distribution, electricity generation portfolio, and transition timeline. For example, researchers found that a transition to EVs combined with a high dependence on existing coal power plants could result in increased PM2.5 emissions, at least until the electric grid gets cleaner (Weis et al 2015). As power plants are often sited in disadvantaged communities, this outcome could exacerbate existing injustices. Researchers have evaluated health benefits and disbenefits using metrics (table 6) including emissions estimates (Weis et al 2015), avoided premature mortality (Data for Progress 2021, American Lung Association 2022), and monetized health benefits (Choma et al 2020, Data for Progress 2021, American Lung Association 2022). As EV manufacturing grows, demand for lithium and cobalt is expected to increase exponentially (IEA 2021c), and these minerals are linked with severe injustices, including adverse health and safety risks (Huber and Steininger 2022). For example, cobalt exposure is associated with hard metal lung disease, skin reactions, cardiovascular symptoms, exposure-related oxidative DNA damage, and other severe health impacts (Lauwerys and Lison 1994, Nkulu et al 2018, Du et al 2021). To evaluate exposure, researchers have used blood and urine concentrations of minerals in workers and nearby communities (Banza et al 2009, Nkulu et al 2018).
4.2.2. Access
Access to electric transportation resources is distributed unequally across race, ethnicity, and income level. Although EV costs have declined in recent years, EV models still cost significantly more than comparable conventional vehicles (Lutsey and Nicholas 2019), and high up-front costs ultimately affect EV adoption, which has largely skewed toward high-income populations. Disparities in technology adoption persist beyond income, with renters, Black car buyers, and Hispanic car buyers all being underrepresented in EV purchases. These distributional inequities have been evaluated with metrics (table 6) such as EV adoption rates by income (Bauer et al 2021), median income of used vehicles purchasers (Turrentine et al 2018), and EV ownership rates by socioeconomic and demographic variables (Muehlegger and Rapson 2018, Davis 2019). While rebates and income tax credits are available to help offset the costs of EVs, these programs have not benefited the communities who need them most. Researchers have evaluated inequities in program participation using incentive allocation across income levels and according to disadvantage indices (Borenstein and Davis 2016, Ju et al 2020, Guo and Kontou 2021). EV adoption requires access to charging infrastructure, and many renters, residents of multifamily buildings, and some homeowners do not have the option to charge an EV at home. Limited availability of home charging options results in a reliance on public EV charging stations, but public charging is typically more expensive than home charging and there are fewer public charging options available in disadvantaged communities. These disparities in resource availability and cost have been evaluated using metrics such as share of homes with access to electrical outlets near parking spaces (Axsen and Kurani 2012), public versus home charging costs by unit of energy (Bauer et al 2021), and likelihood of public charging station access across census block groups by income, race/ethnicity, and proportion of multi-unit housing (Hsu and Fingerman 2021).
4.2.3. Livelihood
The transition to electric transportation has the ability to significantly affect economic well-being. An unmanaged transition will result in job losses in the traditional auto sector, and in the US, this could disproportionately affect Black workers and workers with less than a bachelor's degree as these groups are overrepresented in the auto sector (Barrett and Bivens 2021). Researchers have evaluated employment statistics using metrics (table 6) including differences in manufacturing hours per vehicle (Hackett 2017), labor projections according to EV sales, and employment demographic data to identify affected groups (Barrett and Bivens 2021). Public transportation must also undergo mass electrification, which will require significant amounts of funding—if agencies use fare increases to finance the transition, People of Color and low-income individuals would be disproportionately affected, as they are more likely to rely on public transportation (Taylor and Morris 2015). The transition to EVs will require massive amounts of critical minerals, with projections estimating lithium and cobalt production increases by up to 500% to limit warming to two degrees by 2050 (Hund et al 2020). Mineral mining is linked with significant human rights abuses that are difficult to quantify, but researchers have attempted to evaluate equity using metrics such as child labor estimates (UNCTAD 2020) and percentage of children engaged in child labor by country (UNICEF 2018).
4.3. Fossil fuel infrastructure phaseout
Economy-wide decarbonization will require existingfossil fuel infrastructure to be retired, retrofitted with carbon capture technology, or converted to clean fuels at a massive scale. Estimated GHG emissions from existing and planned fossil fuel infrastructure are approximately 850 GtCO2, which already exceeds the remaining cumulative emissions (510 GtCO2) in pathways that limit warming to 1.5 °C (Dhakal et al 2023). Fossil fuel infrastructure phaseout is under way as more renewable energy technologies are deployed, but the transition needs to accelerate rapidly to meet emissions reduction targets. Phasing out fossil fuels will undoubtedly have significant benefits such as reductions in air and water pollution and improved public health, but it may also result in the loss of economic opportunities for employees and nearby communities.
4.3.1. Health
Fossil fuel production, refinement, and power generation are associated with a collection of reported health impacts, including cancer, liver disease, neurological symptoms, adverse birth outcomes, asthma, and other respiratory illnesses (McKenzie et al 2012, Fleischman et al 2016, Casey et al 2018a, 2018b, Johnston et al 2019), and these burdens have disproportionately affected People of Color, Indigenous, and low-income communities. Equity effects have been evaluated using proximity to hazards with metrics (table 7) such as total population living within a certain distance of fossil fuel infrastructure (Czolowski et al 2017), statistical associations between proximity and demographic characteristics (Zwickl 2019), and natural gas pipeline density across social vulnerability levels (Emanuel et al 2021). Proximity to fossil fuel infrastructure is directly linked with pollutant exposure, which has been evaluated using pollutant air concentration levels compared to occupational health standards and federal guidelines (Esswein et al 2013, Macey et al 2014). Although the phaseout of fossil fuels will mitigate many adverse health effects, these benefits are not guaranteed to be distributed equitably. For example, a study of coal-fired power plant retirements in the US found that while PM2.5 emissions decreased overall, the decreases were not proportional across demographics (Richmond-Bryant et al 2020). These disparities have been evaluated using estimates of pollution reductions across subgroups, measures of absolute and relative pollution burdens, and exposure differences across race and ethnicities (Ard 2015, Richmond-Bryant et al 2020, Goforth and Nock 2022).
Studies have shown associations between fossil fuel infrastructure and increased health risks or adverse outcomes including cancer risks, disease prevalence, adverse birth outcomes, and many others. These effects have been assessed using metrics such as projected cancer risks for individuals living close to gas or oil wells compared to those living further (McKenzie et al 2012), prevalence of rheumatic diseases within oil exposed communities compared to unexposed communities (Dahlgren et al 2007), and associations between oil and gas proximity and childhood cancer prevalence or risk (Weng et al 2008, McKenzie et al 2017). Fossil fuel operations have also been correlated with low birth weight, preterm birth, congenital heart defects, and other adverse birth outcomes. These effects have been evaluated with metrics that compare maternal residential proximity to oil and gas operations with various adverse birth outcomes (Ha et al 2015, Tran et al 2021) as well as measures of reduced adverse outcomes following power plant retirements (Casey et al 2018a, 2018b). The public health benefits of fossil fuel phaseout are often assessed using metrics such as change in mortality rates, cumulative avoided premature mortality, and total monetized health benefits (Martenies et al 2019, Fan and Wang 2020). To make these metrics more applicable, data can be disaggregated across demographic and socioeconomic groups. For example, Martenies et al (2019) found that projected health benefits were greatest in areas with lower median incomes, lower educational attainment, and lower employment rates.
4.3.2. Access
Fossil fuel dependent communities have experienced, and will likely continue to experience, disproportionate social, cultural, and economic impacts resulting from the phaseout or decline of local industrial operations. Certain resources, such as government programs and services, can mitigate these effects, but the availability and distribution of these resources has not always been equitable. For example, a report assessing state legislation related to coal transition found that only a handful of US states have enacted bills that support coal communities, and the bills vary in the type of resources they offer (Wang et al 2022). These resources include worker training and education benefits, coal site reclamation, reinvestment programs, and even programs to help build local capacity to access transition support resources. Disparities in resource availability have been evaluated using metrics (table 7) such as the proportion of bills or states that offer a particular resource. Similarly, decision representation has been evaluated using the proportion of bills that require some type of community consultation and collaboration. Some studies have started to examine the implementation of programs that support fossil fuel dependent communities, particularly within the coal transition. One example is the Partnerships for Opportunity and Workforce and Economic Revitalization Initiative that was designed to assist communities affected by the decline in coal mining and the retirement of coal-fired power plants, which ran from 2015 to 2020. Researchers have since examined the distribution of program resources using metrics such as proportion of total funding granted by region, project type, and career sectors (Shelton et al 2022).
4.3.3. Livelihood
Fossil fuel infrastructure phaseout will be accompanied by clear health benefits, but the phaseout will also impact livelihoods of nearby communities, many of which tend to benefit from fossil fuel development through increases in wages, new job creation, and local tax revenue (Weber 2012, Maniloff and Mastromonaco 2017, Raimi et al 2022). Metrics (table 7) commonly used in energy transition research include net number of jobs or job-years, which models predict to be positive due to increases in renewable energy and efficiency related jobs (Kammen et al 2004, Wei et al 2010), as well as estimated regional or global job losses (Jolley et al 2019, Pai et al 2021). However, these metrics at an aggregated level do not account for the distributional impact of fossil fuel job losses based on geography, replacement opportunities, and skill transferability. Researchers have assessed the possibility of replacing coal jobs with local renewable energy jobs by calculating the share of a region's coal-mining areas suitable for solar or wind power, finding that while many coal regions are suitable for renewable energy development, others are not (Pai et al 2020). Beyond geographic constraints of job replacement, median hourly wages and unionization rates in the fossil fuel industry are consistently higher than their renewable energy counterparts (NASEO, EFI and BW Research 2021, Herschell et al 2022). In addition to employment impacts, fossil fuels are a major source of government revenue. Specific impacts have been evaluated using estimates of government revenue generated by fossil fuels (Raimi et al 2022), decline in revenue after power plant closures (Jolley et al 2019), and projected tax revenue losses by county according to various transition scenarios (Deschenes et al 2021).
4.4. Residential building decarbonization
To achieve significant reductions in GHG emissions, decarbonization of power systems must be coupled with building decarbonization. This transition will rely on the implementation of EE measures combined with end-use electrification—the transition from fossil fuel to electric appliances and technologies (Steinberg et al 2017, Ebrahimi et al 2018, Williams et al 2021). The International Energy Agency estimates that achieving net-zero emissions by 2050 will require all new buildings to be 'zero-carbon-ready' by 2030 and at least 2.5% of existing buildings to be retrofitted each year from 2030 to 2050, with shares of electric and energy efficient appliances steadily increasing (IEA 2021b). With increasing electrification, the share of electricity in building energy consumption is projected to increase from 33% in 2020 to approximately 66% by 2050 (IEA 2021b). Although the residential building sector already uses electricity for a large portion of total final energy consumption, there is still a significant need for electrification of common household end-uses including space heaters, water heaters, and cooking appliances (Jadun et al 2017). Residential building decarbonization is critical to achieving a low-carbon future, but there are concerns regarding the distribution of benefits and burdens.
4.4.1. Health
Electrification of cooking appliances has the potential to improve health outcomes associated with indoor air pollution, but electric appliances may not be accessible to the entire population. Research has shown that cooking with natural gas appliances increases indoor air pollution and exposure to PM2.5, NO2, and CO, and these pollutants are correlated with respiratory illness and other adverse outcomes (Nicole 2014, Holm et al 2018, Zhu et al 2020). The health effects of natural gas appliances have been evaluated using metrics (table 8) including population attributable fractions for childhood asthma and disability-adjusted life years (DALYs, Knibbs et al 2018), as well as estimated risk of current and lifetime asthma (Lin et al 2013). Because low-income and Black children have been documented to experience higher rates of asthma (Pate et al 2021), residential electrification has the potential to positively impact historically disadvantaged communities by reducing exposure to indoor air pollutants. Replacing residential natural gas appliances with electric alternatives would also produce co-benefits by reducing outdoor NOx and PM2.5 concentrations, and public health researchers have evaluated those benefits using estimates of avoided mortality, cases of respiratory illness, and annual monetized health benefits (Zhu et al 2020). Although the projected health benefits are significant, electric cooking may not be widely accessible or affordable for many households because electric induction cook stoves are still more expensive than comparable natural gas cook stoves. Globally, 2.6 billion individuals rely on solid fuels for cooking, and the associated household air pollution has significant health impacts that are evaluated using estimates of annual mortality and DALYs (Murray et al 2020, IEA et al 2021). Researchers are calling for the utilization of liquefied petroleum gas (LPG) as a source of cleaner cooking fuel; LPG is a fossil fuel, but its relative affordability, lower indoor air pollutants compared to solid biomass, and relatively small contribution to global GHG emissions makes it a promising option to improve health and justice outcomes (Gill-Wiehl and Kammen 2022).
4.4.2. Access
Decarbonization resources such as efficient lighting options and EE assistance programs are not distributed equally across communities, and there have been disparities in resource availability, cost, and program participation. For example, a study in Wayne County, Michigan found that energy efficient light bulbs are both scarcer and more expensive in low-income urban neighborhoods (Reames et al 2018). Another study found that multifamily units occupied by low-income renters had significantly fewer energy efficient features than their counterparts (Pivo 2014). These inequities have been evaluated using metrics (table 8) such as cost and availability of energy-efficient bulbs by store size and neighborhood poverty level (Reames et al 2018), EE feature availability by income and housing type (Davis 2012, Pivo 2014, Melvin 2018), and EE program participation according to socioeconomic and demographic characteristics (Xu and Chen 2019). There are also disparities in EE at the household level, which indicate a need for EE programs to recognize social barriers. Researchers have evaluated the gap in EE levels by modeling energy consumption and energy use intensity across socioeconomic and demographic variables (Bednar et al 2017). Despite existing inequities, residential utility EE programs have the highest participation rates in single family homes and households with higher education levels, and high-income households have higher participation rates in programs that are not income qualified (Pigman et al 2021). This disparity is not due to a lack of financial incentives for low-income households (LIHs) because researchers have estimated significant potential savings associated with EE improvements in these households (Wilson et al 2019). However, significant barriers such as high up-front costs, split-incentives, and lack of information about EE programs may prevent households from investing in EE improvements.
4.4.3. Livelihood
End-use electrification and associated increases in electricity consumption will likely affect the affordability of energy, with effects distributed based on factors such as geography, homeownership status, and income. Colder states are expected to have a larger financial burden associated with residential electrification, which has been assessed using metrics (table 8) such as projected annual utility costs associated with new construction electrification mandates (Davis 2021). Decarbonization will require a significant scale-up of renewable energy development and infrastructure upgrades, which may lead to increases in electricity prices, disproportionately impacting households that primarily rely on electricity. Increasing utility costs will exacerbate existing inequities, because low-income and households of color already experience higher than average energy burdens and challenges affording energy (Drehobl and Ross 2016). Such disparities have been evaluated using various measures of energy insecurity including the 'energy equity gap' which quantifies differences across income groups in household inflection temperature (i.e. the temperature at which households turn on their space heaters or air conditioners) (Cong et al 2022) and the relative risk of experiencing household energy insecurity by race and immigration status (Hernández et al 2016). Certain energy efficiency initiatives have been deployed to address energy insecurity, and their efficacy has been evaluated using reported household energy insecurity pre- and post- energy efficiency assistance (Tonn et al 2014). Within the broader context of energy security, researchers have used smart meter data to highlight the disparities of certain policies on electricity consumption across racial and income groups (Lou et al 2021). Similar methods could be used to evaluate the impacts of building decarbonization and electrification initiatives on residential energy consumption. Additionally, end-use electrification will inherently impact the natural gas sector and its consumers. If end-use electrification trends follow other renewable technology adoption trends, higher-income households would be among the first to shift toward all electric appliances, leaving LIHs to bear the brunt of the increasing natural gas rates. Natural gas utilities have historically increased prices when their customer base shrinks in order to recover the fixed costs of infrastructure and operations (aka 'cost-shifting'), and this trend is predicted to continue as gas utilities lose customers to electrification (Davis and Hausman 2022). These effects have been evaluated using projected changes in annual gas bills according to various customer reduction scenarios (Davis and Hausman 2022).
Increased utility costs also have the potential to affect household utility disconnections, which can be used as another metric to indicate energy insecurity. Despite limited data, researchers have shown significant regional, racial/ethnic, and socioeconomic disparities in utility disconnections. These effects have been assessed using metrics such as percent change in statewide disconnections (Verclas and Hsieh 2018), utility disconnection rates across unemployment and income levels (White 2017), and zip code level utility disconnection rates according to demographic variables (Sandoval and Toney 2018). Residential building decarbonization and EE initiatives have also been linked with rising rent costs and subsequent displacement, which scholars have referred to as 'low-carbon gentrification' (Bouzarovski et al 2018). Researchers have evaluated these effects using metrics such as average rent increases (von Platten et al 2022), share of households facing rent increases (Weber and Wolff 2018), and share of tenants relocating (Baeten et al 2017) after residential EE upgrades.
5. Discussion
5.1. Summary and insights
Evaluating equity and justice within energy transitions is fundamentally a context-dependent process. Although the goal is to assess how energy transition policies and programs affect different population groups, approaches vary depending on the context—the energy transition, the characteristics of the population, and most importantly, the history of marginalization, conflict, and injustice in the study region. The methods and metrics applied in a quantitative analysis of equity and justice outcomes of energy transitions depend on this context, the research setting, and the availability of data. Researchers and other stakeholders must navigate these complexities, and a review and classification of metrics used by previous studies provides a variety of metrics to draw from and adapt in future evaluations of equity and justice within energy transitions.
In this review, we present examples of metrics identified from approximately 130 articles and reports that can be used to quantitatively evaluate the distribution of both negative and positive impacts of programs, policies, and infrastructure development in the energy sector. These metrics can be adapted and combined with relevant socioeconomic and demographic data to evaluate and differentiate between impacts across communities and population groups. Whereas some factors such as household income, age, gender, and educational attainment can be similarly applied across regions, others including race, ethnicity, caste, and religion are context and region-dependent. Because a single demographic factor (e.g. income) is often unable to capture the intersectionality of equity issues, evaluations across multiple demographic factors (e.g. income, race, and education level) could more comprehensively assess equity impacts. Another approach is the use of composite indices that designate specific communities as 'disadvantaged' or 'burdened' according to a combination of socioeconomic, health, and environmental factors. Such indices have been developed by the California Environmental Protection Agency for SB 535 (CalEnviroScreen) and the White House for the Justice40 Initiative (Climate and Economic Justice Screening Tool), and they can be used in combination with the metrics presented in this review. The choice of socioeconomic and demographic factors and indices to classify communities and population groups will depend on the context and availability of data.
The design and application of metrics is also highly dependent on context. Metrics applied in previous studies vary significantly across and within sub-transitions, disciplines, and scales. Some metrics are transition-specific, such as the availability of public EV chargers in census block groups by race/ethnicity in the transportation electrification transition. Metrics are also adapted to be relevant to their geographies and local context; for example, availability of solar PV could be limited due to a lack of grid connection in developing regions with low access to electricity versus physical constraints associated with roof space or building type in regions with grid connectivity. Meanwhile, others have been applied across multiple transitions, such as the reduction in air pollution-caused premature mortality due to cleaner infrastructure. Metrics also vary by discipline, with public health literature focusing on health impacts, and economic studies examining employment impacts. Although evaluating equity outcomes in low-carbon energy transitions requires a holistic approach that integrates perspectives from multiple disciplines, few studies have attempted to do so. Additionally, metrics have been applied at different scales, with some measurements occurring at the zip-code or census tract level and others occurring at the state or national level. Moreover, even when studies apply similar metrics to evaluate equity outcomes, there are often differences in how they are designed or implemented, which is demonstrated in tables 5–8. These variations make it challenging for stakeholders to adopt metrics from previous studies and then comprehensively evaluate and compare equity outcomes of programs, policies, and infrastructure development in low-carbon energy transitions.
The aim of our review has been to address these gaps in knowledge and available tools by collating and classifying metrics based on a framework that will enable stakeholders to evaluate equity outcomes of different potential energy transitions pathways. Our analytical framework builds upon recently contributed metric frameworks for measuring equity in renewable energy programs (Energy Equity Project 2022) and electricity infrastructure (Barlow et al 2022). By classifying metrics along three equity dimensions—health, access, and livelihood—and multiple indicators, we provide a classification structure while recognizing the diversity and variability of energy equity metrics. We hope that our analytical framework can act as a starting point for more comprehensive evaluations of equity outcomes in energy transition programs, policies, and infrastructure development. Ultimately, researchers, policymakers, community leaders, and other stakeholders will and should determine the metrics that are most relevant to their context.
5.2. Limitations and challenges related to energy equity metrics
There are several challenges and limitations associated with quantitatively evaluating equity within energy transitions. The first challenge is the inherent subjectivity within the selection, utilization, and reporting of metrics. The choice of energy equity metrics and their application are ultimately driven by researchers and decision-makers, which leads to the possibility of bias, whether intentional or unintentional. For example, an equity assessment of transportation electrification policies in California may account for the health benefits of communities experiencing improved air quality, but ignore the health burdens of communities participating in dangerous mining practices to extract the minerals needed to produce those EVs. Researchers and decision-makers should ideally attempt to evaluate or at least acknowledge the complex tradeoffs between local and global equity, even if such equity analyses at multiple scales face significant challenges (e.g. a lack of supply chain transparency, unavailability of socioeconomic indicators across regions, and other data limitations). Additionally, when decision-makers designing or reporting equity metrics have a vested interest in their outcomes, it may threaten the credibility of the findings (Freidberg 2015). Recognizing and addressing these biases is challenging but critical to avoid incomplete assessments of inequities in energy transitions.
Another limitation is a lack of data availability that may prevent stakeholders from comprehensively assessing equity within energy transitions. For example, because of the structure of electric power markets and varying regional regulations in the US, comprehensive data on nationwide utility disconnections is not available, hindering the assessment of energy affordability and insecurity across the region (Verclas and Hsieh 2018). This type of data at a high spatial and temporal resolution could highlight important patterns and trends that reveal hidden inequities in energy security, especially in evaluating the effectiveness of policies and programs aimed at enabling the low-carbon transition. In scenarios where wider regional data availability is limited, studies have used case-specific empirical data that may not be readily available for different regions or at larger scales. Best practices and metrics from these case-specific studies can be adapted to develop large scale datasets for researchers and stakeholders to evaluate equity within energy transitions.
A related challenge is the limited focus of previous analyses and energy equity metrics on quantifying distributional and recognition injustices, with little attention given to procedural injustices. For example, data on the representation of individuals from historically marginalized communities within electricity utility leadership staff is scarce, which hinders the understanding of procedural injustices and inequities in electric utility decision-making. Because our framework and metrics are based on previous studies, they are largely limited to distributional and recognition justice issues. Expanding the framework and adding new metrics to also evaluate inequities along other dimensions of justice is critical.
Low-carbon energy transitions are expected to deliver both benefits and losses to different communities, and these impacts can occur across different equity dimensions and indicators, making it challenging to compare their equity metrics. For example, retiring a fossil fuel power plant provides health benefits from reduced air pollution but also results in employment losses along the livelihood dimension. One approach to comparing outcomes across dimensions and indicators is by monetizing the benefits and losses, e.g., monetizing premature mortality and morbidity to compare with wage compensation losses. However, challenges remain such as the contestation about the value of a statistical life, an assumption critical for monetizing mortality, and uncertainties about re-employment rates. But in many other cases, monetization of impacts is not possible and comparisons may need to be limited to within an indicator or against well-established benchmarks. While balancing between the benefits and losses for all communities will inevitably prove challenging for policymakers and stakeholders, recognizing the trade-offs across different equity dimensions and indicators can help empower communities to find pathways that address their priorities.
Lastly, while equity metrics can play an important role in quantitatively evaluating equity outcomes of energy transitions, they cannot always capture the complexity of energy justice and equity. For example, consider the Ralco Dam on the Alto BíoBío River in Southern Chile, which was responsible for the displacement of the Indigenous Mapuche/Pehuenche people from their ancestral lands, as well as the disruption of their long held cultural practices and semi-nomadic lifestyle (Orellana 2005). While displacement can be used as a metric to evaluate how many people have been unjustly removed from their land, it is extremely difficult, contentious, and perhaps inappropriate, to try to quantitatively measure the impact of cultural disruption. However, decision-makers can collaborate with stakeholders from affected communities and use their perspectives and values to inform the design of quantitative models or metrics (Baker et al 2021b). To comprehensively evaluate energy justice and equity, qualitative data and personal experiences should be equally prioritized in the energy transition planning process, and researchers and transition planners should actively work to center historically marginalized communities in all stages of decision-making processes from research development through policy implementation and beyond.
6. Conclusion
As the low-carbon energy transition accelerates, policymakers, planners and other stakeholders will increasingly face decisions that will determine how the transition unfolds. Each potential pathway will have different equity outcomes that will affect the wellbeing and livelihoods of individuals, communities, society at large, and local and global ecosystems. To ensure a just and equitable energy transition, stakeholders must be able to identify, evaluate, and address energy inequities associated with transition pathways. To support these efforts, our review identifies a broad range of metrics that have been used to evaluate equity outcomes associated with the low-carbon energy transition. We compiled and classified dozens of metrics across multiple disciplines that stakeholders can use to quantify equity outcomes of energy transitions, track progress on energy justice goals, and support informed decision-making.
Evaluating equity within energy transitions is a complex process that requires an analytical, multi-dimensional approach. To help standardize the process of equity and justice evaluation of low-carbon transition programs and policies, our framework categorizes energy equity evaluation into three key dimensions–health, access, and livelihood–and provides a specific set of indicators for each dimension. Although we provide several different metrics within each indicator that can be used to evaluate equity outcomes, these can be adapted and supplemented as needed. This flexibility allows for a tailored approach to energy equity evaluation that takes into account specific contexts and priorities. Given the urgent need for, and complexity involved in, producing energy equity metrics, an analytical framework such as the one presented in this study can help guide decision-makers to collect relevant data, quantify and evaluate these metrics, and make data-centered decisions to ensure equitable outcomes of energy transition programs and policies.
Data availability statement
No new data were created or analyzed in this study.