

Abstract
Arctic coastal environments are eroding and rapidly changing. A lack of pan-Arctic observations limits our ability to understand controls on coastal erosion rates across the entire Arctic region. Here, we capitalize on an abundance of geospatial and remotely sensed data, in addition to model output, from the North Slope of Alaska to identify relationships between historical erosion rates and landscape characteristics to guide future modeling and observational efforts across the Arctic. Using existing datasets from the Alaska Beaufort Sea coast and a hierarchical clustering algorithm, we developed a set of 16 coastal typologies that captures the defining characteristics of environments susceptible to coastal erosion. Relationships between landscape characteristics and historical erosion rates show that no single variable alone is a good predictor of erosion rates. Variability in erosion rate decreases with increasing coastal elevation, but erosion rate magnitudes are highest for intermediate elevations. Areas along the Alaskan Beaufort Sea coast (ABSC) protected by barrier islands showed a three times lower erosion rate on average, suggesting that barrier islands are critical to maintaining mainland shore position. Finally, typologies with the highest erosion rates are not broadly representative of the ABSC and are generally associated with low elevation, north- to northeast-facing shorelines, a peaty pebbly silty lithology, and glaciomarine deposits with high ice content. All else being equal, warmer permafrost is also associated with higher erosion rates, suggesting that warming permafrost temperatures may contribute to higher future erosion rates on permafrost coasts. The suite of typologies can be used to guide future modeling and observational efforts by quantifying the distribution of coastlines with specific landscape characteristics and erosion rates.
Export citation and abstract BibTeX RIS

Original content from this work may be used under the terms of the Creative Commons Attribution 4.0 license. Any further distribution of this work must maintain attribution to the author(s) and the title of the work, journal citation and DOI.
1. Introduction
Coastal erosion poses great risks to northern communities and infrastructure (Ford et al 2015, Radosavljevic et al 2016, Fritz et al 2017) and is expected to worsen as temperatures rise, sea ice retreats, and storms become more frequent and intense (Jones et al 2009, Irrgang et al 2022, Nielsen et al 2022). Previous analyses of remotely sensed imagery documented erosion of the Alaskan Beaufort Sea coast (ABSC), with an average rate of 1.8 m yr−1 from 1947 to 2012, but shoreline change rates in the region varied from 21.7 m yr−1 of erosion to 10.6 m yr−1 of accretion (Gibbs and Richmond 2017).
Permafrost bluffs erode by thermo-abrasion, development of erosional niches and subsequent block toppling, and/or by thermo-denudation—thawing of frozen ground and slumping of material due to gravity (Aré 1988, Gibbs et al 2019, 2021, Baranskaya et al 2021, Nielsen et al 2022). In general, bluffs subject to block failure experience higher erosion rates, such as the ∼10–20 m yr−1 observed at Drew Point (Jones et al 2018), than bluffs dominated by thermo-denudation (Aré 1988). Erosion rates from thermo-denudation are typically less than ∼1–5 m yr−1 and largely depend on air temperature and ground ice content (Nielsen et al 2022). The dominant erosion mechanism at any location may depend on bluff height, ice content, wave conditions, and water and air temperatures, and variability in these conditions in space and time likely contribute to the variability in erosion rates across the Arctic (Thomas et al 2020, Irrgang et al 2022, Nielsen et al 2022).
Previous modeling suggests that erosion rate is sensitive to the length of the ice-free season, water levels, and wave heights (Overeem et al 2011, Barnhart et al 2014, Gibbs et al 2021). Recent research has highlighted the particular importance of ground ice content, wave exposure, and air temperatures on erosion rates and processes (Baranskaya et al 2021, Frederick et al 2021, Nielsen et al 2022). Attempts to correlate observed erosion rates with conditions such as elevation and ground ice content, however, have yielded few promising results (Lantuit et al 2013, Jones et al 2018), though recent studies suggest both lower elevations and greater exposure to the open ocean may increase erosion rates (Irrgang et al 2022). There remains considerable uncertainty regarding controls on permafrost coastal erosion that limits our ability to predict future rates of change.
In this study, we classify the coastal landscapes of the ABSC using a typology-based approach and explore relationships between historical change rates and landscape characteristics to determine possible controls on erosion rates. Here, we use the term landscape to refer to the terrestrial realm rather than to specific geomorphic units. Given the difficulty in finding clear erosional controls in past studies, we chose to explore a wide range of surface and subsurface characteristics that may explain rates of change. The typological approach allows us to examine relationships between historical rates of shoreline change and surface or subsurface characteristics without assuming monotonic relationships. Our typologies also identify the relative abundance of individual coastal types that may be used to guide both observational and modeling studies.
2. Methods
2.1. Study area
Analyses focused on the ABSC stretching from Utqiaġvik, Alaska to the United States-Canada border (figure 1). For reference, Utqiaġvik is located at 71.2906° N, 156.7886° W. The ABSC is the northern coast of Alaska, open to the Beaufort Sea, which is a marginal sea of the Arctic Ocean. This area has ample source data that characterizes the coastal landscapes from high elevation bluffs to low elevation deltas and lowlands. However, this analysis does not include delta regions because shoreline change rate statistics (Gibbs and Richmond 2017) were not calculated for those areas and these areas lack reliable topographic information. Further, the processes that erode coastal bluffs and high-elevation coasts are fundamentally different than those that cause shoreline retrogradation on a river delta. We therefore focus our analyses on areas included in the Gibbs and Richmond (2017) dataset on shoreline change and exclude river deltas.
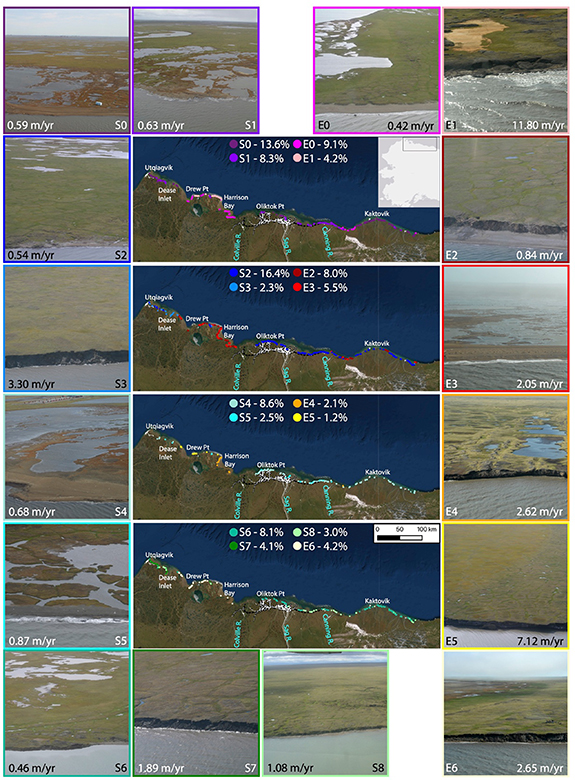
Figure 1. Maps of the ABSC showing the locations and typologies of all points included in the analysis, split into four maps to display geographic distributions and abundances. White and black lines indicate major roads and pipelines, respectively. Base map from ESRI, QGIS. Oblique field photos (Gibbs and Richmond 2009) show examples of each coastal typology and the median shoreline change rate.
Download figure:
Standard image High-resolution image2.2. Datasets and analyses
We compiled available datasets and model outputs (supplemental table 1) that describe the ABSC, including historical long-term erosion rate (∼1950–∼2010; Gibbs et al 2017), elevation (3 m vertical accuracy; Alaska DGGS, 2018), modeled mean annual ground temperature (Nicolsky and Romanovsky 2017), geomorphology (Lara et al 2018), land cover (NSSI 2013), near surface lithology and geology, ecological landscape unit, subsidence potential due to permafrost thaw, segregated ice content (e.g. ice lenses), and massive ice content (e.g. ice wedges) (Jorgenson et al 2014). We used the shore type classification of Gibbs et al (2017), which identified the coast as sheltered by a barrier island or exposed to the open ocean. Shorelines delineated from Gibbs et al (2017) (mapped as instantaneous land–water boundaries) were also used to quantify shoreline orientations, as the orientation of the shoreline relative to incoming waves may be an important control on coastal dynamics. While waves are clearly an important factor in coastal erosion processes, our analysis focuses on the characteristics of the land to explore both erosional controls and coastal archetypes that may be useful in understanding the variability in coastal landscape characteristics. Values from all datasets were assigned to points along the ∼2010 shoreline at a 50 m spacing, using the average value from a 30 m buffer around each point. Points that did not have data available from all 12 datasets were excluded from further analysis. The final dataset consisted of 11 546 points covering over 600 km along the ABSC (Piliouras et al 2023).
The shoreline points were first divided into categories of exposed (33%) and sheltered (67%) as a first order control on coastal change rates (figures S1 and S2). Exposed and sheltered datasets were then analyzed separately using python's scikit-learn agglomerative clustering scheme to determine the typologies (figures S3 and S4, supplemental methods). We used only the datasets describing the shoreline change rates, orientations, ground temperatures, and elevations for the clustering and excluded the categorical data (whose integer values are arbitrary) from the algorithm. The final typologies were based on median values of the distributions for the four continuous datasets. We also include the modes for the categorical datasets that were not used in the clustering to provide additional information about each typology (figures S5 and S6, table 1). In the following sections, we use the terms low, intermediate, and high to refer to coastal elevations of ⩽1 m, 1–4 m, and >4 m, respectively.
Table 1. Characteristics of coastal typologies.
| Typology | # Points in cluster | Fraction of all points | Long term retreat rate (m yr−1) 1940s to 2010s | Short term retreat rate (m yr−1) 1980s to 2010s | Elevation at shoreline (m) | Shoreline orientation (degrees) | Mean annual ground temperature (C) | Lithology | Surficial geology | Massive ice content (%) | Segregated ice content (%) |
|---|---|---|---|---|---|---|---|---|---|---|---|
| E0 | 1053 | 0.091 | −0.42 | −0.47 | 0.42 | −20 | −7.7 | Sand, gravel | Marine, young | <5 | ⩾50 |
| E1 | 485 | 0.042 | −11.8 | −14.35 | 1.81 | 12 | −7.5 | Peat, pebbly silt | Glaciomarine | Oct-30 | ⩾50 |
| E2 | 923 | 0.08 | −0.84 | −1.49 | 0.5 | 35 | −7.9 | Peat, pebbly silty sand | Glaciomarine | Oct-30 | ⩾50 |
| E3 | 637 | 0.055 | −2.05 | −1.09 | 0.58 | 31 | −6.7 | Peat, pebbly silt | Glaciomarine | Oct-30 | ⩾50 |
| E4 | 242 | 0.021 | −2.62 | −3.38 | 1.53 | 128 | −6.9 | Peat, pebbly silt | Glaciomarine | Oct-30 | ⩾50 |
| E5 | 140 | 0.012 | −7.12 | −8.55 | 6.03 | −13 | −8.3 | peat, pebbly silt | glaciomarine | Oct-30 | ⩾50 |
| E6 | 349 | 0.03 | −2.65 | −3.3 | 3.03 | −27 | −8.3 | Peat, pebbly silt | Glaciomarine | Oct-30 | ⩾50 |
| S0 | 1574 | 0.136 | −0.59 | −0.48 | 0.39 | −8 | −8.5 | Peat, pebbly silty sand | Coastal plain | Oct-30 | ⩾50 |
| S1 | 956 | 0.083 | −0.63 | −0.62 | 0.2 | 49 | −6.8 | Sand, gravel | Glaciomarine | Oct-30 | ⩾50 |
| S2 | 1896 | 0.164 | −0.54 | −0.56 | 0.26 | 27 | −7.6 | Sand, gravel | Marine, young | <5 | <50 |
| S3 | 260 | 0.023 | −3.3 | −2.05 | 2.42 | −39 | −8.3 | Peat, pebbly silt | Glaciomarine | Oct-30 | ⩾50 |
| S4 | 995 | 0.086 | −0.68 | −0.58 | 0.21 | −40 | −7.6 | Sand, gravel | Marine, young | <5 | <50 |
| S5 | 286 | 0.025 | −0.87 | −0.55 | 0.39 | −52 | −6.2 | Sand, gravel | Marine, young | <5 | <50 |
| S6 | 932 | 0.081 | −0.46 | −0.56 | 0.29 | 67 | −8.2 | Sand, gravel | Marine, young | Oct-30 | ⩾50 |
| S7 | 473 | 0.041 | −1.89 | −2.14 | 1.64 | 70 | −8.4 | Peat, pebbly silt | Glaciomarine | Oct-30 | ⩾50 |
| S8 | 345 | 0.03 | −1.08 | −0.88 | 1.18 | 23 | −7.1 | Peat, pebbly silt | Glaciomarine | Oct-30 | ⩾50 |
3. Results and discussion
3.1. Typology abundance and representativeness
We found the ABSC was best described by 16 coastal typologies. Table 1 describes finer scale properties of the 16 individual typologies (standard deviations, ranges, and full characteristics are provided in supplemental table ST1), figure 1 shows their geographic distributions, and figure 2 shows a graphical description of each typology using only the four variables used in the clustering analysis.

Figure 2. Scatter plots for each typology showing elevation vs. shoreline orientation, colored by mean annual ground temperature. Circle size scales with erosion rate.
Download figure:
Standard image High-resolution imageThe length of coastline represented by each typology varies greatly. Half of the typologies (E1, E4, E5, E6, S3, S5, S7, and S8) each comprised less than 6% (1/16th) of the coast and collectively represent only ∼22% of the coastline. In contrast, the two most extensive typologies (S0–13.6% and S2–16.4%), both sheltered, comprise a combined 30% of the coastline. The region between Drew Point and Harrison Bay contains nearly all the points belonging to E1, E4, E5, and E6, showing that these typologies are spatially limited and are not representative of the broader ABSC. A literature search on Web of Science suggests that papers about erosion at Drew Point comprise between 4% and 52% (depending on exact search terms used, see supplemental material) of the literature on coastal erosion along the ABSC, despite representing only ∼1% of the coastal types.
The site photos shown in figure 1 highlight the varied environments and erosion mechanisms along the ABSC. For example, S0 and S4 show modest erosion of low-lying bluffs and beaches via littoral processes combined with thermo-denudation of moderately ice-rich permafrost. Typology S7 is characterized by faster erosion associated with thermo-abrasion of moderately high, ice-rich permafrost bluffs with no protective fronting beach. Both E0 and E2 are on exposed coasts but are oriented in an easterly to northerly direction and are therefore sheltered from northwesterly storms known to drive large erosion events (Wiseman et al 1973, Reimnitz and Maurer 1979, Erikson et al 2020). The low retreat rate at these sites is likely driven by a combination of thermo-abrasion and thermo-denudation occurring at low intensity. This contrasts with E5, which is largely restricted to a small area near Drew Point, where rapid erosion of very high, ice-rich permafrost bluffs is dominated by thermo-abrasion and block collapse and further modified by thermo-denudation between storms (Wobus et al 2011, Jones et al 2018).
3.2. Exposed vs. sheltered coasts
Across all typologies, erosion rates on exposed coasts are nearly three times greater than those of sheltered coasts (table 1, figure S2). When compared at the individual typology level we see a similar difference in erosion rates. E3 and S1 are similar typologies that differ only in their erosion rates and being exposed vs. sheltered (table 1, figure 2). This suggests that the higher erosion rates in E3 are largely due to the exposure to the open ocean. If barrier islands were to drown or otherwise disappear, for example due to sand and gravel mining, erosion rates for points in S1 may more than triple as they approach the higher rates of E3. Further, exposed coasts, except for E3, have also exhibited faster erosion rates in recent decades (ca. 1980–2010) compared to long-term rates (ca. 1940–2010; table 1). In contrast, all sheltered typologies except S7 show slower or roughly constant erosion rates in recent decades compared to the long-term rates. This suggests that changes in wave and ice conditions may be driving higher erosion rates along the exposed coast (Baranskaya et al 2021), making exposed areas even more vulnerable to erosion with changing ocean conditions.
Most oil and gas development on the ABSC has occurred between the Colville and Sagavanirktok Rivers, though a pipeline also extends from the Sagavanirktok River east to the Canning River and there is ongoing development west of the Colville River. Most energy infrastructure is currently located on coasts with sheltered typologies, with most having relatively low long-term erosion rates of <1 m yr−1 (table 1, figure 1).
3.3. Relationships between erosion rates and other landscape characteristics
In addition to the influence of barrier islands on erosion rates, our analyses highlight three large-scale results: (i) the highest long-term erosion rates occur on exposed coasts with intermediate heights and north-facing shorelines (figures 2 and 3); (ii) variability in erosion rates decreases with increasing elevation (figures 3(A) and 4); (iii) no single variable is a good predictor of erosion rate.
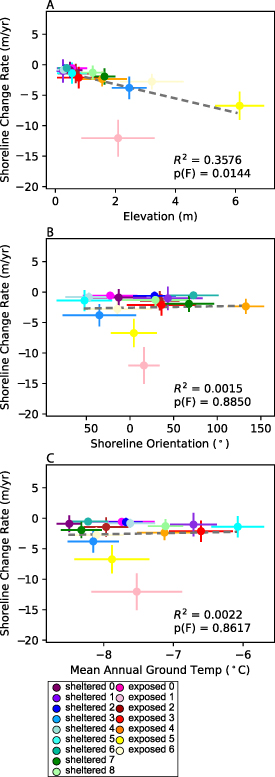
Figure 3. Shoreline change rate as a function of the continuous variables used in the clustering. Negative rates of change indicate erosion. Points are cluster means and bars are one standard deviation. (A) Elevation (m). (B) Shoreline orientation (degrees from north). (C) Mean annual ground temperature at a depth of 2 m (degrees C).
Download figure:
Standard image High-resolution image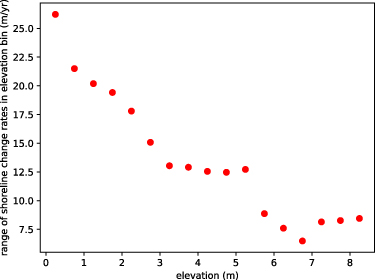
Figure 4. Range of shoreline change rates binned by elevation in 0.5 m elevation bins, showing that the range of shoreline change rates increases as elevation decreases.
Download figure:
Standard image High-resolution imageThe typologies with the lowest erosion rates all had low coastal elevations. The typology with the highest historical erosion rates, E1 (11.8 m yr−1), had intermediate elevations (between 1 m and 4 m), disrupting the trend of increasing erosion rates with increasing elevation (figure 3(A)). Typologies S3, S7, S8, E1 E4, and E6 all have intermediate elevations, but only E1 shows anomalous rates of shoreline change compared to the overall trend, suggesting the E1 coasts are unique compared to the rest of the ABSC. On higher bluffed coasts, only the lower portion of the bluff is regularly impacted by waves or coastal currents, resulting in erosion via thermo-abrasion that typically leads to undercutting, niche formation, and larger block collapse, explaining the trend in figure 3(A). While Irrgang et al (2022) suggested a possible connection between elevation and erosion rate along the Alaskan and Canadian Beaufort Sea coasts, this analysis helps to quantify this relationship for the ABSC. The lack of separation between exposed and sheltered typologies in figure 3(A) suggests that elevation may have a stronger control on erosion rates than barrier islands, but spatial differences in fetch will also affect shoreline dynamics and complicate this interpretation.
Coasts with northeast-facing shorelines have some of the highest erosion rates, particularly for typologies E1 and E5 (figure 3(B)). Waves in this region come predominantly from the east (Nederhoff et al 2022), partially helping to explain this relationship. However, based on figures 3(B) and (a) northeast-facing shoreline is clearly not always associated with high erosion rates, as many other typologies also contain northeast-facing shorelines with substantially lower erosion rates.
Neither exposure nor elevation provides a robust predictor for erosion rate alone (figures 3(A), S1 and S8), but they are both correlated with variability in erosion rate. The range of erosion rates decreases with increasing elevation (figure 4) and is also smaller for sheltered vs. exposed typologies (figure S1). The lower variability in erosion rates of sheltered locations is likely due to the limited wave-driven processes in these environments. The lower variability in erosion rates of higher elevation areas may be a function of how shorelines were delineated: shorelines at higher elevations may be more consistently measuring true bluff erosion, as opposed to mixed bluff and beach erosion for lower elevation shorelines.
Typologies with warmer permafrost (i.e. relatively higher ground temperatures compared to other locations) also have higher erosion rates (table 1, figure 2), suggesting a thermal control on erosion rates since warmer permafrost requires less heat input to thaw and mechanically erode. However, there is no obvious or consistent trend in erosion rate with ground temperatures (figures 3(B) and S8). The two typologies with the highest median shoreline retreat rates (E1 and E5) differ only in their geomorphic landforms, ground temperatures, and elevations (table S1, figure 2). Therefore, since E1 has a higher median erosion rate than E5, and the two typologies otherwise share so many landscape characteristics, we infer that the warmer permafrost temperatures combined with intermediate elevations are associated with even faster erosion in E1 compared to E5 (figure 2).
Figures 2, 3, 5 and S7 highlight the complexity of developing a relatively simple and meaningful conceptual model of erosion rates on the ABSC. As in past studies (e.g. Jones et al 2018), our findings revealed a complicated set of relationships between historical rates of shoreline change and landscape characteristics. The presence or absence of a barrier island is the clearest control and a primary factor in setting rates of change, with sheltered areas having three times slower erosion rates than exposed areas. Barrier islands are widely known to protect the mainland from waves that abrade and erode the coast, making this an intuitive but nonetheless important result. Elevation is a clear secondary control, with higher elevation bluffs eroding faster, likely due to the undercutting and subsequent block toppling that occurs due to thermoabrasion. However, elevation shows only a weak inverse relationship with rate of shoreline change (figures 3(A) and S8), and the linear fit suggests that elevation explains only 22%–36% of the variability. E1 does not conform to this trend, meaning that other factors may diminish or interfere with the control of elevation on shoreline change rate.

Figure 5. Violin plots showing the distributions of shoreline change rates grouped by landscape characteristics. (A) Ecological landscape unit. (B) Maximum thaw settlement potential. (C) Massive ice content. (D) Lithology. (E) Surficial geology. (F) Segregated ice content.
Download figure:
Standard image High-resolution image
Aside from barriers and elevation, all remaining variables we examined may contribute to controlling shoreline change rate, though likely with weaker relationships and only in combination with other characteristics. As shown in figures 3 and 5, the highest erosion rates along the ABSC are associated with north- to northeast-facing shorelines, glaciomarine deposits, peaty silty lowlands, peaty pebbly silty deposits, and high ice contents with high thaw settlement potential. Physically, these associations seem reasonable. Waves are predominantly from the east, so northeast-facing shorelines would be subject to more wave attack. Glaciomarine deposits, peaty silty lowlands, and peaty pebbly silty lithology all imply a particular grain size assemblage, suggesting that deposits with a mixture of peat, silt, and gravel may erode faster than deposits that are all mud or especially sandy. Ice content has been previously thought to control coastal dynamics (Nielsen et al 2022). Higher ice contents may require more heat to melt the ice and erode the coast, but assuming sufficient heat is available, the loss of large amounts of ground ice can lead to much higher erosional rates. Thus, while all of these factors can be explained as potential controls, the distributions of shoreline change rates show that none of these conditions on their own is enough to predict a high erosion rate. The distribution of shoreline change rates for glaciomarine deposits, for example, ranges from highly erosional at rates >15 m yr−1 to net aggradational at rates >5 m yr−1 (figure 5). These results therefore suggest that no single variable (outside of barrier island presence) is a strong predictor of erosion rate, though it does identify a specific set of surface and subsurface conditions that in combination may drive higher rates of erosion on permafrost coasts.
3.4. Implications for the future of permafrost coasts
Our results highlight that the highest erosion rates are generally associated with low elevation, north- to northeast-facing shorelines, a peaty pebbly silty lithology, and glaciomarine deposits with high ice content on exposed coasts. All else being equal, warmer permafrost temperatures may also contribute to faster erosion rates. Comparing long-term to short-term rates of shoreline change also indicates that exposed coasts have experienced an acceleration in erosion rates while sheltered coasts have had roughly constant rates of change. As the Arctic continues to warm, we expect that rising permafrost temperatures (Biskaborn et al 2019), increasing storminess (Nederhoff et al 2022, Parker et al 2022), and a longer open-water season (Crawford et al 2021) will contribute to even faster erosion rates along exposed permafrost coasts. Coastlines protected by barrier islands may remain protected from the increased wave activity, but will still be subject to increased temperatures and thermodenudation. If barrier islands are drowned by sea level rise or destroyed by sand and gravel mining, the loss of these protective barriers may drive a large increase in erosion rates on previously sheltered permafrost coasts. Finally, the highest erosion rates are currently seen on coasts with high ice content. If widespread permafrost degradation were to occur across the North Slope that melted all ice in the shallow subsurface, then we may expect ice to play an insignificant role in future rates of coastal erosion. Thus, while ice content may currently drive spatial variability in coastal erosion rates, its influence may to decrease in the future as more areas thaw and become ice-free.
4. Conclusions
Shoreline change rates on the ABSC are highly variable, and our analysis showed that typologies with the highest erosion rates are not representative of the broader region and are overrepresented in the scientific literature. No single variable, other than the presence or absence of a sheltering barrier island, was found to be a good predictor of erosion rates. Elevation may exert a secondary control, with higher elevation areas having faster erosion rates, but not all typologies conform to this trend. This suggests additional information and analyses are needed to understand the combinations of surface and subsurface conditions that exert the strongest controls on shoreline change. Differences in erosion mechanisms likely play a role, but these also vary with surface and subsurface conditions, making it difficult to untangle the mechanisms from landscape characteristics as controls on erosion. Finally, though barrier islands currently protect many mainland coastal areas from wave energy, our analyses suggest the loss of barriers may result in a tripling of erosion rates in future years, not accounting for additional changes due to increasing water, air, and permafrost temperatures. Better understanding barrier island dynamics and vulnerability is paramount to understanding the future behavior of permafrost coastlines.
Acknowledgments
This research was supported by the Interdisciplinary Research for Arctic Coastal Environments (InteRFACE) project through the US Department of Energy Biological and Environmental Research program. BMJ was also supported by a grant from the U.S. National Science Foundation (OISE-1927553). AEG is supported by the U.S. Geological Survey, Coastal and Marine Hazards and Resources Program.
Data availability statement
The data that support the findings of this study are openly available at the following URL/DOI: 10.15485/1915660.
Supplementary data Table S1 (<0.1 MB XLSX)
Supplementary data (44. MB DOCX)