

Abstract
In recent decades, global warming has had a significant impact on the streamflow across the Tibetan Plateau. As the largest tributary in the upper reaches of the Yangtze River, the Yalong river is known for its abundant hydropower resources, and the world's largest multi-energy complementary base has been built in the Yalong River Basin. However, prudent water resource planning is limited by the lack of long-term, detailed and reliable streamflow records over the Yalong river basin. Here, we develop an October–June streamflow reconstruction for the Yalong River, based on composite tree-ring chronology of Picea likiangensis from seven sampling sites. The reconstruction goes back to 1480 CE, and accounts for 46.5% of the instrumental streamflow variance during 1962–2012. This record indicates that the Interdecadal Pacific Oscillation and the Atlantic Multi-decadal Oscillation were the major contributing factors to streamflow variations. A significant and stable correlation with temperature was found over the past few centuries on the interannual scale. Projections suggest that future climate change may lead to more frequent flood disasters in the Yalong River Basin.
Export citation and abstract BibTeX RIS

Original content from this work may be used under the terms of the Creative Commons Attribution 4.0 license. Any further distribution of this work must maintain attribution to the author(s) and the title of the work, journal citation and DOI.
1. Introduction
Changes in climate models and atmospheric circulations caused by global warming are shown to affect the availability of water resources on the Tibetan Plateau (TP), which are critical for the livelihood of the hundreds of millions of people downstream (Kehrwald et al 2008, Bolch 2017, Nury et al 2022). Changes in the status of the water resources of the TP caused by climate change are a major source of risk and uncertainty to the sustainable socioeconomic development of the surrounding watersheds (Garrote 2017, Kundzewicz et al 2018, Herman et al 2020). As the largest tributary of the upper reaches of the Yangtze River, the hydroclimatic variations in the Yalong River Basin may impact the livelihood of the regional population, including hydropower generation, and even the streamflow variations of the Yangtze River (Wang et al 2019). Additionally, the fourth largest hydropower energy base in China, with a total installed capacity of 11.5 billion kW has been built in the Yalong River Basin (Zhao et al 2022). However, river gauging stations were not installed across most areas of the TP before the 1960s, including the Yalong River Basin, which limits our ability to understand and model the long-term variation of its water resources from hydrological records. However, information on past hydrological variations from proxy data, like tree rings, can help address this problem.
Tree-ring data are regarded as a reliable proxy of long-term climatic and hydrological changes across the TP (Cook et al 2003, Shao et al 2010, Wischnewski et al 2014, Singh et al 2017, Rao et al 2020, Chen et al 2021). Based on tree-ring data from the upper reaches of the Yangtze River, previous studies have highlighted the potential of tree-rings for reconstructing past streamflow variations (Li et al 2018, An et al 2022). Northern Hemisphere temperature model, the Atlantic Multi-decadal Oscillation (AMO) and the Pacific Decadal Oscillation (PDO) are widely regarded as the main factors affecting the hydroclimatic variations in this region (Wang et al 2014, Borgaonkar et al 2018, Lyu et al 2019, Chen et al 2019a, 2019b, Gaire et al 2020). However, the impact of these factors on the hydroclimatology of the TP has not been quantitatively determined, and hence more streamflow records are needed to evaluate the spatiotemporal variation of water resources variability.
Here, we develop an October–June streamflow reconstruction for the Yalong River that extends back to 1480 C.E., based on tree rings of Picea likiangensis, and we then discuss its connection with both Atlantic and Pacific atmosphere-ocean climate variability. Based on the coupled response of tree-ring growth to climate and streamflow for this basin, we used the streamflow reconstruction to quantitatively evaluate past water resources variability during the pre-instrumental period. This new streamflow record is then compared with existing proxy hydroclimatic records from the adjacent regions. Additionally, multi-model ensemble projections of the Coupled Model Intercomparison Project Phase 6 (CMIP6) are applied to compare and evaluate the future streamflow trends and the climate-related risks.
2. Data and methods
2.1. Study area
The study area is located within eastern TP, China, which lies between 26°32' N–33°58' N and 96°52' E–102°48' E, with the watershed area of 128 000 km2 (figure 1(a)). The Yalong River flows through 11 counties, and with the length of 1187 km, it is the largest tributary in the upper reaches of the Yangtze River. The water vapor transport of the basin is influenced by the high-altitude westerly atmospheric circulation and the southwest monsoon (Tian and Fan 2013). According to the instrumental climate records of Graze station, the average annual temperature is 6.9 °C, with an average temperature of 15.0 °C in July and −2.9 °C in January. Average precipitation is 643.64 mm yr−1, and 69% of the annual total precipitation occurs during the monsoon season (June–September) and the wettest month is June (131.8 mm). Streamflow records from Huning station reveal that the monthly streamflow varies greatly, with high flows from July to September (figure S1).
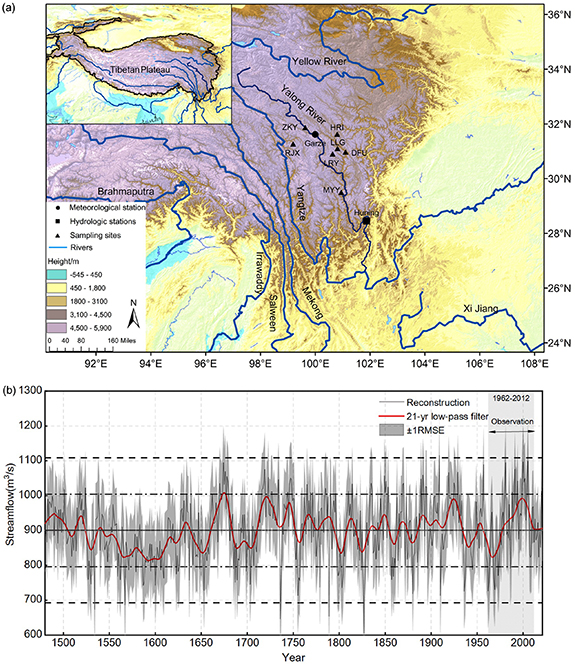
Figure 1. (a) Map showing the location of the study area, sampling sites, meteorological and hydrological stations. (b) Variation of annual and 21 year low-pass filtered October–June streamflow for 1480–2021. The horizontal black dashed lines are ±1 SD and ±2 SD of the reconstructed streamflow.
Download figure:
Standard image High-resolution image2.2. Hydroclimatic and tree-ring data
We selected data from the closest Graze meteorological station to the sampling site, with the elements of mean monthly temperature and precipitation (1962–2012, http://data.cma.cn). Streamflow records from Huning station cover the period of 1961–2012 and were obtained from high-quality monthly natural streamflow datasets (Miao et al 2022). These datasets are available for 330 catchments across China, providing a reliable representation of natural hydrological processes on a large scale. Monthly gridded temperature (Climatic Research Unit (CRU) TS v.4.04) and precipitation (Global Precipitation Climatology Centre (GPCC) v2020) data were downloaded from the Center for Environmental Data Analysis (http://data.ceda.ac.uk/), and gridded runoff data (GRUN1.0) were downloaded at https://doi.org/10.6084/m9.figshare.9228176.
Locations and related information for the sampling sites and the meteorological and hydrological stations are given in table S1. Tree-ring cores of 10 mm diameter were collected from individuals of P. likiangensis, growing in forest that is relatively undisturbed by human activity. Two cores taken from each tree at chest height were collected with an increment borer. After drying, the cores were mounted and polished, and CDendro was used to measure the tree-ring widths to the nearest 0.01 mm. All the tree-ring width data were cross-dated using COFECHA software (Holmes 1983). A negative exponential function and Friedman smoothing were used to detrend each ring-width series to remove non-climatic trends (Fritts 2012). Due to the high correlation (r= 0.40) of the individual series with the master series, all series for the seven sites were used to develop a regional composite chronology using ARSTAN software (Cook 1985). The interval of reliable, chronology is from 1480 to 2021, which was evaluated using the express population signal (EPS ⩾ 0.85) (Wigley et al 1984).
2.3. Statistical methods
Pearson correlation analysis determined the relationship between tree ring index, temperature, precipitation, and streamflow on single and combined month windows from July of the previous year through September of the current year. The spatial correlation between the composite chronology and gridded datasets such as the CRU temperature (Harris et al 2020), GPCC precipitation and GRUN runoff flux (Ghiggi et al 2019) were calculated for 1962–2014. A linear regression model between the predictors (the composite chronology) and the predictand (streamflow) was calculated for the calibration period of 1962–2012. The reliability of the reconstructed model was evaluated via split-sample calibration-verification tests (Meko and Graybill 1995). In addition, several hydroclimate reconstructions were used to verify the reliability of our reconstruction (Li et al 2017, Chen et al 2019a). The 21 year low-pass filtered values of the streamflow reconstruction were used to identify long-term trends and dry periods. To investigate the potential impact of changes in large-scale circulation factors on the streamflow variations, multi-taper method (MTM) of spectral analysis was used to identify any periodicities in the reconstructed streamflow, as proposed by Mann and Lees (1996). Additionally, sea surface temperature anomalies were graphically represented for comparison.
To quantitatively determine the potential causes of streamflow variations, we used the Last Millennium Ensemble Project (CESM-LME) data and the multivariate linear regression approach (Lean and Rind 2008, Imbers et al 2013, Zhou and Tung 2013, Chylek et al 2016, Otto-Bliesner et al 2016, Folland et al 2018). We first extracted the historical streamflow sequence in the Yalong River Basin, under full forcing and single forcing experiments, and then extracted the internal variability of potential drivers like the Interdecadal Pacific oscillation (IPO) and AMO in the full forcing experiment. The individual forcing sequence and the internal variability sequence were standardized and a 21 years filter was applied to eliminate dimensional differences. For a given time t, the regression equation can be written as follows:
The external forcing of anthropogenic aerosol (AERO) was imposed in CESM-LME after 1850, so there were five external forcings in the prediction equation for the reconstruction period: orbital parameters (ORB), greenhouse gases (GHGs), volcanic forcing (VOL), land use and land cover (LULC) and spectral solar irradiance (SSI). The scale factor β and its standard error were calculated using the statsmodels package in Python.
We obtained the surface runoff parameter output of Yalong watershed from 24-model CMIP6 ensemble, and then averaging over models. The period from 1850 to 2015 is designated as the historical simulation period, while the timeframe from 2016 to 2100 is considered the future simulation period. For the future simulation period, we have chosen the SSP245 and SSP585 scenarios to facilitate a comparison of streamflow variations between the future and historical periods. In the initial phase, we assessed the historical simulation period by comparing CMIP6 streamflow data with observed streamflow data spanning the years 1962–2015. The results revealed a strong alignment between the two datasets. Subsequently, to standardize the units for both CMIP6 simulated streamflow data and observed streamflow data, we independently computed the standard deviation and mean values for each dataset during the overlapping period of 1962–2015. Using the standard deviation and mean values derived from the observed data, we converted the units of CMIP6 data to streamflow units (m3 s−1) (Rao et al 2020).
3. Results
3.1. Streamflow variation and climate forcing
The statistical characteristics of the tree-ring series from the Yalong River Basin are presented in table S1. A standard composite chronology dating to 1331 C.E. from the study area was established. Based on the criterion of the expressed population signal ⩾0.85, the valid range of the chronology is from 1480 to 2021. Through the combination of different months, we identified the combinations that yielded the highest correlation coefficients between chronology and streamflow (figure S3). While Yalong River streamflow are not at their peak during this window, streamflow during flat water periods is more likely to reflect the temporal distribution of water resources and changes in the basic demand for water for human production. Accordingly, the reconstruction window was chosen to reflect natural streamflow between October to June.
The reconstruction accounts for 46.5% of the instrumental streamflow during 1962–2012. The statistics evaluation of the reliability of the model is given in table S3. Figure 1(b) shows the reconstructed streamflow of the Yalong River for the past 542 year. For the whole time series, the mean streamflow is 900.68 m3 s−1, the standard deviation is 83.56 m3 s−1 and the root mean square error is 104.03 m3 s−1. To verify the reliability of the reconstructed streamflow, the reconstructed streamflow for the Salween River (Chen et al 2019a) and the southeast TP scPDSI (Li et al 2017) were compared with the streamflow reconstructed in this study, after standardizing all the series. The reconstructed streamflow is significantly correlated with these series. The correlation coefficients for the Salween streamflow and southeast TP scPDSI are 0.355 (n= 512, p< 0.001) and 0.182 (n= 516, p< 0.01) after 21 year low-pass filter, respectively. The low-frequency components of the three sequences are highly consistent (figure S5) (Xing et al 2014, Zhao et al 2023).
Streamflow is a better reflection of regional variations in wet and dry conditions than precipitation, because it is the integration of rainfall, snow and glacier melt water, evapotranspiration and groundwater storage (Pohl et al 2017). The monthly streamflow in figure S1 indicates that the July–September streamflow is the highest three-months streamflow period within the year. The results suggest that water-deficit stress is not the main factor limiting the radial growth of tree rings in the flood season, which may also explain the discrepancy between our reconstructions and the instrumental data for some extreme high-value years (figure S4). The limitation of water deficit stress for tree-ring radial growth is widely observed for various coniferous species on the TP (Li et al 2018, Chen et al 2019b). Spatial correlation of composite chronology with hydroclimatic factors demonstrated the effectiveness of streamflow reconstruction in capturing large-scale regional hydroclimatic variability (figures S2(b)–(d)).
To investigate the factors driving the variation of the Yalong river streamflow, we plotted the sea surface temperature anomalies of the streamflow highest and lowest ten years of the observation period. Figure 2(a) shows a clear negative anomaly in the equatorial eastern Pacific region, and positive anomalies in the low-latitude regions of the Pacific and North Atlantic, suggesting a potential linkage between Yalong River streamflow variations and several large-scale oceanic circulations. To further validate this linkage, we applied MTM spectral analysis to the reconstructed streamflow series and identified several periodicities that are like those of the El Niño-Southern Oscillation, AMO, and IPO (figure 2(b)). Longer periodicities may be caused by changes in monsoon strength driven by changes in solar activity, temperature, and ocean circulation, which in turn affect the streamflow in the Yalong River Basin (Bonev et al 2004, Duan and Zhang 2014). The results are consistent with those of similar studies in the same region (Rao et al 2020, Gaire et al 2022). After applying the 21 year filter, the correlation coefficient between the reconstructed streamflow and the IPO from the large-scale atmospheric circulation factor is −0.13 (n= 304, p< 0.05) (Linsley et al 2008), and the correlation coefficient between AMO and reconstructed runoff is 0.10 (n= 414, p< 0.05) (Gray et al 2004), indicating that streamflow changes are influenced by the IPO and AMO.
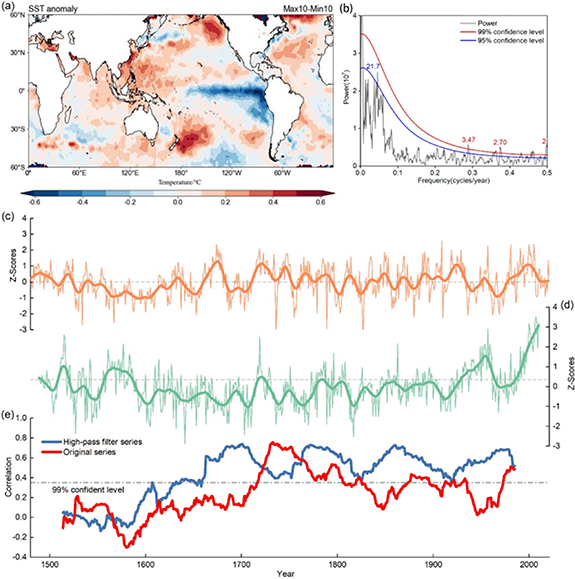
Figure 2. (a) The SST anomaly of the ten years of maximum and minimum of streamflow during the instrumental measurement period (b) multitaper method (MTM), multi-window spectral analysis of the reconstructed streamflow. Comparison of (c) reconstructed streamflow, (d) reconstructed southeast TP temperature (Xu et al 2019), and (e) their moving window (51 year) correlation coefficients of original series and high-pass filter series.
Download figure:
Standard image High-resolution imageA strong linkage is evident between temperature and streamflow. Figures 2(c)–(e) shows the results of a 50 year moving-window analysis of streamflow and temperature in the southeast TP, and their correlation (Xu et al 2019). The correlation between the standardized series is 0.27 (n= 522, p< 0.01). The moving window correlations indicate that the correlations were stable and significant during the past few centuries. High-pass filtering was conducted on the original sequence, to filter out the interdecadal variability, and the correlation is 0.42 (n= 522, p< 0.01), which means that the impact of temperature on runoff is mainly on the interannual scale. This may be related to the influence of temperature on glacier-fed rivers (Singh et al 2006, Stahl and Moore 2006). The positive response of glacier-fed river streamflow to climatic warming was observed in many studies (Milner et al 2017, Kang et al 2022, Yao et al 2022). Thus, this persistent, stable and significant correlation suggests that meltwater from glaciers and snow is an important driver of variations in the flow of the Yalong River.
To quantitatively determine the response of the Yalong River streamflow to large-scale circulation factors in the model and observations, we selected the sea surface temperature in the area from 10° S to 10° N and from 170° E to 90° W, minus the average sea surface temperature in the two regions of 25°–45° N and 140°–145° E to 50°–15° S and 150°–160° W, as the IPO index (Huang et al 2020). Similarly, the average sea surface temperature in the region over 0°–65° N and 80° W–0° was subtracted from the average sea temperature in the region of 80° S–80° N and all longitudes as the AMO index (Henley et al 2015) in the CESM-LME model. Considering that we reconstructed the months from previous October to current June, in order to maintain the continuity of the article, we chose October–June for the next analysis of the correlation between runoff flux and IPO and AMO. The streamflow sequence in the Yalong river basin, IPO, and AMO were extracted from the model, and after 21 year smoothing the correlation coefficients between runoff and IPO, AMO are −0.41 and 0.65 (n= 566, p< 0.01), respectively. This indicates that the response of streamflow to large-scale circulation in the model is consistent with that of the reconstruction, and that the model better reflects the response of the Yalong river flow to large-scale climate circulation. IPO, AMO, and Northern Hemisphere temperature were chosen as measures of the internal variability in regression equation. For the external forcing experiment streamflow in the Yalong river as well as internal variability as variables for multiple linear regression of total forcing experiment streamflow, only variables that passed the 95% confidence interval test in the regression equation are considered to significantly affect the streamflow. The regression equation explains 65.8% of the streamflow variations from 1480 to 2005 (figure 3(a)). Among them, AMO and IPO are the major contributing factors to streamflow variations. The IPO explains 20.5% of the streamflow variations, while the AMO explains 14.9%; the main external forcing factors are SSI, GHG and ORB, which explain 12.5%, 10.6% and 7.1% of the total variance, respectively. Northern Hemisphere temperature only explains 0.2% of the streamflow variance. The effect of temperature on decadal streamflow variations is not as large as that of interannual changes, which may be due to the reduced sensitivity of runoff changes to temperature, caused by the response of glacier storage to temperature changes in the study area. This can also explain the reason why the temperature of the TP increased in the late 20th century and the runoff variation in the study area was small, some studies have pointed out that the relative contribution of glacial melt water to the streamflow variations of the Yalong River is the lowest among the seven basins on the TP, which means that the glacial melt water brought by temperature rise has less impact on the runoff change of the Yalong River (Qi et al 2022), while relatively speaking, the change of precipitation has more impact on the runoff, but the precipitation has not shown an obvious trend, which is why there has been no obvious trend in the runoff of the Yalong River in the past decades. Miller et al (2012) suggested that the negative effects of glacial melting in the Ganges and Yarlung Tsangpo river basins were offset by the increase in precipitation at the interannual scale on the TP, which could also explain the phenomena observed in this study.
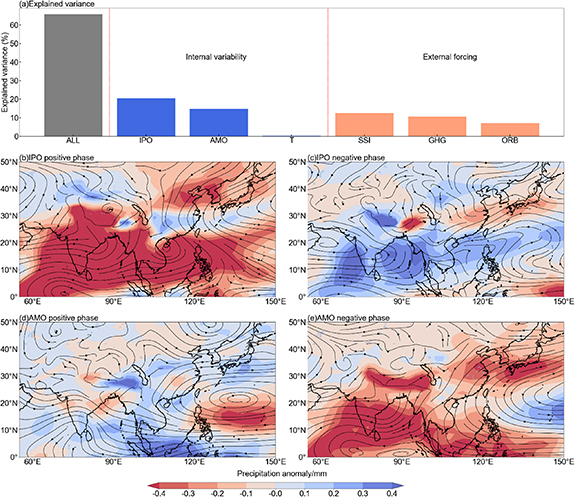
Figure 3. (a) Variance of the CESM streamflow explained by all climate drivers (external forcings and modes of internal variability), and by the individual drivers, during 1480–2005. Water vapor transport and precipitation anomaly maps in IPO and AMO positive and negative phases in the CESM model (changes in East Asian water vapor transport under positive/negative phases of the IPO (b), (c) and AMO (d), (e)).
Download figure:
Standard image High-resolution image3.2. Projections of future streamflow
The reconstruction provides a long-term streamflow baseline to evaluate future variations under global warming. The streamflow projections indicate varying levels of increase in the future streamflow of the Yalong River under different scenarios. Kernal density estimates of reconstructed, observed and future streamflow suggest an increase in both the average and variance of streamflow that exceed those of the reconstructed and instrumental periods (figure 4). Compared to the reconstructed period (1480–2021), the future projections (2022–2100) of the Yalong river streamflow indicate an increase of 29.8% under the SSP245 scenario, and 47.2% under the SSP585 scenario. The streamflow projections suggest a large increase in streamflow at about 2030 C.E. relative to the instrumental period, and the increase persists through the end of the century. Taking the risk of a flood event as the percentage chance of occurrence and calculated from the kernel density, our results show that the flood streamflow magnitude with a frequency of 5% is 1215.26 m3 s−1 during the instrumental period, but the probability of such floods occurring in the future under the SSP245 and SSP585 scenarios is 31.0% and 51.2%, respectively.

Figure 4. (a) Past, present, and future 21 year low-pass filter results of the Yalong river P10-C6 streamflow. (b) Risk of flooding with a frequency of 5% during the observation period under SSP245 and 585 scenarios (c) variation of mean and kernel density estimates of streamflow through time.
Download figure:
Standard image High-resolution image
4. Discussion and conclusion
Our reconstruction of the Yalong River streamflow for October–June contributes to an improved understanding of past and long-term hydroclimatic variability on the TP. Our results show that 65.8% of the streamflow variance can be explained by external forcing and internal variability, and they confirm that the AMO and IPO were important drivers of multidecadal streamflow variability in the Yalong River Basin since 1480. To further assess the impact of internal variability on basin hydrological conditions, we produced water vapor transport and precipitation anomaly maps for East Asia, when the IPO and AMO are in their positive and negative phases (figures 3(b)–(e)). Specifically, the positive phase of IPO leads to weaker subtropical high pressure in the northwest Pacific, which weakens the water vapor transport to the Yalong River Basin by the southwestern monsoon, resulting in a corresponding decrease in basin precipitation. The positive AMO phase weakens the tropical low pressure in the North Atlantic, intensifying the subtropical high pressure in the North Pacific and increasing the contribution of long-distance water vapor to the hydrological cycle of the Yalong River Basin, resulting in a corresponding increase in basin precipitation. This result agrees with the findings of studies of the surrounding area (Fan et al 2017, Su et al 2017, Shekhar et al 2022). GHG, SSI, and LULC together explain 30.2% of the streamflow variance on a multidecadal timescale. This indicates that while changes in solar activity and human influences have affected the streamflow of the Yalong River, their contribution is less than one-third for the whole of the reconstructed time series. Although we detected relatively drivers over the reconstruction period that explained over two-thirds of the streamflow variance, little research has been conducted on shifts in the contributions of internal variability and external forcing on streamflow variation. Several studies have indicated that the contributions of the driving factors of climate change vary over different time periods.
In evaluating future extreme conditions from the perspective of past streamflow variations, our reconstructed streamflow estimates provide new insights into the long-term hydrological history of the Yalong River. The 21st century has so far been characterized by an unprecedented surge in streamflow and the occurrence of extreme hydrological events, surpassing those observed during the reconstruction period. These findings support previous research results that indicate that climate and hydrological changes on the TP are increasingly influenced by human activities. (Jiang et al 2017, Yang et al 2020). The unprecedented upward trend in streamflow suggests that global warming is exerting a substantial influence on both the climate and hydrological patterns of the TP, with implications for the future status of its water resources (Rizwan et al 2023, Shao et al 2023). Additionally, the variations in streamflow under different scenarios indicate that global emissions reduction can mitigate this impact within this region (Klein et al 2007, Fayiah et al 2020). In the context of the current rapid climate change, long-term historical climate and hydrological data are crucial to informing strategic water resource policy in the TP future scenario.
Acknowledgments
This work was supported by the Second Tibetan Plateau Scientific Expedition and Research (STEP) Program (Grant No. 2019QZKK010206–02), the National Natural Science Foundation of China (NSFC) (91547115 and 32061123008) and 2023 Yunnan University Professional Degree Graduate Practice lnnovation Fund Proiect (ZC-23233809). We also would like to express our sincere gratitude to Last Millennium Ensemble Project (LME) (www.cesm.ucar.edu/community-projects/lme) and WCRP Coupled Model Intercomparison Project (Phase 6) (https://esgf-node.llnl.gov/projects/cmip6/), which provide data support for our research.
Data availability statement
The data that support the findings of this study are openly available at the following URL/DOI: https://data.mendeley.com/datasets/zmsknkw5ng/1.
Supplementary data (0.6 MB PDF)