

Abstract
Changes of the lakes on high-altitude regions of the Tibet Plateau influence the state of the surrounding permafrost. Due to the climate warming and wetting trend, extreme events including lake outburst has occurred more frequent. In 2011, an outburst event occurred on the Zonag Lake and this event changed the water distribution in the basin, leading a rapid expansion of the Tailwater lake, named as the Salt Lake. However, the construction of the drainage channel in the Salt Lake ended the expansion process and the shrinkage of the lake started since 2020. To investigate the permafrost state around the Salt Lake, multiple methods, including drilling boreholes, the unmanned aerial vehicle survey and the ground penetrating radar detection have been applied. By integrating these multi-source data, the thermal regime, topography and the spatial distribution of the permafrost around the Salt Lake were analyzed. The result showed that the permafrost state around the Salt Lake was related to the distance from the lake water. The permafrost table appears at 90 m away from the Salt Lake and interrupted by a nearby thermokarst lake at 220 m. The ground temperature in the natural field is 0.2 °C lower than the temperature in the lake at a depth of −5 m.
Export citation and abstract BibTeX RIS

Original content from this work may be used under the terms of the Creative Commons Attribution 4.0 license. Any further distribution of this work must maintain attribution to the author(s) and the title of the work, journal citation and DOI.
1. Introduction
The Tibet Plateau (TP), as the major distribution area of high-altitude permafrost in the world, has experienced increased sensitivity to climate change in recent years [1–3]. According to the IPCC AR6, the warming rates of the Qinghai–TP and the North and South Poles are significantly higher than the global average [4, 5]. However, severe climate changes can trigger regional extreme events in this region, including extreme precipitation, high temperature weather, and lake outbursts [6–9]. The occurrence of these extreme events highlights the vulnerability of the permafrost environment in the plateau and has significant impacts on engineering and human activities distributed in the plateau [10–12].
Various methods have been used to investigate the permafrost state on TP, including drilling boreholes, ground penetrating radar (GPR) and electrical resistivity tomography (ERT) [13–15]. Based on the 72 boreholes drilled in Beiluhe Basin, Lin et al [16] analyzed the variability in near-surface ground temperatures in a warming permafrost region and the results showed that surface temperatures were strongly controlled by slope aspect. By collecting the GPR data together with the ground temperature, Luo et al [17] indicated that the rising of the permafrost limit in Xidatan region is due to global warming, hydrologic processes and the anthropic disturbances. Combining with the ERT survey, drilling exploration and ground temperature monitoring, You et al [18] investigated the icing near the tower foundation along the Qinghai–Tibet Power Transmission Line and concluded that freezing the soil around the tower foundation or lowering the groundwater table may mitigate the re-occurrence of ground icing. In recently years, the unmanned aerial vehicle (UAV) has been developed and was used in the field survey on the TP widely. By analyzing the images collected by the UAV, Chai et al [19] extracted the type and damage ratio of the Qinghai–Tibet Highway pavement distress. Combining the UAV with the thermal infrared remote sensing technology, Luo et al [20] evaluate the thermal dynamics of permafrost slopes along the Qinghai–Tibet Engineering Corridor and indicated that the influence of Qinghai–Tibet Highway on permafrost slopes is more pronounced than Qinghai–Tibet Railway and electric towers.
Known as the 'Asia Water Tower' and the 'Third Pole', the TP is a major lake distribution area of China. The statistical data shows that lakes on the TP accounts for 51.4% in area and 39.2% in number among all lakes in China [21]. Driven by the continuous warming and wetting process, the lakes on the TP have experienced rapid changes in areas, water levels and volumes during the past decades [22]. In 14 September 2011, the Zonag Lake in the interior of the TP has suffered an outburst due to heavy rainfall [23–25]. The meteorological data showed that the precipitation reached 20.5 and 19.4 mm in 17 and 21, August, which was much higher than the daily average precipitation at 1.31 mm. This outburst event triggered the expansion of downstream lakes, including Kusai Lake, Haidingnor Lake, and Salt Lake, which in turn had significant impacts on the surrounding permafrost environment and may threaten the safety of the engineering infrastructures nearby [26]. The permafrost around the Zonag Lake has become more developed due to the shrinkage of lake area [27, 28]. While as the Tailwater lake in the basin, it has been proved that the expansion procedure of the Salt Lake accelerated the permafrost degradation [29]. Additionally, previous researches indicated that if the Salt Lake continued to expand, another lake outburst in the basin may occurred [30]. To control the expansion of the Salt Lake and address the potential risks, several measures including the construction of a drainage channel has been proposed and applied [31, 32]. The artificial channel transformed the endorheic basin into the exorheic basin and make the Zoang–Salt Lake basin be a part of the Yangtze River.
The previous researches have provided sufficient data about the permafrost state around the drainage lakes. In 1978, a tundra lake in western Arctic coast was drained, the ice wedge began to growth at a rate of 3 cm/a and ceased within about 12 years [33, 34]. In northwestern Alaska, Nitze et al [35] identified 192 lakes has been drained and predicted the intensification of permafrost degradation. Morgenstern et al [36] analyzed the thermokarst lakes in north Siberia and indicated that the drainage causes the sediment refreeze. Most previous studies focused on the permafrost state around the thermokarst lakes which are generally small. In this study, the borehole data near the Salt Lake has been collected since 2020 and a GPR line was settled from lake to the natural field. In addition, the orthomosaic image and digital surface model (DSM) were collected by the UAV. Based on these data, the permafrost state around the Salt Lake was exhibited spatially and temporally and the mechanisms of the interaction between the Salt Lake and permafrost was analyzed.
2. Study area and methods
2.1. Study area
The study area is located in the northeastern section of Hoh Xil in the inner TP with the Kunlun Mountains located in the north. Influenced by the climate and Quaternary glacial conditions, the soil in the study area is mainly composed by gravelly sandy soil and accordingly are difficult to hold up rich vegetation. With the vegetation coverage less than 30%, Stipa grass is the dominant plant. The permafrost is well-developed in the study area (figure 1(a)). Based on the borehole drilling data, the active layer thickness is between 2 and 3 m. The permafrost thickness is between 30 m and 60 m with the temperature higher than −1 °C. Beneath the permafrost table, the ice content in study area ranges from 30% to 70%. The climate of the study area was semi-arid, with the mean annual air temperature (MAAT) ranges from −7.0 °C to −3.0 °C and the yearly precipitation in this area ranges from 150 mm to 450 mm. During the past decades, the MAAT and the precipitation has shown an increasing trend with a rate of 0.33 °C/10a and 23.4 mm/10a [37]. In 2019, an artificial drainage channel was excavated in the east of the Salt Lake to constrain the lake expansion. In this study, the monitoring of the permafrost state and the field investigations was mainly focused on the edge of the Salt Lake where the artificial drainage channel was constructed (figures 1(b) and (c)).
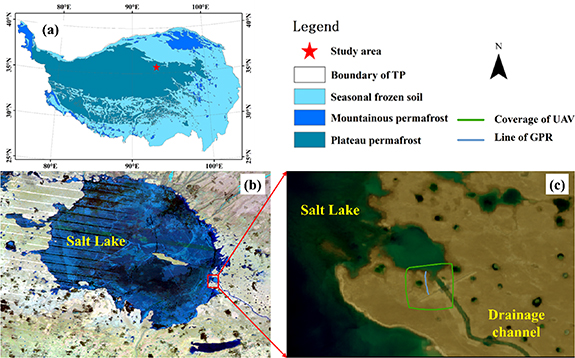
Figure1. The overview of the study area: (a) the distribution of permafrost on the TP and the location of the study area [37, 38]; (b) the Landsat satellite image (2021) showing the state of the Salt Lake; (c) the Sentinel satellite image (2022) showed the coverage of UAV and the line of GPR in this study.
Download figure:
Standard image High-resolution image2.2. Methods
2.2.1. The GPR technique
The working principle of GPR is to use antennas to transmit and receive high-frequency electromagnetic waves (EWs) to detect the characteristics and distribution rules of the internal material of a geophysical object. When the EW propagate in the underground medium, they will reflect when encountering interfaces with different electric properties. According to the differences in the waveform, amplitude strength, and time of the received EW, it can be inferred the nature and distribution of the underground medium. The offset method is a widely utilized technique for data acquisition in GPR technique. During the acquisition process, the transmitting antenna (T) and receiving antenna (R) move in unison along the measurement line at a predetermined distance. When both the T and R antennas move simultaneously, a signal is acquired, and the information of target beneath the measuring line can be obtained by the continuous movements (figure 2(a)). The velocity of EW in different medium is determined by the dielectric constant of the medium (figure 2(b)) and can be calculated by the following equation:


Figure 2. The working principle of GPR: (a) the common offset method of GPR (T: Transmitter antenna, R: Receiver antenna); (b) the velocity of EW in different medium.
Download figure:
Standard image High-resolution imagewhere  is the velocity of EW in the vacuum (3 × 10⁸ m s−1) and
  is the dielectric constant of the medium. The previous researches have proved that the velocity of EW in permafrost varies with position and influenced by the permafrost conditions, including ice content, grain size and soil moisture [39–41]. However, considering the measurement error between the accuracy and the average velocity is 1–13 cm, the average velocity was used in the processing of the GPR data and this propagation velocity was calculated by comparison with manual frost probing data in the study area.
In this study, the XPRT Crossover CO730 two-dimensional GPR (Impulse Radar, Sweden) were used in the field survey in the Salt Lake, Hoh Xil. The GPR system shielded antennas with frequencies centered around 70 and 300 MHz to measure different depths at different precisions. The parameters of the data acquisition and processing procedure are shown in the table 1.
Table 1. The parameters of the GPR.
| Setting options | Antenna 1 | Antenna 2 |
|---|---|---|
| Frequency (MHz) | 300 | 70 |
| Offset distance (m) | 0.23 | 0.6 |
| Stacks (bit) | 32 | 32 |
| Number of samples | 1000 | 1000 |
| Distance interval (m) | 0.04 | 0.04 |
| Time interval (s) | 0.1 | 0.1 |
| Velocity of EW (m ns−1) | 0.118 | 0.118 |
2.2.2. The UAV technique
The aerial survey was conducted by the DJI Mavic 2 Pro in June, 2022. Equipped with a 1 inch sensor with a resolution of 20 million pixels (5472 × 3648), the UAV is capable to collect the clear images of the surface. The flight height of the UAV was controlled in 130 m and 321 exchangeable image file format (EXIF) images with the Position and Orientation System (POS, contains latitude, longitude, altitude, heading angle, pitch angle, and roll angle) data was collected. The EXIF images and POS data were processed to generate the DSM and the orthomosaic image. The parameters of the UAV in the flight and the processing periods are presented in table 2.
Table 2. The parameters of the UAV in the flight and the processing periods.
| Flight settings | Processing settings | ||
|---|---|---|---|
| Setting options | Parameters | Setting options | Parameters |
| Drone type | Mavic 2 Pro | Images number | 321 |
| Acquisition date | 27 June 2022 | Average GSDa | 3.39 cm/pixel |
| Aerial route type | Double grid | Area covered | 0.282 km2 |
| Flight height | 130 m | Generated DSM | Yes |
| Overlap | 70%–80% | Generated orthomosaic | Yes |
| Path | 7346 m | Coordinate system | WGS84 |
aGSD: Ground Sample Distance.
To guarantee the accuracy of the UAV result, an experimental flight was conducted 5 km away from the study area (figure 3(a)). At the experimental place, 30 points were positioning by the Global Navigation Satellites System Real-Time Kinematic (RTK) technology and can be used to correct the UAV results (figure 3(b)). Thirty RTK points in the experimental area were divided into two sets, the experimental points coded from 1 to 15 were mainly used to calculate the altitude difference between the RTK and the DSM image (figure 3(c)). The altitude difference of these points ranged from 59.78 to 51.26 m and the average difference was 50.66 m. Then, the test points coded from 16 to 30 would subtracting the average difference from the DSM image of UAV (CUAV, correction of UAV). By comparing the data of the CUAV and the RTK points, the difference was control in a range of −0.07 m and 0.5 m, 0.19 m average (figure 3(d)). Based on the results, the average difference between UAV image and the RTK points obtained from the experimental area were used to correct the DSM data in the study area.
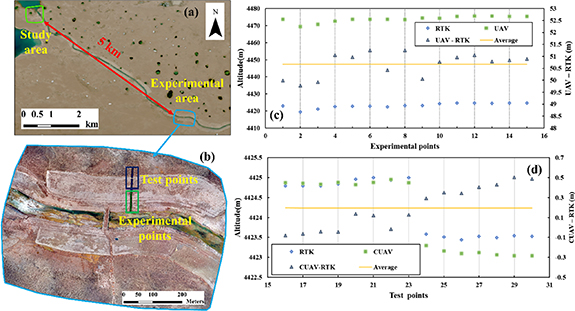
Figure 3. The correction of the UAV images: (a) the distance between the study area and the experimental area; (b) 30 RTK points were divided into experimental points and the test points; (c) the difference between the UAV image and the experimental RTK points; (d) the difference between the correction UAV (CUAV) image and the test RTK points.
Download figure:
Standard image High-resolution image2.2.3. Ground temperature monitoring around the Salt Lake
Seven boreholes with a depth of 20 m were drilled from the lake to natural field around the Salt Lake in September, 2020. Each borehole contains 30 thermistor temperature sensors (TTS) which have a working range from −40 °C to 40 °C with a temperature resolution of 0.01 °C–0.005 °C in negative temperature conditions and of 0.01 °C–0.03 °C in positive temperature conditions. In the first 10 m beneath the surface, the interval of each TTS was 0.5 m and changed into 1 m in the depth of 10 m and 20 m (figure 4(a)). All the TTS were connected to the data logger by the cables buried beneath the surface (figure 4(b)). The data logger was powered by the solar energy to ensure the continuous monitoring and the ground temperature was collected every 6 h (figure 4(c)).

Figure 4. The ground temperature profile around the Salt Lake: (a) the placement of 30 TTS in each borehole; (b) the ground temperature boreholes were connected to the data logger by cables (the photograph captured in 27 June 2022); (c) the data logger collected the ground temperature data.
Download figure:
Standard image High-resolution image3. Results
3.1. The topography around the Salt Lake obtained by the UAV
By processing the images obtained from drones, the topography around the Salt Lake is presented by the orthomosaic image (figure 5(a)) and the DSM image (figure 5(d)). The orthomosaic image has shown the soil in the surrounding area of the Salt Lake is relatively moist in the surface. However, as distance increases, small grasses begin to appear on the surface of the ground and large amounts of white salt crystals exuding from the ground. The white salt crystals, which might be left in the soil when the area was submerged by the lake water, reduced as the distance increases further. By using the threshold segmentation method on the green band of the UAV image, the changes of the surface soil along the Salt Lake can be visualized more clearly (figures 5(b) and (c)). The DSM image has revealed the altitude information around the Salt Lake. There is also a elevation difference between the Salt Lake and the diversion channel. At the junction between the Salt Lake and the diversion channel, the elevation is 4425.4 m, while at the center of the diversion channel about 370 m away, the elevation is 4423.2 m, 2.2 m lower than the junction point.

Figure 5. The topography around the Salt Lake obtained by the UAV: (a) the threshold segmentation image around the Salt Lake; (b) the threshold segmentation image of the natural field; (d) the DSM image of around the Salt Lake.
Download figure:
Standard image High-resolution imageBy superimposing the line of GPR and the line of the ground temperature boreholes (1# to 7# ordered from the natural field to the Salt Lake) in the orthomosaic image and the DSM image, the spatial location and relationship between these lines and the topography can be reflected. Located in the south of the Salt Lake, a thermokarst lake is 145 m away from the Salt Lake and 37 m away from the line of GPR (figures 5(a) and (c)). Additionally, the distance between the line of ground temperature boreholes and the line of GPR is about 10 m.
3.2. The result of the ground temperature around the Salt Lake
The ground temperature data since 2020 revealed the time series of the permafrost thermal regime. Located in the natural field, the data collected by borehole 1# has shown the changes of ground temperature. The isothermal line of −0.5 °C was started at a depth of −6 m in November, 2020 and decreased to −6.3 m (figure 6(a)). The ground temperature of borehole 2# shows that both the isothermal lines of −0.5 °C and −0.3 °C have appeared a downward trend, the lines of −0.3 °C and −0.5 °C moves downward by approximately 0.3 m and 0.5 m, reached a depth of −4 m and −7 m, respectively (figure 6(b)). The borehole 3# located in the natural field and the ground temperature are higher than the borehole 1# and 2#. The isothermal line of −0.5 °C was at a depth of −9 m in November, 2020 and reached at −9.3 m in May, 2022 (figure 6(c)). With the distance comes closer to the Salt Lake, the borehole 4#, 5#, 6# shows the ground temperature was much higher than borehole1#, 2# and 3#. The −0.4 °C isothermal line of borehole 4# starts at a depth of −7.9 m and ends at −8.5 m (figure 6(d)). The borehole 5# shows the depth of the −0.4 °C isothermal line the in May, 2022 is 0.5 m lower than the depth in November, 2020 (figure 6(e)). The ground temperature of borehole 6# has a significant change and the −0.4 °C isothermal line decreased by 1 m, reached at a depth of −9.0 m in May, 2022. The borehole 7#, which is located in the Salt Lake, has the warmest ground temperature among the boreholes. The −0.4 °C isothermal line starts at −9.0 m and end at a depth of −9.3 m.
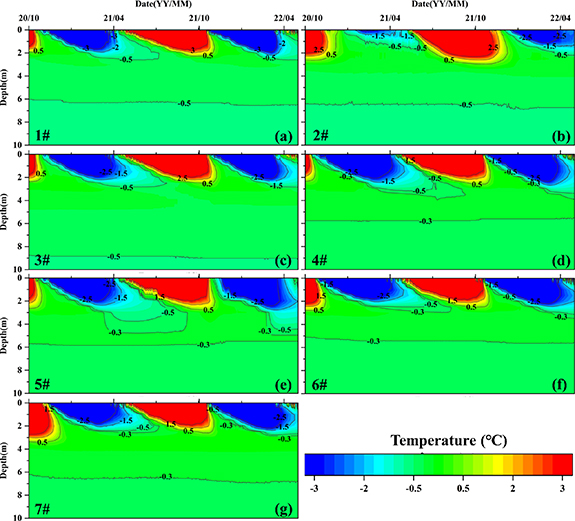
Figure 6. The ground temperature around the Salt Lake: (a) borehole 1#; (b) borehole 2#; (c) borehole 3#; (d) borehole 4#; (e) borehole 5#; (f) borehole 6#; (g) borehole 7#.
Download figure:
Standard image High-resolution image3.3. The spatial distribution of permafrost around the Salt Lake
The permafrost spatial distribution can be observed by the GPR. The processed GPR data in different frequency (70 MHz and 300 MHz) is capable to reflect the permafrost state at different depth from the shoreline of the Salt Lake to the natural field 290 m away (figures 5 and 7). In the image of 70 MHz, the ground ice is distributed in the first 50 m of the GPR line with a depth over 10 m. As the distance from the Salt Lake increases, the permafrost table appears in the image and become more and more clear. However, when the GPR line approach the thermokarst lake at 220 m and 250 m, the permafrost table disappear in the image (figures 5(c) and 7(a)). The image of 300 MHz presented the detail variation process of the permafrost table along the Salt Lake. The permafrost table at a depth of approximate −2.5 m is divided in to two parts. The first part starts from 90 m to 220 m and the second parts starts from 250 m to 290 m (figure 7(b)). When analyzing the GPR data together with the topography image in figure 5(a), it is evident that permafrost table is mainly exists at a specific distance from the surface water such like lakes.

Figure 7. The processed GPR images in different frequency around the Salt Lake: (a) 70 MHz; (b) 300 MHz.
Download figure:
Standard image High-resolution image4. Discussion
4.1. The changes in area of the Salt Lakes on in recent years
Climate change has significant implications for the lake dynamics [42, 43]. Based on the satellite data, the rapid lake expansion in the endorheic basin on the TP since 2000 was investigated, and the potential driving factors, including climate change, glacier melting and permafrost degradation, were discussed [44]. By examining the annual changes in lake area, level, and volume during 1970s to 2015, Zhang et al [45] indicated that the lake volume was a slight decrease from 1970s to 1995, and followed by the increase since 1996. Between 1956 and 2007, the lakes experienced an area decline and close to half area difference was caused by the persistent drainage in Old Crow Flat, Alaska [43].
Located in the continuous permafrost region of the TP, the Salt Lake has also experienced area changes in different period. Figure 8(a) shows the boundary changes of the Salt Lake since 2010. From the shoreline of the lake in different years, the lake expanded mainly in the southwest direction and several small lakes around the original lake has been swallowed up. A notable example is that a small lake located on the west side of the Salt Lake in 2019 had already become part of the lake by 2020. From 2020 to 2021, the boundary of the Salt Lake exhibited a shrinkage trend instead of the expansion in the years before. Figure 8(b) focus on the area changes of the Salt Lake since 2000. The changes of area can be divided into five stages due to the different expansion rate. The first stage showed a slow expansion of the area during 2000 and 2010, which was before the outburst of the Zonag Lake. However, during the period of the lake outburst (stage 2, 2010–2012), the area of the Salt Lake expanded in a significantly rapid rate. During the stage 3 from 2012 to 2018, the Salt Lake was still in an expansion period with a relatively slow growth rate compared to the stage 2. While in stage 4 from 2018 to 2020, the growth rate has accelerated and the area of the Salt Lake has reached the peak. In contrast to the previous stages, stage 5 has exhibited a shrinkage state in the area since 2020. These expansion rates in different period of the Slat Lake indicated the different impact of the climate change (stage 1), the upstream lake outburst (stage 2 to stage 4) and the human intervention (the construction of the drainage channel, stage 5) on the lake area change, of which the upstream lake outburst domain the area change over the past years.
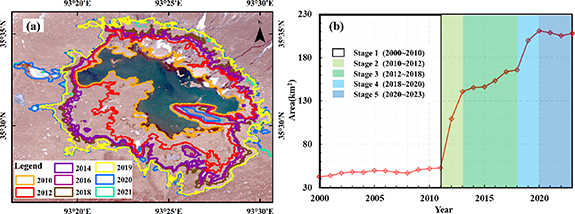
Figure 8. The area changes of the Salt Lake: (a) the boundary changes since 2010; (b) the annual area of the Salt Lake since 2000.
Download figure:
Standard image High-resolution image4.2. The permafrost thermal regime around the Salt Lake
As an excellent heat carrier, the surface water can bring a large amount of heat and cause the rapid deepening of the active layer, warming of permafrost layer and even development of taliks. By setting sensors in a thermokarst lake in Beiluhe Basin and analyzing the heat transport process, Lin et al [46] indicated that the permafrost beneath the lake bottom is completely thawed and changes to be a through talik and the continuous heat absorption leads the underlying permafrost to degrade in the lake area near the shore. The thermal regime at the bottom of the lake bottom along the Qinghai–Tibet Engineering Corridor has also showed that the thermal exchange process between lake bed and underlying soil layers can lead to the thawing of permafrost [47].
Based on the data collected by the ground temperature sensors at different depth and different position, the permafrost thermal regime around the Salt Lake is presented in figure 9. The ground temperature at −5 m indicated that the max ground temperature appeared at Salt Lake (7#) and the min temperature is at the farthest natural field borehole (1#). Due to the shrinkage of the Salt Lake, the ground temperature from 3# to 5# shows a decrease trend while an increase trend is shown at 1#, 2#, 6# and 7# (figure 9(a)). At the depth of the −10 m, all the ground temperature exhibits an increase trend and can be classified into three parts: 1#, 2# lower than −0.6 °C, 3# between −0.55 °C and −0.5 °C, 4#, 5#, 6#, 7# between −0.46 °C and −0.42 °C (figure 9(b)). At the depth of −15 m, the ground temperature in 1#, 2# is ranged from −0.72 °C to −0.66 °C and other boreholes is ranged from −0.56 °C to −0.46 °C. At the depth of −20 m, all the temperature remains stable between October, 2020 and May, 2022. 1#, 2# at the natural field shows a temperature −0.65 °C and −0.6 °C, others range from −0.51 °C to −0.42 °C (figure 9(d)). The ground temperature around the Salt Lake has showed the permafrost has experienced a warming process. However, the ground temperature at 3# to 5# with a depth of −5 m shows the permafrost in this area has experienced a cooling process. Considering the lake area changes in recent years, it is evident that the shrinkage of the Salt Lake lead to the development of permafrost in the surrounding area.
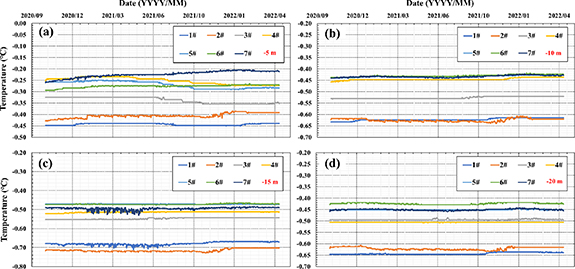
Figure 9. The ground temperature at different depth: (a) −5 m; (b) −10 m; (c) −15 m; (d) −20 m.
Download figure:
Standard image High-resolution image4.3. The mechanisms of interaction between the Salt Lake and permafrost
The variation in lake area usually affects the development of permafrost. The observed data indicated that the depth of the permafrost table around the shrinking Zonag Lake changed from −4.9 m to −5.7 m during 2012 and 2014 and the simulation results predicted that the permafrost layer would keep increasing in the future [48]. By comparing the ground temperature data collected at the Zoang Lake and the Salt Lake, Liu et al [27] pointed out that the permafrost layer appeared opposite states, the permafrost around Zonag Lake developed while the degradation occurred around the Salt Lake.
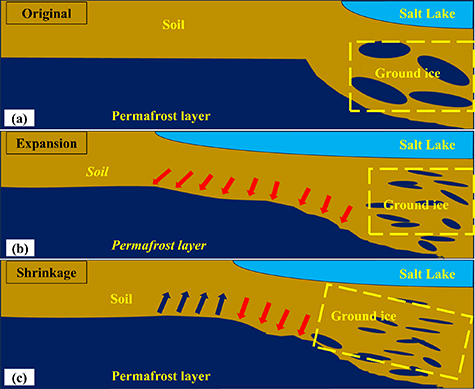
Before the outburst of the Zonag Lake in 2011, the area of the Salt Lake remained stable. Ground ice distributed beneath the edge of the lake and permafrost layer located surround the lake (figure 10(a)). After the outburst, the Salt Lake has received the most incoming water and expanded rapidly. Based on the field observation data, the water level raised over 8 m with an average accelerate rate of 2.7 m yr−1 [24]. As a lake with a depth over 25 m, the heat brought by the lake water accelerated the degradation of the surrounding permafrost and the ground ice beneath the lake [27, 49] (figure 10(b)). The construction of the drainage channel transferred the Salt Lake from an endorheic lake into an exorheic lake and resulted in the shrinkage of the Salt Lake [26, 31]. As a consequence, the shrinkage exposed the previously submerged soil and the state of permafrost surrounding the lake has divide into two modes. The permafrost beneath the newly exposed soil is in a cooling process and the permafrost beneath the lake water is still in a warming process (figure 10(c)).
Figure 10. The interaction between the changes of the Salt Lake and permafrost: (a) the original state; (b) the permafrost state when the lake was in an expansion period; (c) the permafrost state when the lake was in a shrinkage period.
Download figure:
Standard image High-resolution image
5. Conclusions
The drainage and outburst events of thermokarst lakes have widely occurred in permafrost environment during the past decades. With continuous climate changes, plenty of large lakes situated in permafrost regions would face the same risk of outburst or drainage. In this study, the Salt Lake with an area exceeding 200 km2 in the interior of the TP was selected as an example. Due to upstream lakes overtopping and human intervention, the lake has undergone rapid changes in area and influenced the surrounding permafrost. Multiple methods including UAV, GPR and borehole temperature observation has been utilized comprehensively to investigate permafrost state around the lake. The UAV images provide the topographic information around the Salt Lake and aided in the interpreting the GPR data. The GPR showed that the permafrost table appears at 90 away the lake and interrupted by a thermokarst lake at 220 m. In contrast to the UAV and GPR data which mainly focused on the spatial information, the borehole temperature observation can reflect the permafrost thermal condition from a temporal perspective. During the observation period from October, 2020 to May, 2022, the permafrost originally located within the lake (3# to 5#) at a depth of −5 m showed a cooling process which caused by the shrinkage of the lake. By integrating the methods, the permafrost state could be analyzed spatially and temporally.
Although the utilization of the multiple methods could reflect the permafrost condition from various perspectives, the limitation of these techniques such as the offset of the UAV images could not be neglected. The integration and application of these technologies should be further strengthened in future research.
Acknowledgments
This research was funded by the Second Tibetan Plateau Scientific Expedition and Research (STEP) program, Grant Number 2019QZKK0905; Science and Technology Project of Gansu Province, Grant Number 22ZD6FA004.
Data availability statements
The data that support the findings of this study are available upon reasonable request from the authors.
The data cannot be made publicly available upon publication because the cost of preparing, depositing and hosting the data would be prohibitive within the terms of this research project.
Conflict of interest
The authors declare no conflict of interest.