


Abstract
Recent satellite and in-situ measurements show that forests can influence regional and global cloud cover through biophysical processes. However, forest's possible local and non-local impacts on clouds remain unclear. By analyzing the model simulations from the Coupled Model Intercomparison Project Phase 6, here we show that deforestation-induced cloud cover changes have a strong latitudinal dependence, with decreased cloudiness in the tropics but increased cloudiness in the temperate and boreal regions. We further disentangle the local and non-local effects in influencing the cloudiness changes in model simulations. Results show that deforestation leads to a local cloud reduction in the tropics and a non-local cloud enhancement in the temperate and boreal regions. We demonstrate that the relationship between changes in cloud cover and deforestation would be misinterpreted without considering the non-local signals. Furthermore, our modeling results are inconsistent with recent observational studies, with enhanced clouds in model simulations but reduced clouds in observations in the temperate and boreal regions. Further efforts to explore the non-local effect and to reduce the model uncertainty could help advance our understanding of the biophysical effects of deforestation.
Export citation and abstract BibTeX RIS

Original content from this work may be used under the terms of the Creative Commons Attribution 4.0 license. Any further distribution of this work must maintain attribution to the author(s) and the title of the work, journal citation and DOI.
1. Introduction
To limit global warming to less than 2 °C relative to the pre-industrial era is a growing challenge, particularly without climate change mitigation policies to be credibly implemented in the near future (Griscom et al 2017). Currently, one of the suggested land-based climate mitigation strategies (i.e. carbon capture and storage) is to have carbon sequestered by trees (e.g. afforestation and reforestation, tree restoration or avoiding deforestation; simply termed 'afforestation' thereafter) (Canadell and Raupach 2008). However, large-scale afforestation is not a simple solution (Holl and Brancalion 2020). Afforestation also influences regional and global climate through biophysical processes and its climatic impacts depend strongly on both how and where trees are planted (Bonan 2008, Runyan et al 2012, Forzieri et al 2017). This explains well the inconsistencies or controversies of current assessments of such impacts and highlights the urgency and need to comprehensively evaluate the biophysical mechanisms triggered by afforestation (Zhou et al 2007, Pielke et al 2011, Mahmood et al 2014, Perugini et al 2017).
The direct effects of afforestation on climate, and exchanges of water and energy with the atmosphere have been increasingly quantified by using satellite remote sensed data (Zhao and Jackson 2014, Alkama and Cescatti 2016, Bright et al 2017; Duveiller et al 2018, Smith et al 2023) and in-situ observations (Rotenberg and Yakir 2010, Teuling et al 2010, Baldocchi and Ma 2013, Luyssaert et al 2014). Biophysical effects of afforestation on temperature differ in direction and magnitude among tropical, temperate and boreal regions, indicating a strong latitudinal dependence and seasonality (Lee et al 2011, Zhang et al 2014, Li et al 2015). Recently, observational studies show that afforestation in different regions has opposite effects on summer cloud cover (Cerasoli et al 2021, Xu et al 2022), with enhanced clouds over most temperate and boreal regions (Teuling et al 2017, Duveiller et al 2021) but inhibited clouds in the Amazon basin (Durieux et al 2003, Wang et al 2009). Note that such studies often compare the clouds over the forests and open lands over the neighboring land units (i.e. space-for-time methodology) or along the same latitudes. This widely-used approach assumes that the forests and neighboring land units share the same regional to large-scale background climate and so their difference is used to infer local impacts resulting only from their differences in land surface conditions such as vegetation and land use/cover (e.g. Zhou et al 2007, Pongratz et al 2021). One fundamental limitation inherent in this method is its focus on localized, small-scale impacts while ignoring collective remote or non-local impacts of regional to large-scale afforestation (Winckler et al 2017, 2019, Chen and Dirmeyer 2020). This points out some potential caveats and uncertainties in our current understanding and estimates of cloud change due to afforestation.
It is well known that afforestation can also trigger non-local biophysical impacts, through advection of heat and moisture and via changes in atmospheric circulation and clouds (Bala et al 2007, Spracklen et al 2012, Swann et al 2012, Devaraju et al 2015, Hua et al 2015a, Portmann et al 2022). Global climate models (GCMs) have been widely used to quantify the impacts of afforestation (Swann et al 2012, Hua et al 2015b, Laguë and Swann 2016). For example, Amazonian deforestation (afforestation) likely decreases (increases) rainfall in models (Lawrence and Vandecar 2015, Spracklen and Garcia-Carreras 2015). Deforestation in the northern mid-latitudes would also lead to reduced clouds in the tropics, which are associated with a southward shift in the intertropical convergence zone (Laguë and Swann 2016). It is worth noting that, unlike the aforementioned observational studies with an emphasis only on local impacts, GCMs are likely able to capture both local and non-local effects of regional to large-scale deforestation because they are developed to simulate the large-scale atmospheric circulation and its response to various external forcings.
Interestingly, the results obtained from GCMs and observational studies are contradictory concerning the sign of these impacts (e.g. Pongratz et al 2021). One possible explanation is that the observational studies (i.e. space-for-time methodology) usually compare neighboring forests and open lands, so the similar remote effects through advection and atmospheric circulation between the neighboring regions are likely removed in such differences. To test this hypothesis, we investigate the effects of deforestation on cloud cover at regional and global scales by using multiple start-of-the-art models participating in the Land Use Model Intercomparison Project (LUMIP; Lawrence et al 2016), which is the part of the Coupled Model Intercomparison Project Phase 6 (CMIP6, Eyring et al 2016). Although deforestation is considered in the CMIP6 simulations, the results can be used to infer the opposite effects of afforestation. We first examine the cloud cover changes in response to deforestation in CMIP6 models and then disentangle the local and non-local effects in influencing the cloudiness changes using a checkerboard-like approach. Our study should provide insight into the biophysical impacts of deforestation on clouds and water cycle and help to reconcile the disagreement between observed and simulated cloud change in responses to deforestation.
2. Data, model simulations and methods
2.1. Data and model simulations
We analyzed the idealized global deforestation (i.e. deforest-glob) simulations from climate models participated in the CMIP6 (table S1). The deforest-glob experiment was designed to investigate the biophysical role of land cover change on climate and to inter-compare modeled biogeochemical response to deforestation (Lawrence et al 2016). As CMIP6 models have different forest cover distributions in the pre-industrial control (i.e. piControl) simulation, the selection of grid cells for deforestation is based on the fractional forest cover in a given model's piControl simulation. In deforest-glob, 20 million square kilometers of forested area (covered by trees) is converted to natural unmanaged grasslands over the top 30% of land grid cells in terms of their area of tree cover (figure S1) over a period of 50 years with a fixed rate of 400 000 km2yr−1 followed by at least 30 years of constant land cover. It is worth noting that although all CMIP6 models follow this deforestation protocol, a few models (e.g. UKESM1-0-LL) also have vegetation change after year 50 due to their model structure (Boysen et al 2020). CO2 concentration, land-use and land management and other forcings are kept constant at their pre-industrial levels. More detailed information on the deforest-glob experiment can be found in Lawrence et al (2016).
2.2. Methods
We compared the last 30 years of the piControl and deforest-glob simulations to derive the mean response to deforestation. The statistical significance level of the difference was estimated based on a two-tailed modified Student's t test (Zwiers and von Storch 1995). We focused on the three-month period of June, July and August (JJA), when the cloud differences maximize between forests and grasslands (Duveiller et al 2021, Xu et al 2022). The cloud differences also maximize in the tropical Southern Hemisphere during boreal summer (not shown).
Deforestation affects the climate locally at deforested boxes (termed 'local effects') by altering land surface properties (e.g. albedo, roughness, evapotranspiration and leaf area index), and also influences both deforested and un-deforested grid boxes by changing advection of heat and moisture and atmospheric circulation as well (termed 'non-local effects', Pongratz et al 2021). Separating the local versus non-local effects in the model simulations is not a trivial task and different approaches have been proposed. Prior methods used to extract the local and non-local effects and assess their relative roles include: (a) a checkerboard approach of altered and un-altered grid boxes (Winckler et al 2017); (b) a comparison of coupled and offline simulations to isolate atmospheric feedbacks (Chen and Dirmeyer 2020); and (c) a series of numerical simulations to examine the far-reaching teleconnections (e.g. the global responses to boreal, temperate, and tropical deforestation, Devaraju et al 2018). This separation is essential, since coupled models capture the total (local plus non-local) climate response to deforestation. As the CMIP6 models do not provide the similar deforestation scenarios in the offline experiments or specific experiments (e.g. latitudinal band), we used the first method to estimate the local and non-local effects on global clouds. It is assumed that the non-local effect is similar over the un-deforested and near-by deforested boxes as done in many other studies (e.g. Zhou et al 2007, Pongratz et al 2021). We spatially interpolate the non-local signal to the neighboring deforested regions to obtain a global map of the non-local effect. The local effect thus can be obtained by subtracting the interpolated non-local effect from the total effect. As we need to fill in the deforested values with interpolated values while leaving the original values unchanged, we extrapolate the non-local signal in the core deforested boxes surrounded by deforested boxes by solving the Poisson's equation over the original values beyond data boundaries. It is worth noting that using a chessboard-like pattern (i.e. one out of two deforested boxes, the other for un-deforested boxes) may reduce the horizontal interpolation errors in the best possible way, as the local effects only rely on interpolation from directly adjacent un-deforested boxes. However, we used the idealized deforestation scenarios in this study (see section 4). Winckler et al (2017) have compared the idealized sparse and extensive deforestation simulations and found that the local effects using this checkerboard approach do not differ substantially. Therefore, we decided to use this approach to disentangle the local and non-local effects. More detailed descriptions and limitations of this approach can be found in Winckler et al (2017).
3. Results
3.1. Global cloud cover changes in CMIP6 models
Deforestation across global land in CMIP6 models typically leads to an increase in surface albedo (figure 1(a)) and a concomitant decrease in evapotranspiration efficiency and roughness length (Davin and de Noblet-ducoudré 2010). These changes may affect the Earth's energy balance (radiative effect) and the partitioning of available net radiation into sensible and latent heat fluxes (non-radiative effect), especially in relation to the cloud formation and rainfall. The CMIP6 models agree that deforestation increases surface albedo over the tropical (e.g. Amazon, Congo and Southeast Asia) and temperate (e.g. North America and Eurasia) regions (figures 1(a) and S1). Since forests are more efficient in exchanging the available energy with the atmosphere through evapotranspiration (Bonan 2008, Runyan et al 2012), deforestation also alters the distribution of clouds (figure 1(b)) and thus influences the albedo at the top of the atmosphere (TOA) (figure 1(c)). The cloud cover changes due to deforestation have a strong latitudinal dependence, with decreased cloudiness in the tropics but with increased cloudiness in the temperate and boreal regions (figure 1(d)).

Figure 1. Difference of (a) surface albedo, (b) total cloud amount (%) and (c) TOA albedo between the deforest-glob and piControl simulations during the summer season. The map is for the ensemble mean of CMIP6 model simulations (table S1). Also shown in (a) are the deforested areas with slash line (also see figure S1). (d) Zonal mean changes in albedo and clouds between the deforest-glob and piControl simulations for ensemble mean of CMIP6 models. The stippling in (a)–(c) indicates three quarters of runs showing the same sign.
Download figure:
Standard image High-resolution imageCombined with the increase in surface albedo, the change in cloudiness may increase the TOA albedo and produce net radiative cooling, and vice versa (figure 1(c)). For example, deforestation together with increased cloudiness will reflect more solar radiation back to space (i.e. increased TOA albedo) and thus amplify the radiative cooling effect of the higher surface albedo in the temperate and boreal regions, indicating a cloud feedback there. In the tropics, the decrease in total cloud amount due to deforestation will partially cancel the higher surface albedo of deforested areas and result in a small positive TOA albedo change. In the subtropics except for East Asia, the forest fraction changes and cloud cover responses are small in models (figures 1(b) and S1).
Different types of clouds could have different effects on both surface and TOA energy balance. In general, low-level clouds typically have a cooling effect by strongly reflecting radiation back into space, while high-level clouds tend to have a warming effect (Boucher et al 2013, L'Ecuyer et al 2019). Another feature in climate models is the increased low-level cloud amount in the temperate regions in some CMIP6 models (figure S2). Our findings are consistent with previous notion that deforestation may produce mesoscale circulations that alter clouds and precipitation (Bonan 2008, Duveiller et al 2021).
3.2. Local and non-local effects of deforestation
The separation of local and non-local effects may help explain the biophysical impacts of deforestation on clouds. We first examine the temperature changes (figures 2, S3 and S4). When comparing neighboring forests and grasslands in observations, any non-local signals are minimized or removed, because advection of heat and moisture and atmospheric circulation between the neighboring regions are similar. Thus, the local signals modeled due to deforestation are comparable with that observed (Winckler et al 2017, Chen and Dirmeyer 2020). Please note that this assumption neglects the impacts of possible small regional circulation changes due to small-scale, heterogeneous deforestation, which may also alter clouds and precipitation (Bonan 2008, Khanna et al 2017). In general, some CMIP6 models (e.g. BCC-CSM2-MR, IPSL-CM6A-LR, MPI-ESM1-2-LR) show that deforestation can cause local summer warming over the deforested areas (figure 2), which is consistent with observational findings (figure S5). In contrast, some other models exhibit summer cooling in the temperate regions (figure 2), which may be due to the indirect effects of clouds or additional contributions of roughness length change to surface temperature in models (Devaraju et al 2018, Liu et al 2023).

Figure 2. Changes in surface temperature (unit: °C) due to local effect of deforestation for (a) BCC-CSM2-MR, (b) CanESM5, (c) CESM2, (d) CMCC-ESM2, (e) CNRM-ESM2-1, (f) IPSL-CM6A-LR, (g) MPI-ESM1-2-LR, and (h) UKESM1-0-LL. We disentangle the local and non-local effects using the checkerboard approach (Winckler et al 2017). We only show the model results which provide the variable treeFrac (i.e. tree cover percentage, %).
Download figure:
Standard image High-resolution imageThe above evaluation approach can be used for other variables, including clouds. Results show that the multi-model ensemble mean results agree on the sign of local cloud reductions due to deforestation, in particular in the tropics (figure 3(a)). The modeling results are also consistent with previous observational studies in the temperate and boreal regions (Duveiller et al 2021, Xu et al 2022), although the simulated signals are relatively weak. Furthermore, deforestation-induced local cloud changes mainly come from the contribution of low-level clouds (figures S6–8). For the local effects, decreased evapotranspiration associated with deforestation and increased sensible heat fluxes associated with local warming lead to drying of the troposphere and thereby inhibit cloud formation in the tropics. In the middle and high latitudes, changes in cloud cover are less pronounced and their sign depends on the region (figure 3(a)). The cloud cover responses to deforestation differ, depending on changes in sensible heat fluxes at different scales that are associated with convection and atmospheric boundary layer (Bosman et al 2019, Xu et al 2022).
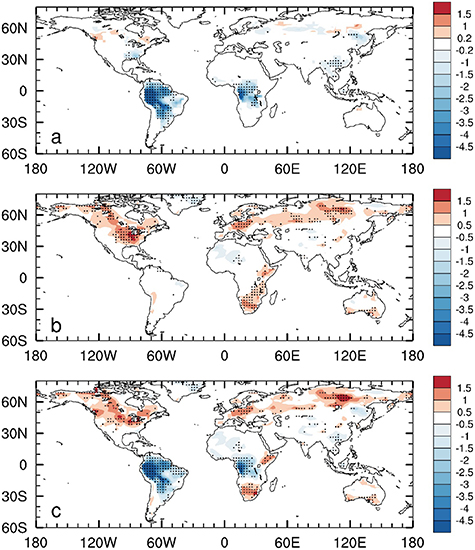
Figure 3. Changes in total cloud amount (%) due to (a) local, (b) non-local and (c) total (local plus non-local) effect in response to deforestation in CMIP6 models during the summer season. We show the ensemble mean of CMIP6 model simulations, which provide the tree fraction data to focus on the areas where experience the deforestation processes (table S1). The stippling indicates three quarters of runs from all models showing the same sign. Note that the deforest-globe runs are initialized from their piControl simulations and the initial tree fraction in each model is slightly different, in particular in the temperate and boreal regions (figure S1). We thus obtained the information of local deforested grid boxes, where two thirds of the models exhibit forest cover changes, to lock the local effect.
Download figure:
Standard image High-resolution imageIn addition to the local effects, the models can simulate deforestation-induced changes over or outside the deforested regions (e.g. via atmospheric teleconnections). In general, there is a non-local cloud enhancement in the temperate and boreal regions (figure 3(b)). Deforestation-induced temperature decreases and relative humidity increases in the middle and high latitudes would lead to relatively wetting of the lower atmosphere and an increase in cloud cover (Laguë and Swann 2016, Liu et al 2023). Note that the regions with significant cloud cover changes do not necessarily coincide geographically with large forest changes. The deforestation effects can propagate to regions that are remote from the deforested areas through the modulation of larger-scale circulations and moisture transport (Swann et al 2012, Devaraju et al 2015). Therefore, the large-scale atmospheric circulation adjustments due to deforestation can lead to remote changes in precipitation and cloud cover in the middle and high latitudes (Portmann et al 2022). Since the multi-model ensemble mean results exhibit a strong increase in clouds in the extratropical regions, the local effect (i.e. cloud inhabitation) is overwhelmed by the non-local effect over these regions (figures 3(a)–(c)). In the tropics, the signals are weak (figure 3(b)), indicating that models show inconsistencies in simulating the non-local effects (figure S9).
3.3. Deforestation-induced cloud changes over time
Our analysis of cloud distribution shows that deforestation has opposite effects on clouds between the tropical and extratropical regions in CMIP6 models. However, these opposite changes contradict the recent observational results (Xu et al 2022), in particular in the temperate and boreal regions (Duveiller et al 2021). Specifically, observational studies show reduced clouds in the temperate and boreal regions due to deforestation (Duveiller et al 2021, Xu et al 2022), but CMIP6 modeling results show opposite changes. There are some differences in the spatial and temporal deforestation patterns in observations and models. First, the impacts of forest on clouds are scale-dependent in observations (Li et al 2016, Li and Wang 2019). For example, small-scale (e.g. kilometer-scale) deforestation could trigger local thermal circulations that impact clouds and rainfall (Khanna et al 2017). The patchy, heterogeneous deforestation patterns drive changes in mesoscale circulation from forests into the atmosphere that can enhance rainfall and cloudiness over nearby deforested areas. However, the response between forest loss and rainfall enhancement may reverse when there is large-scale clearing (Leite-Filho et al 2021). Second, GCM studies have uncertainties typically limited by coarse spatial resolution and unrealistic representation of deforestation patterns. It is therefore more suitable for assessing regional to large-scale deforestation impact.
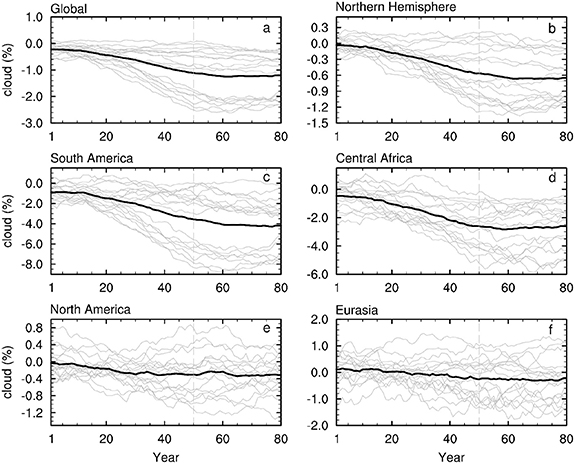
To examine the sensitivity of cloud responses due to the temporal variations in spatial extent of deforestation, we also analyzed the time series of cloud cover and rainfall changes in models (figures 4 and S10) as a function of linearly forest area loss (figure S11). As a consequence of linear forest loss, the multi-model ensemble mean results exhibit a strong linear local reduction in cloud cover over the globe and Northern Hemisphere boreal latitudes (figures 4(a) and (b)). The models have broadly reached the equilibrium by the end of the deforestation period (e.g. over a period of first 50 years with a linear loss of forest area). In addition to the large-scale changes, regional cloud responses to different amounts of deforestation are somewhat different (figures 4(c)–(f)). Over South America and Central Africa, the models simulate a strong linear decrease in cloud cover over time. In the boreal regions, the models show wide spread in simulating the cloud changes over North America and Eurasia (figures 4(e) and (f)). We also examine the rainfall responses to the linear deforestation and found a negative response of rainfall to the linearly fractional cover of forest loss (figure S10).
Figure 4. Changes in total cloud amount (%) over time for (a) global, (b) Northern Hemisphere, (c) South America, (d) Central Africa, (e) North America and (f) Eurasia over the deforested boxes due to local effect of deforestation during the summer season. A 30 year moving average is applied. The black line shows the ensemble mean of all runs from CMIP6 models. The grey vertical line shows the year 50 when the deforestation processes stopped. The changes were computed as the differences between the deforest-globe relative to climatological values in the piControl simulations.
Download figure:
Standard image High-resolution image
4. Discussion
We acknowledge the limitations and uncertainties in this study. First, the extraction method includes spatial interpolation over the deforested and un-deforested regions. In the deforest-glob simulations, the deforested regions appear to be large in the tropics (e.g. South America), thus the non-local effects over the deforested regions may include the interpolation errors. Winckler et al (2017) have compared the idealized sparse and extensive (similar to the idealized deforestation) deforestation simulations and found that the local effects using the spatial interpolation do not differ substantially. Our results also show that the modeled local effects well capture the spatial pattern of the observational studies. Since the errors often occur in the interpolation, one needs to interpret the non-local effects with these caveats in mind. Second, we assume that the local effects are only confined to deforested grid boxes, whereas the non-local effects may be active at both deforested and un-deforested grid boxes, including ocean boxes. That is, the simulated total signal at deforested grid boxes includes the sum of local and non-local effects, while the simulated signal at un-deforested grid boxes only includes the non-local effect. While this is the premise of the extraction approach, it does not account for the indirect effects over the deforested or un-deforested grid boxes. For example, grid cell A may also affect grid cell B, although they are located in the same deforested regions. And our assumption cannot capture a downstream response to an upstream deforestation. This is very important, especially in a very large deforested region. Further investigations using different approaches to detect the non-local effects are needed. Third, the ocean feedbacks are considered in the global deforestation simulations. Previous studies have indicated that the ocean variability plays an important role in modulating the biophysical effects of deforestation on climate (Ma et al 2013). However, to what extent ocean variability might have contributed to the cloud cover changes, especially for the non-local effects, needs further investigation. Furthermore, previous studies have suggested that different deforested latitudinal bands could trigger different hydrometeorological teleconnections or remote effects (Avissar and Werth 2005, Hasler et al 2009, Devaraju et al 2018). However, significant remote effects from regional deforestation only exist for very large or idealized perturbations (Lorenz et al 2016). Thus, the non-local effects strongly depend on the areal extent of forest cover changes. Note that the global idealized deforestation simulations in this study cannot be used to quantify the effects of non-local signals owing to deforestation in a specific geographical area. To do this, one would need to run state-of-the-art climate models with specific deforestation experiments. Nevertheless, our results provide a first-order estimate of the local and non-local effects of deforestation on global cloud cover.
5. Summary
Our results show that deforestation-induced cloud cover changes have a strong latitudinal dependence, with decreased cloudiness in the tropics but increased cloudiness in the temperate and boreal regions. We also suggest that there exists a non-local cloud enhancement in the temperate and boreal regions where the local effect (cloud inhabitation) is overwhelmed by the non-local effect. Deforestation effects strongly depend on the areal extent of forest cover changes (Negri et al 2004, Knox et al 2011, Khanna et al 2017, Leite-Filho et al 2021). At larger geographical scales (e.g. idealized deforestation scenarios), our results show a negative response of cloud and rainfall to linear forest loss. Thus, deforestation affects clouds linearly over time in model simulations. However, modeling studies are typically limited by coarse spatial resolution. Further investigation using various modeling approaches with improved simulation will help to provide complementary information about the global pattern of interplay between clouds and forests.
We also highlight that there exist contrasting responses of cloud cover to deforestation in observations and models. The cause of this opposite change is that observational analyses (i.e. space-for-time methodology) often assume that forests and neighboring open lands share the same regional to large-scale background state and so their difference is used to infer local effects. Therefore, the observation-based analysis ignores or minimizes the remote or non-local impacts, and these observational results cannot be directly compared with the GCM-simulated total effects (from local plus non-local). Our modeling results clearly demonstrate that the relationship between changes in cloud cover and deforestation would be misinterpreted without considering the non-local signals.
Acknowledgments
This work was supported by the National Key R&D Program of China (2022YFF0801601), the National Natural Science Foundation of China (42075022) and the National Natural Science Foundation of Jiangsu Province (BK20200096). We acknowledge the World Climate Research Programme, which, through its Working Group on Coupled Modelling, coordinated and promoted CMIP6. We thank the climate modeling groups for producing and making available their model output, the Earth System Grid Federation (ESGF) for archiving the data and providing access, and the multiple funding agencies who support CMIP6 and ESGF.
Data availability statement
The CMIP6-LUMIP output can be found at https://pcmdi.llnl.gov/CMIP6/.
The data that support the findings of this study are available upon reasonable request from the authors.
Supplementary data (3.8 MB PDF)