

Abstract
The escalating climate and wildfire crises have generated worldwide interest in using proactive forest management (e.g. forest thinning, prescribed fire, cultural burning) to mitigate the risk of wildfire-caused carbon loss in forests. To estimate the risk of wildfire-caused carbon loss in western United States (US) conifer forests, we used a generalizable framework to evaluate interactions among wildfire hazard and carbon exposure and vulnerability. By evaluating where high social adaptive capacity for proactive forest management overlaps with carbon most vulnerable to wildfire-caused carbon loss, we identified opportunity hot spots for reducing the risk of wildfire-caused carbon loss. We found that relative to their total forest area, California, New Mexico, and Arizona contained the greatest proportion of carbon highly vulnerable to wildfire-caused loss. We also observed widespread opportunities in the western US for using proactive forest management to reduce the risk of wildfire-caused carbon loss, with many areas containing opportunities for simultaneously mitigating the greatest risk from wildfire to carbon and human communities. Finally, we highlighted collaborative and equitable processes that provide pathways to achieving timely climate- and wildfire-mitigation goals at opportunity hot spots.
Export citation and abstract BibTeX RIS

Original content from this work may be used under the terms of the Creative Commons Attribution 4.0 license. Any further distribution of this work must maintain attribution to the author(s) and the title of the work, journal citation and DOI.
1. An unprecedented moment for mitigating the climate and wildfire crises
Given the escalating climate and wildfire crises, governments worldwide are allocating unprecedented funding to climate- and wildfire-mitigation goals [1]. The United States (US) is no exception [2, 3], as billions of US dollars were earmarked for reducing wildfire hazard in the Infrastructure Investment and Jobs Act and Inflation Reduction Act. In forests, humans can reduce wildfire hazard with forest thinning and prescribed or cultural burning prior to wildfire [4] (hereafter such treatments are called 'proactive forest management'). Although not all treatments intersect wildfire during their lifespan [5], treated stands that burn retain carbon in living vegetation and organic soil after wildfire [6–8]. In turn, forests maintain carbon sequestration and storage, which helps humans achieve climate-mitigation goals by keeping carbon out of the atmosphere [6, 9, 10]. In this way, humans and forests interact reciprocally in a coupled human and natural system [11]. Although the US emphasized how reciprocal relationships between humans and forests maintain carbon sequestration and storage [3, 12], initial investments in proactive forest management prioritized locations where reducing wildfire hazard would protect communities. Now the US needs additional science-based information to prioritize locations where proactive forest management could reduce risk of wildfire-caused carbon loss [12]—providing guidance on using unprecedented funding to simultaneously mitigate the escalating climate and wildfire crises.
2. Reciprocal relationships between humans and forests create opportunities to reduce wildfire-caused carbon loss
Due to changing climate and wildfire regimes, fluxes that maintain stable carbon stocks across broad spatial and temporal extents [13, 14] are being disrupted (figure 1). For example, in dry pine and most mixed-conifer forests, cultural burning by Indigenous peoples and lightning historically promoted low- to moderate-severity surface fires that affected stands on average once every 5–30 years (such systems are termed 'frequent-fire forests') [15–17]. Large trees with thick bark and high crowns survived surface fires and continued to uptake and store carbon. Additionally, surface fires stabilized carbon in organic soils [18]. However, state-sanctioned violence against Indigenous people, the smallpox epidemic, criminalization of cultural burning, and a legacy of grazing and fire suppression severed reciprocal relationships [15, 19, 20] and caused frequent-fire forests to accumulate high fuel loads during the last century. Now high fuel loads are interacting with climate change to enable more high-severity wildfire [21, 22]—losing more carbon directly to the atmosphere and transferring more carbon from live to dead pools that decompose over time.

Figure 1. Although wildfire reduces carbon stocks through emissions and decomposition, carbon stocks in forests recover over years, decades, or centuries as vegetation regenerates and sequesters carbon from the atmosphere (black arrows). Consequently, these fluxes mitigate wildfire-caused carbon loss and keep total carbon stocks in forests stable over broad spatial and temporal extents. However, due to changing climate and wildfire regimes, fluxes that maintain stable carbon stocks are being disrupted (red arrows). (a) In frequent-fire forests, high fuel loads are interacting with climate change to enable more high-severity wildfire, which releases more carbon directly to the atmosphere and transfers more carbon from live to dead pools that decompose over time. (b) Additionally, high-severity wildfire creates large burn areas with few surviving seed sources and reduces organic soil matter. Interiors of these burned areas might fail to regenerate trees and recover lost carbon—especially if wildfire is followed by hotter and drier climate conditions. (c) In infrequent-fire forests, short return intervals prevent vegetation and organic soils from fully recovering from the previous wildfire. (d) Consequently, re-burned areas may lack favorable seed sources and site conditions to regenerate trees and recover carbon, which can adversely affect broader carbon stability. Photos used with permission from (b) C Bienz and (d) J Peeler.
Download figure:
Standard image High-resolution imageIn addition to releasing more carbon to the atmosphere and transferring more carbon from live to dead carbon pools, high-severity wildfire in frequent-fire forests disrupts carbon recovery. Low severity wildfires retain surviving mature trees that continue to grow, sequester carbon, and provide seed sources that jumpstart tree regeneration and associated carbon recovery. In contrast, the interiors of large, high-severity wildfire can have few surviving mature trees nearby. Due to a lack of sufficient seed sources, trees might fail to regenerate [23–25] and frequent-fire forests may not recover lost carbon over time. Further, some burned areas experience self-reinforcing feedbacks where high-severity wildfire begets more high-severity wildfire [26–28]—shifting them to vegetation types with reduced carbon stocks. Even if sufficient seed sources are present, frequent-fire forests are facing hotter, drier climate conditions after wildfire. Hotter, drier climate conditions reduce tree regeneration through moisture stress and will likely become more widespread under climate change [29–32]. Consequently, unless humans intervene [32], interactions between future climate and wildfire could promote wildfire-caused carbon loss across broad spatial and temporal extents.
In contrast to frequent-fire forests, wet coastal and high-elevation subalpine forests contain abundant fuels that are typically too wet to burn. Fuels only dry out when unusual hot and dry conditions occur, which historically enabled high-severity stand-replacing fires to affect stands on average once every 100–300 years (such systems are called 'infrequent-fire forests') [17, 33]. Following wildfire, infrequent-fire forests recovered lost carbon through forest recovery over decades and centuries [33]. However, climate change is increasing the frequency of unusually hot and dry conditions [34] and shortening fire return intervals [35]—making it challenging to recover carbon between wildfire events. For instance, some tree species produce serotinous cones that release seeds in the presence of stand-replacing fire and enable abundant tree regeneration after wildfire. If a subsequent stand-replacing fire occurs within a few decades before forests recover and serotinous cones are produced [36], then tree regeneration after wildfire is reduced and carbon recovery can undergo a >150-year delay [37]. Additionally, early seral conditions after stand-replacing fire can increase the probability of subsequent wildfire and promote reburns that set back carbon recovery [38].
Humans can use proactive forest management to facilitate reciprocal relationships that reduce the risk of wildfire-caused carbon loss. But the consequences for carbon stocks are complex. In frequent-fire forests with low to moderate fuel loads, humans can use prescribed or cultural burns to restore low- to moderate-severity fire and maintain open forest structures that reduce subsequent wildfire hazard. In contrast, frequent-fire forests with high fuel loads may require forest thinning that selectively removes small- or medium-sized trees and understory vegetation to reduce surface fuels, while leaving mature, fire-resistant trees in place [39, 40]. Following forest thinning, forest health improves and prescribed or cultural burning can be done safely. The removal and burning of vegetation immediately reduce carbon stocks. However, empirical studies showed that if treated stands intersect wildfire within roughly ten years of treatment, they retain and sequester more carbon in living vegetation than untreated stands that also burn [6–8]. At broader spatial extents, some modeling studies observed that treated landscapes retain more carbon than untreated landscapes after wildfire [41–52], while others showed that carbon was similar or remained reduced after wildfire [53–59].
Here we identified opportunity hot spots for using proactive forest management to reduce the greatest risk of wildfire-caused carbon loss in the western US. To evaluate risk, we adopted a framework from the Intergovernmental Panel on Climate Change that defines risk as multi-dimensional and emerging from interactions among hazards and the exposure and vulnerability of affected coupled human and natural systems [60]. Recent regional evaluations on risk of wildfire-caused carbon loss provided helpful estimations of wildfire hazard and exposure [61, 62]. However, to estimate where the greatest risk of wildfire-caused carbon loss occurs and effectively mitigate it, vulnerability must be accounted for [63]. Accordingly, we evaluated vulnerability using three dimensions [60]: exposure (where wildfire hazard overlaps with carbon), sensitivity (where wildfire hazard adversely affects carbon), and social adaptive capacity (where humans can adapt or intervene to minimize effects of changing climate and wildfire regimes on forests and carbon). We used adaptive capacity in the context of social systems and institutions [60, 63–66], rather than biological traits that determine whether species can adapt to environmental change [67]. By evaluating where high social adaptive capacity for proactive forest management overlaps with the most vulnerable carbon, we highlighted opportunity hot spots that humans could proactively treat to mitigate the greatest risk of wildfire-caused carbon loss (figure 2).

Figure 2. By evaluating where high social adaptive capacity overlaps with the most vulnerable carbon, we identified opportunity hot spots that humans could prioritize and treat to facilitate the greatest reduction in risk of wildfire-caused carbon loss. To identify opportunity hot spots, we evaluated three dimensions: exposure (where wildfire hazard overlaps with carbon), sensitivity (where wildfire hazard adversely affects carbon), and social adaptive capacity (where humans can adapt or intervene to minimize effects of changing climate and wildfire regimes on forests and carbon). Humans can use social adaptive capacity to build reciprocal relationships that help forests sequester and store carbon—thereby keeping carbon out of the atmosphere. Although the framework can be applied for any treatments, we highlighted forest thinning and prescribed or cultural burning to underscore locations where humans could proactively reduce the risk of wildfire-caused carbon loss.
Download figure:
Standard image High-resolution image3. Where is carbon most exposed and sensitive to wildfire?
To identify where the greatest risk of wildfire-caused carbon loss occurs, we developed composite indicators for exposure and sensitivity. Composite indicators are formed by aggregating individual indicators into a single index based on an underlying model—thereby quantifying multi-dimensional components that a single indicator cannot capture [68]. To form a composite indicator for exposure at the full extent of western US conifer forests (figure S1), we aggregated individual indicators for annual burn probability (30 m resolution) and total carbon (tons/acre, 30 m resolution). Annual burn probability was extracted from a gridded dataset on wildfire hazard [69, 70]. Total carbon was estimated by matching plot IDs in gridded tree [71, 72] and fuel [73] lists to corresponding plots in the US Forest Inventory and Analysis (FIA) program [74]. Living and dead biomass in the corresponding FIA plot were converted to units of carbon using a conversion factor of 0.5 [75], while litter and duff used a conversion factor of 0.37 [75]. All carbon stocks were summated to quantify total carbon. Importantly, total carbon did not account for carbon stocks in organic soils, which contribute substantially to carbon storage potential [76]. We used min-max normalization to scale minimum and maximum values of annual burn probability and total carbon to 0 and 1 (figure S2). Afterward we weighted the normalized individual indicators equally and added them together [68] to create a gridded dataset for exposure that varied from 0 to 1 (30 m resolution). We interpreted carbon in pixels with values near 1 as most exposed to wildfire, as these locations contained the most total carbon and experienced the highest annual burn probability.
To complement exposure, we developed a composite indicator for sensitivity using indicators on potential carbon loss and carbon recovery following wildfire. To quantify carbon loss, we combined the gridded tree [71, 72] and fuel [73] lists and pixel-specific flame length probabilities [70] with the Fire and Fuels Extension Forest Vegetation Simulator to estimate how much carbon would be emitted directly to the atmosphere during a wildfire event (tons/acre, 30 m resolution). Additionally, we applied a 50 year half-life [77] over 30 years to fire-killed biomass to estimate how much carbon would be released indirectly through decomposition over time (tons/acre, 30 m resolution). For carbon recovery, we extracted individual indicators from gridded datasets on site productivity (30 m resolution) [74] and post-wildfire conifer regeneration probability (480 m resolution) [32]. Given that site productivity and post-wildfire regeneration influence forest recovery and growth after wildfire, we assumed both to be good proxies for likelihood of associated carbon recovery. To ensure individual indicators contributed equally to the composite indicator, we log transformed total carbon loss and site productivity because both were right-skewed (figure S3). Afterward all indicators were min-max normalized, weighted equally, and added together [68] to create a gridded dataset for sensitivity that varied from 0 to 1 (30 m resolution). We interpreted carbon in pixels with values near 1 as most sensitive to wildfire, as these locations would lose the most carbon due to wildfire and had the lowest likelihood of carbon recovery.
We observed heterogeneity in risk of wildfire-caused carbon loss across western US conifer forests due to spatial variation in exposure, sensitivity, and vulnerability (figure 3). Notably, the spatial variation highlighted how our findings extended knowledge from previous regional evaluations on hazard and exposure [61, 62]. The most exposed carbon was not necessarily the most sensitive—highlighting the need for examining risk as multi-dimensional. Relative to their total conifer forest area, states containing the greatest proportion of most exposed carbon (i.e. pixels with high burn probability-high total carbon, high burn probability-moderate total carbon, and moderate burn probability-high total carbon) were California (63%), New Mexico (49%), and Arizona (44%). In contrast, states with the greatest proportion of most sensitive carbon (i.e., pixels with high carbon loss-low carbon recovery, high carbon loss-moderate carbon recovery, and moderate carbon loss-low carbon recovery) were New Mexico (74%), Utah (67%), and Colorado (66%). Collectively, states with the greatest proportion of most vulnerable carbon (i.e. pixels with high exposure-high sensitivity, high exposure-moderate sensitivity, and moderate exposure-high sensitivity) were California (70%), New Mexico (56%), and Arizona (52%). Although a formal validation of the map is not possible, regional trends in the scientific literature on climate [34], wildfire activity [21, 22], and post-wildfire tree regeneration [29–32] tend to support regional trends observed in our vulnerability map.

Figure 3. We used bivariate maps to display spatial variation of carbon exposure, sensitivity, and vulnerability to wildfire across western US conifer forests (a) To display exposure, we divided normalized indicators into three quantiles to create low, moderate, and high categories for total carbon (not including carbon in organic soils) and annual burn probability. (b) Similarly, we divided normalized indicators of carbon loss (i.e., wildfire-caused carbon loss through emissions and decomposition) and carbon recovery (i.e., site productivity and post-wildfire conifer regeneration probability) into three quantiles for sensitivity. (c) We also applied three quantiles to normalized composite indicators for exposure and sensitivity to create categories for vulnerability. By displaying different combinations of categories as different colors, we could examine relationships between multiple indicators in a single map. We specifically isolated combinations of high-high and high-moderate categories (indicated with dashed lines on bar graphs and map key) to report which western US states contained the greatest proportion of carbon most exposed, sensitive, or vulnerable to wildfire relative to their total forest area. All combinations of categories were summarized for 12 western US states: Oregon (OR), Montana (MT), Idaho (ID), California (CA), Washington (WA), Colorado (CO), Wyoming (WY), New Mexico (NM), Arizona (AZ), Utah (UT), South Dakota (SD), and Nevada (NV).
Download figure:
Standard image High-resolution imageOur estimates are likely conservative because they did not account for how climate change and human ignitions will interact with current and future landscape conditions to alter wildfire regimes. For example, due to low annual burn probabilities in infrequent-fire forests, our estimates showed carbon in western Colorado, Oregon, and Washington to be less exposed to wildfire relative to other regions in the western US. However, infrequent-fire forests in these regions are already experiencing the overlap of extreme climate conditions [34, 78, 79], extreme weather events [80], and unplanned human ignitions [81]—resulting in historic wildfire seasons. Such scenarios are expected to increase under climate change [82], which will likely heighten the risk of wildfire-caused carbon loss—especially without human intervention. Additionally, the best available datasets on total carbon, annual burn probability, and total carbon loss reflected landscape conditions in 2014. Although the vintage landscape conditions made individual indicators compatible for forming composite indicators, it likely created conservative estimates of exposure and sensitivity. Nonetheless, a strength of our framework is its generalizability. As more future projections and contemporary datasets become available for the western US, they can be applied in our framework to update estimates of exposure and sensitivity.
4. Where might social adaptive capacity for proactive forest management reduce risk of wildfire-caused carbon loss?
Humans can help forests avoid wildfire-caused carbon loss by using social adaptive capacity to apply proactive forest management like forest thinning and prescribed or cultural burning. Different research communities and practitioners have adopted the term adaptive capacity—resulting in wide-ranging concepts and meanings [63, 83]. We used adaptive capacity in the context of social systems and institutions [60, 63–66], rather than biological traits that determine whether species can adapt to environmental change [67]. Importantly, social adaptive capacity to plan, implement, and maintain proactive forest management emerges from complex social, ecological, political, and economic dynamics. Consequently, social adaptive capacity cannot be estimated using quantitative datasets alone. Given these limitations, we only take a 'first cut' at estimating social adaptive capacity for proactive forest management using proxies for two components: need and feasibility.
Need and feasibility for proactive forest management vary spatially across western US conifer forests. In combination, forest thinning and prescribed or cultural burning reduce subsequent wildfire hazard even under extreme weather conditions [7, 40, 84–86]. In turn, reduction of wildfire hazard can mitigate the risk of wildfire-caused carbon loss. But forest thinning is not justifiable based on historical ecological conditions for all conifer forests [40, 87, 88] (table S1) and not all stands need forest thinning before prescribed or cultural burning. We excluded infrequent-fire forests from our estimate of social adaptive capacity because forest thinning in these historically dense forests is not justifiable based on historical ecological conditions [88]. For remaining frequent-fire forests, we matched plot IDs in the gridded tree list [71, 72] to corresponding FIA plots to calculate stand density index (SDI) for each pixel [89] (figure S4). We then divided a pixel's SDI by the maximum SDI corresponding to its forest type and geography (table S2)—thereby calculating a relative SDI [90]. We assumed that a relative SDI ⩽25% indicated a forest structure that was generally climate- and fire-resilient [90] and could be burned safely under moderate weather conditions, whereas a relative SDI >25% suggested high fuel loads that could justify forest thinning. Finally, we applied ecological (e.g. fire behavior fuel models, previous wildfire severity), legal (e.g. land ownership, wilderness areas, distance to perennial stream or perennial wetland), and operational (e.g. distance to road) constraints to identify locations where treatments were not feasible and excluded them from our estimate of social adaptive capacity (table S3).
By evaluating the need and feasibility of proactive forest management, we took a first cut at estimating where social adaptive capacity might overlap with the most vulnerable carbon in western US conifer forests. We estimated social adaptive capacity and vulnerability at the pixel-level, whereas planning, implementing, and maintaining treatments occurs across broader landscapes. To reconcile these different scales, we aggregated our findings to the spatial unit of a 'fireshed' [91, 92]—a term and spatial hierarchy used for evaluating wildfire risk to human communities and adopted by the US Forest Service's Wildfire Crisis Strategy [2]. Specifically, we adopted two nested planning units: project areas at ∼10 000 hectares and firesheds at ∼100 000 hectares [91, 92]. When planning, implementing, and maintaining treatments, the objective is not necessarily to treat an entire fireshed, but to prioritize and strategically place treatments at locations with carbon most vulnerable to wildfire-caused loss. To identify such locations, we isolated the top 10% of project areas with the greatest proportion of forest area containing the most vulnerable carbon. We also identified project areas in which treatments could be applied to ⩾18% of the forest area—a previously identified threshold for reducing wildfire hazard at project-level spatial extents [93–95]. If a fireshed contained ⩾1 project area meeting both criteria, we identified that fireshed as an opportunity hot spot for reducing risk of wildfire-caused carbon loss (figure S5). We then compared our findings to previously published maps on high risk all lands firesheds for human communities in the US Forest Service's Wildfire Crisis Strategy [2] to identify opportunities to simultaneously mitigate the greatest risk from wildfire to carbon and human communities.
We identified widespread opportunities for using proactive forest management to reduce the greatest risk of wildfire-caused carbon loss (figure 4). In total, we estimated that 1,299 project areas met the criteria of containing the greatest area (top 10%) of most vulnerable carbon and enough treatable forest area (>18%) to potentially reduce wildfire hazard. Collectively, these project areas contained 40% of the area most vulnerable to wildfire-caused carbon loss in western US conifer forests. After scaling up to the fireshed-level, we estimated that 308 firesheds were opportunity hot spots for mitigating the greatest risk of wildfire-caused carbon loss, which overlapped with 45% of high risk all lands firesheds for human communities in the US Forest Service's Wildfire Crisis Strategy [2]. Specifically, 64 firesheds overlapped (figure 5)—highlighting potential areas for using proactive forest management to simultaneously mitigate the greatest risk from wildfire to carbon and human communities in the western US.
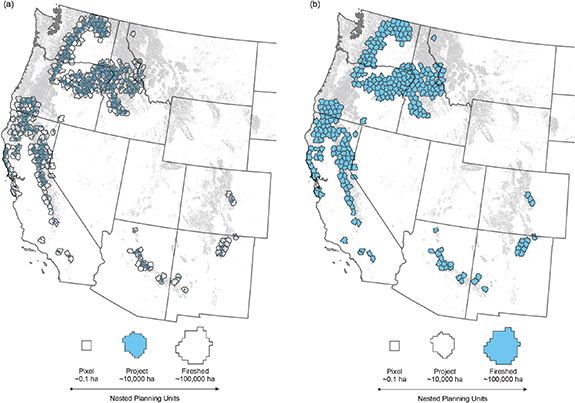
Figure 4. To aggregate pixel-level findings to broader and more management-relevant spatial extents, we used nested spatial units from the fireshed spatial hierarchy [91, 92]. Highlighted in blue are the widespread opportunities for using proactive forest management to reduce the risk of wildfire-caused carbon loss at both the (a) project area and (b) fireshed levels. In total, we estimated that 1,299 project areas meet the criteria of containing the greatest area (top 10%) of carbon most vulnerable to wildfire-caused loss and enough treatable forest area (>18%) to reduce wildfire hazard. At the fireshed level, we estimated that 308 opportunity hot spots exist, which could be prioritized and treated proactively to reduce the greatest risk of wildfire-caused carbon loss.
Download figure:
Standard image High-resolution image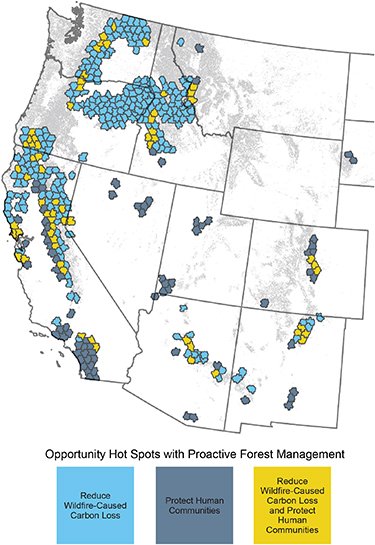
Figure 5. We observed opportunities for using proactive forest management to simultaneously mitigate the greatest risk from wildfire to carbon and human communities in the western US. Although the framework can be applied for any treatment, we highlighted forest thinning and prescribed or cultural burning to identify opportunity hot spots where humans could proactively reduce the risk of wildfire-caused carbon loss. After overlaying our 308 opportunity hot spots on previously published maps of 140 high risk all lands firesheds for human communities [2], we observed that 64 firesheds overlapped. Here we represented those firesheds in gold to emphasize that improving reciprocal relationships between humans and forests can support multiple ecological, social, and cultural values concurrently.
Download figure:
Standard image High-resolution image
5. How can opportunity hot spots reduce the risk of wildfire-caused carbon loss?
5.1. Invest in community-based collaborations that facilitate cross-boundary treatments
Addressing the climate and wildfire crises not only requires strengthening reciprocal relationships between humans and forests, but also improving relationships among humans. Although risk-informed prioritization maps can identify target geographies, they do not account for complex social, ecological, political, and economic dynamics occurring locally [96]. Accordingly, our maps are not intended to replace local knowledges or values that ultimately inform proactive forest management. Rather, our maps could inform and help prioritize investments in community-based collaborations that plan, implement, and maintain treatments. Ideally, community-based collaborations represent people and agencies that reside in a particular place and share a collective interest in its well-being. Further, community-based collaborations typically represent places with multiple land ownerships—requiring collective buy-in from diverse landowners and agencies to sustain place-based solutions to shared challenges at scale. From a forest, carbon, and wildfire perspective, collaborative processes tend to facilitate proactive forest management that is large in extent and crosses land ownership boundaries [97]. In turn, for project areas containing multiple land ownerships, collaboration can make the goal of treating ⩾18% of forest area more feasible. As a result, providing public investments to community-based collaborations could facilitate the collective buy-in needed to reduce risk of wildfire-caused carbon loss at opportunity hot spots.
5.2. Honor indigenous knowledges and prioritize equity
Improving relationships among humans requires community-based collaborations to prioritize groups that were historically excluded from forest and fire management. For example, tribes hold long-standing, place-based Indigenous knowledges on living with wildfire and adapting to environmental change [14, 98, 99]. However, their Indigenous knowledges and participation were excluded from forest and fire management following colonization [15, 20] and barriers still exist today [100]. For instance, agency requirements for burn permits have historically not aligned with legal complexities that tribes experience with land tenure, sovereign immunity, state and federal recognition, and jurisdiction [100]. In response, agencies that want to make participation more equitable could amend requirements for burn permits to better align with unique legal standings and affirm tribal sovereignty [100]. Additionally, agencies could build capacity for personnel who understand those legal standings and assist tribes with navigating agency requirements [99]. By building equitable processes that open Western, agency-driven models of forest and fire management to more participation from tribes, relationships can more fully inform [101–103] how to reduce wildfire hazard in a particular place [104].
5.3. Plan, implement, and maintain treatments that reduce wildfire hazard and support fire-resilient forests
In opportunity hot spots that community-based collaborations collectively choose to prioritize reducing the risk of wildfire-caused carbon loss, planning, implementing, and maintaining proactive forest management can mitigate risk [4]. Again, the objective is not to treat the entire fireshed, but to prioritize and strategically treat locations that optimize reducing the risk of wildfire-caused carbon loss. If the most vulnerable carbon spans land ownership boundaries, then cross-boundary treatments will likely achieve the greatest risk reduction. Importantly, for stands with high fuel loads, combining forest thinning with prescribed or cultural burning is more effective at reducing wildfire hazard than either treatment alone [40, 105–108]. Forest thinning preserves large, mature trees and selectively removes small- to medium-sized trees and understory vegetation—making stands more resistant to wildfire and other forest disturbances [4, 39, 40]. By restoring low- to moderate-severity fire afterward, wildfire hazard is reduced and carbon is more likely to be retained in living vegetation and organic soil when wildfire occurs [6–8]. To sustain that reduction and continue mitigating risk of wildfire-caused carbon loss, community-based collaborations should apply maintenance treatments within roughly ten years of treatment [109].
6. What are potential next steps for areas not identified as opportunity hot spots?
6.1. Build social adaptive capacity for managed wildfire and tree planting to reduce risk of wildfire-caused carbon loss
Due to the ecological, legal, and operational constraints of forest thinning and prescribed or cultural burning, some areas containing the most vulnerable carbon did not meet our criteria for defining opportunity hot spots. For example, infrequent-fire forests in northern Idaho and northwest Montana contained most vulnerable carbon, but forest thinning is not justifiable based on historical ecological conditions in these forest types [87]. In such areas, community-based collaborations can still address wildfire-caused carbon loss by building social adaptive capacity for managed wildfire and tree planting. Managing wildfire for resource benefit under moderate weather conditions can reduce the severity of subsequent wildfires [26–28, 110–113], which mitigates future carbon loss and supports carbon recovery. Following wildfire, planting trees at resilient densities [107] in burn areas where wildfire and climate interactions reduce natural tree regeneration also supports carbon recovery. Importantly, planting provides opportunities to establish tree species adapted to hotter, drier climate conditions that might better sustain carbon stocks under climate change [114]. By building social adaptive capacity for managed wildfire or tree planting, alternative pathways become available for building reciprocal relationships between humans and forests that reduce risk of wildfire-caused carbon loss.
6.2. Support opportunities that reduce risk from wildfire to other social, cultural, or ecological values
Areas not identified as opportunity hot spots are still important areas for reducing risk from wildfire to other social, cultural, or ecological values. For example, beyond carbon, the US wants to boost reciprocal relationships between humans and forests to safeguard municipal watersheds, old-growth forests, wildlife habitat, and socioeconomically vulnerable communities [2, 12]. Additionally, reciprocal relationships between humans and forests can maintain culturally important plants, habitats, and traditional practices [115]. Given that a strength of our framework is its generalizability, any community-based collaboration can use it to create comparable evaluations [116] that identify where human interventions might reduce the greatest risk from wildfire to prioritized values. Notably, as highlighted in certain opportunity hot spots with carbon and human communities, human interventions can address multiple goals simultaneously. If synergies and trade-offs between goals are balanced strategically, then community-based collaborations can promote co-benefits that safeguard multiple social, cultural, or ecological values.
7. Conclusions
We used a generalizable framework that embraced multiple dimensions of risk and applied it to evaluate where the greatest risk of wildfire-caused carbon loss occurs in western US conifer forests. We highlighted that the most exposed carbon was not necessarily the most sensitive—revealing the need to evaluate risk as multi-dimensional. Relative to their total forest area, California, New Mexico, and Arizona contained the greatest proportion of carbon most vulnerable to wildfire-caused loss. Importantly, we saw widespread opportunities for using proactive forest management to reduce the greatest risk of wildfire-caused carbon loss, with many areas containing opportunities for simultaneously mitigating the greatest risk from wildfire to carbon and human communities. Finally, we underscored collaborative and equitable processes that provide pathways for achieving timely climate- and wildfire-mitigation goals at opportunity hot spots.
Acknowledgments
We thank Kimberly Hall for contributing to the project's literature review. J L P was supported by The Nature Conservancy NatureNet Science Fellowship and the Department of the Interior's North Central Climate Adaptation Science Center through Cooperative Agreement G18AC00325 from the United States Geological Survey. PEH was supported by the Department of the Interior North Central Climate Adaptation Science Center through Cooperative Agreement G18AC00325 from the United States Geological Survey. KTD and KLR were supported by the Missoula Fire Sciences Laboratory of the Rocky Mountain Research Station. L M, K L M, T W, M D R, R D H, J E F, R N A, S B, K B, M J C, T B C, E S, R S, and N W were supported by The Nature Conservancy. The authors have confirmed that any identifiable participants in this study have given their consent for publication.
Data availability statement
The data that support the findings of this study are openly available at the following URL/DOI: https://datadryad.org/stash/dataset/doi:10.5061/dryad.qnk98sfnn.
Supplementary data (0.8 MB PDF)