

Abstract
Air stagnation refers to an extended period of clear, stable conditions which can favour the accumulation of pollutants in the lower atmosphere. In Europe, weather conditions are strongly mediated by the North Atlantic eddy-driven jet stream. Descriptions of the jet stream typically focus on its latitudinal position or the strength of its wind speed, and its impacts are often studied under different latitudinal regimes of the jet. Herein, we evaluate the influence of the jet stream on European air stagnation using a new multiparametric jet diagnostic that provides a more complete description of jet stream characteristics. We report large influences of the jet stream on regional stagnation and uncover links with jet structure that go beyond knowledge of its latitude. Accordingly, air stagnation anomalies show different, and often opposite, responses to jets in a given latitudinal position but with different additional characteristics. Statistical modelling reveals that the monthly variability in air stagnation explained by the new jet diagnostic is substantially higher compared to one that only considers the jet's latitude and intensity. Knowledge of the average location of the jet in a given month, as described by a latitude or longitude parameter, together with the variability in the jet's shape, appear key for the statistical models of air stagnation. The relationship between air stagnation and the jet stream is often nonlinear, particularly for regions in southern Europe. For northern regions it is generally more linear, but the additional jet parameters are essential for describing stagnation variability. These results have implications for studying air stagnation and its pollution impacts in seasonal forecasts and climate change projections.
Export citation and abstract BibTeX RIS

Original content from this work may be used under the terms of the Creative Commons Attribution 4.0 license. Any further distribution of this work must maintain attribution to the author(s) and the title of the work, journal citation and DOI.
1. Introduction
Weather conditions associated with poor air quality, and the mechanisms responsible for their formation, are of particular interest to society, with thousands of deaths in Europe each year attributed to pollutants (European Environment Agency 2020). One phenomenon that allows pollutant levels to reach harmful levels is air stagnation. Defined as occasions when a stable air mass becomes stationary over a region for an extended period, pollutants can accumulate near the surface during air stagnation events (e.g. Barmpadimos et al 2011, Dawson et al 2014, Garrido-Perez et al 2018, 2019). Other phenomena, such as the advection of highly polluted air masses, can cause pollution extremes in the absence of air stagnation. Stagnation is nonetheless a key driver of pollution events, with significant increases in both particulate matter and ozone concentrations observed during stagnation events (Garrido-Perez et al 2019, 2021). Air stagnation is a useful proxy for studying pollution as it is easily identified in a variety of datasets, whilst direct pollutant data is scarcer. The mechanisms that drive air stagnation events are therefore important to investigate. Understanding the drivers of air stagnation events can provide information that may be beneficial for seasonal forecasting and climate change projections, where directly identifying air stagnation or pollution extremes can be challenging. Surface weather conditions in Europe, including air stagnation, are strongly governed by the synoptic- to large-scale circulation over the region (Gaetani et al 2011, Mahlstein et al 2012, Santos et al 2013, García-Herrera et al 2019, Maddison et al 2021). Air stagnation has been linked to the North Atlantic-European atmospheric circulation (Maddison et al 2021) through circulation features associated with high pressure systems, such as blocks (Hamburger et al 2011, Garrido-Perez et al 2017, Vautard et al 2018), Rossby wave breaking (Webber et al 2017), and subtropical ridges (Ordó nez et al 2017, Maddison et al 2021). These synoptic-scale weather systems are strongly related to the eddy-driven jet stream (EDJ) (e.g. Vallis and Gerber 2008, Michel and Rivière 2011, Hannachi et al 2012, Madonna et al 2017). Indeed, some studies have shown a direct impact of the EDJ on air stagnation in Europe (Barnes and Fiore 2013, Shen et al 2015, Ordó nez et al 2017).
Due to the multi-faceted nature of the EDJ, it is desirable to have an objective diagnostic that describes EDJ characteristics, such as its location, strength or orientation. Several diagnostics have been introduced to describe such features, for example the jet latitude, intensity and/or its tilt (Woollings et al 2010, Woollings and Blackburn 2012, Messori and Caballero 2015, Madonna et al 2017), but there is potential for a more complete description of the EDJ that accounts for the complex EDJ behaviour (e.g. occasions when the jet extends eastwards or when there are multiple or split jets). Considering this, in a recent study of Barriopedro et al (2022), a new multiparametric jet diagnostic was introduced that provides a more detailed description of the EDJ. The new set of jet parameters considers traditional parameters, such as the latitude of the EDJ, complemented with its latitudinal extension (i.e. the meridional width). Similarly, the intensity is complemented by including a sharpness parameter, which details how sharp, or narrow, the peak in wind speed is. The longitude of the EDJ is also accounted for, diagnosing the central longitude as well as its eastern and western extents (i.e. how zonally extended the EDJ is). The southwest-northeast tilt of the EDJ is also quantified, along with a parameter measuring the departure of the EDJ from a uniformly zonal neutral state. Together, these parameters provide a multivariate description of EDJ structure and allow insights beyond the typical latitudinal regimes of the EDJ, thus providing additional information for understanding how it influences European air stagnation.
The main aim of this study is to quantify the benefit the new multiparametric EDJ diagnostic provides for understanding how air stagnation events are related to the synoptic- to large-scale circulation over the region. Section 2 contains details of the data and methods used herein, including the statistical models used to describe air stagnation variability with the EDJ parameters. In section 3, an example of the added knowledge that the new EDJ diagnostics provide for air stagnation is given. The results of the statistical analyses are presented in section 4 and the main conclusions of the study are summarized in section 5.
2. Data and methods
Data come from the ERA5 reanalysis (Hersbach et al 2020) and cover the period 1979–2018 and all seasons. Daily mean zonal wind at pressure levels between 925 and 700 hPa (every 75 hPa) is used to calculate the daily EDJ diagnostics, which are then aggregated to monthly values for use in the statistical models. The air stagnation index (ASI) is computed from daily precipitation and wind speeds at 10 m and 500 hPa. The ASI used here is the index of Horton et al (2012, 2014), which defines a grid point as stagnant if, concurrently: (i) the daily accumulated precipitation is less than 1 mm; (ii) the daily mean wind speed at 500 hPa is less than 13 m s−1; and (iii) the daily mean wind speed at 10 m is less than 3.2 m s−1. This index benefits from its simple identification yet strong correspondence to pollutant levels in Europe (Garrido-Perez et al 2018, 2021), and its close relation to features of the synoptic- to large-scale circulation over the region (Maddison et al 2021). Five regions with homogeneous air stagnation characteristics within Europe (Garrido-Perez et al 2018) are used in the analyses presented herein: northern, central, southeastern and southwestern Europe (NEU, CEU, SE and SW, respectively) and Scandinavia (SCAN). They are shown in supplementary figure 1 (and figure 4). The regionalization enables the identification of synoptic-scale air stagnation events, i.e. those that we expect to be related to the EDJ, and the exclusion of smaller-scale stagnation events that may be more influenced by local processes and which are not the focus of this study. A region is defined as stagnant on a given day if the number of grid points within the region under stagnant conditions is above the 50th percentile of the climatology. This percentile based approach is taken, rather than requiring a certain fraction of a region to be identified as stagnant, because of the different sizes and shapes of the regions considered and the typical spatial scale of stagnation events that we are interested in (which can be smaller than certain regions). The percentile chosen here is arbitrary, but is based on an analysis of individual stagnation events in the different regions. Requiring a larger area within a region to be identified as stagnant results in the omission of many stagnation events of interest (particularly those occurring only in the eastern or western parts of NEU and CEU).
The list of parameters diagnosed for the EDJ includes: the jet intensity (int), sharpness (shar), latitude (lat), northern latitude (latn), southern latitude (lats), longitude (lon), eastern longitude (lone), western longitude (lonw), tilt (tilt) and departure (dep). Readers are referred to Barriopedro et al (2022) for a complete description of these parameters and the supplementary material for further information and the distributions of each parameter (section S2 and figure S2).
2.1. Statistical model response and predictor variables
Statistical models are frequently used to estimate the response of a given variable to a set of predictors. In this article, the number of days in a month that are stagnant is the response (target variable) to be modelled, with models constructed separately for each region and season. The predictors are generated using the ten EDJ parameters. Daily values of each EDJ parameter are used to calculate the monthly values that constitute the predictors. The monthly mean, mode and inter-quartile range (IQR) are considered for each EDJ parameter. This gives a total of 30 (10 jet parameters and 3 monthly statistics) predictors. These monthly statistics are required to characterize features of the jet that are expected to be important for air stagnation variability. Within a month they inform on: the average jet structure in that month, how variable the jet is about this average, and the most persistent jet pattern within the month. Their combination allowing the identification of regions where the jet stream has been absent during a month and therefore potentially having experienced stagnation, and vice versa. Using all the predictors in a model would however result in drastic overfitting. We therefore choose a limited set of predictors for the statistical models, with the predictors chosen via a stepwise selection procedure, described in the supplementary material (section S4). The number of predictors included can vary between region and season, though is normally between 4 and 9 (7.25 on average).
2.2. Statistical model descriptions
Two types of statistical models are used: multilinear regression models (MLRMs) and generalized additive models (GAMs). MLRMs are used to model the linear relationship between the response variable and set of predictors. They thus take the form

where Y is the monthly, regional time series of air stagnation, the Ji are the time series of the EDJ parameters chosen by the stepwise procedure, α0 is the intercept and the other αi are the regression coefficients (estimated here using a least squares approach (Montgomery et al 2021)).
GAMs are an extension of generalized linear models (themselves an extension of MLRMs) (Hastie and Tibshirani 1987, Wood 2006), which allow for nonlinearity in the relationship between the response and predictors by assuming that the response is a linear combination of nonlinear functions of the predictors. Thus, the GAMs can be written as
where Y and the Ji
are as defined above, and  are smoothing spline functions of each predictor variable. The smoothing spline functions are built using thin-plate regression splines and are used to automatically model nonlinear relationships via the combination of several polynomial basis functions. The smoothness of each predictor's spline function is achieved via generalized cross validation. The GAMs are applied to each region and season using the R package mgcv (Wood and Wood 2015) (for full details see that documentation).
Whilst air stagnation has been shown to be linearly related to some large-scale circulation predictors (such as atmospheric blocks and subtropical ridges (Maddison et al 2021)), the two types of statistical models are included herein, because nonlinear relationships may be present when considering the EDJ diagnostics and their interactions. Furthermore, including both MLRMs and GAMs, and comparing their results, allows for quantifying the nonlinear dependence of air stagnation and the EDJ.
3. Stagnation response to different jet configurations
We demonstrate, using an example, the additional information provided with the multiparametric EDJ diagnostics in figure 1. Composite anomalies of air stagnation frequency are shown for different EDJ configurations. Two composites are based solely on the latitudinal position of the EDJ, whilst the others are based on the latitudinal location and an additional EDJ parameter. For this example, the tilt and longitude are included as the additional parameters. How a day is classified as having a particular EDJ configuration is explained in the supplementary material (section S5). Herein, we consider stagnation occurring annually to ensure the composites contain enough events to be robust (seasonal composites for the same EDJ configurations are shown in the supplementary material (figures S3–S6)). Significance is calculated using a bootstrapping approach: the EDJ-based composites at each grid point are compared with 1000 composites of the same size randomly drawn from the climatology.
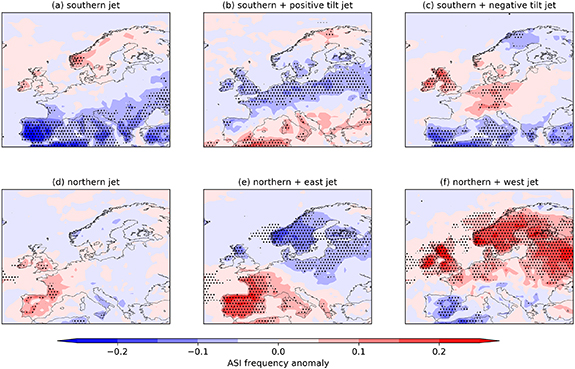
Figure 1. Annual air stagnation frequency anomalies (composite minus climatology) for days with different EDJ configurations: (a) southern, (b) southern and positively tilted, (c) southern and negatively tilted, (d) northern, (e) northern and eastern, and (f) northern and western EDJ. Statistical significance (p
 0.05) is denoted by hatching.
Download figure:
Standard image High-resolution imageIn general, the frequency of air stagnation shows expected features: wherever the EDJ is pointed will be windy and there will be reduced stagnation. When considering only the latitudinal position of the EDJ, if the EDJ is identified in its southern mode, air stagnation frequency is reduced across southern Europe (figure 1(a)). Conversely, if the EDJ is located in its northern mode, stagnation frequency increases only in southwestern Europe (figure 1(d)). In both cases the results are statistically significant. The latitude parameter of the EDJ only considers zonal wind west of the prime meridian but has clear influence across the European continent (figure 1(a)), suggesting that coherent jet structures extend beyond the Atlantic and reach Europe.
Constructing the composites with an additional parameter of the EDJ produces vastly different (and often opposite) responses in air stagnation behaviour. Considering days when the EDJ is both located in its southern mode and with a positive tilt, the reduced stagnation frequency anomaly is shifted to the north and increases are present for the far south of Europe and northern Africa (figure 1(b)). In contrast, the response in air stagnation is different when the EDJ is in its southern mode but with negative tilt (figure 1(c)). This is again understood by considering which part of Europe is experiencing strong winds and an absence of stagnation based on the parameters considered. Likewise, when the EDJ is in its northern mode and additionally to the east, stagnation is more frequent in southwestern Europe and less frequent over the northwest (figure 1(e)). This pattern is roughly reversed if the EDJ is in its northern mode and located in the western Atlantic (figure 1(f)). In this case the highest winds will be located further upstream, and likely further north, than the European continent and therefore stagnation can be prevalent for much of central and northern Europe. Again, the largest composite anomalies based on two EDJ parameters are statistically significant. These results are clear evidence that there is additional information about air stagnation behaviour that can be exploited by considering the new EDJ diagnostics.
From the joint anomalies shown in figure 1, nonlinear relationships between the EDJ parameters and air stagnation can also be inferred (as supported by the asymmetric responses to opposite EDJ parameters). We also expect nonlinear relationships between air stagnation and the jet parameters from a physical standpoint. Considering jet latitude as a simplified example, we expect anomalies in stagnation to be positive either side of the jet and negative at its centre, and hence a nonlinear relationship between stagnation and jet latitude (such stagnation anomalies are shown in figure S8). This supports the inclusion of GAMs as well as MLRMs in the following sections. Other composites, such as for northern EDJ that additionally have positive or negative tilts, also suggest nonlinearity. For example, for northern and positively tilted EDJ, the largest signal is an increase in stagnation frequency over the United Kingdom and western central Europe, whereas for northern EDJ with negative tilts, a tripole in stagnation frequency anomalies is present, with positive anomalies over Iberia and Scandinavia and negative across central Europe (shown in figure S7). The stagnation response to the different EDJ states shown in figure 1 is generally consistent across the five regions used in the regionalization (section 2), as is the variability in stagnation for the same EDJ configurations (figure S9). We therefore conclude that intra-regional variability in air stagnation is small and the regionalization is appropriate for studying the impact of the EDJ on air stagnation.
4. Statistical models of air stagnation
4.1. Model skill
To demonstrate the added benefit of the new EDJ diagnostics in terms of understanding air stagnation variability, we construct two sets of statistical models as described in section 2.1. One with all the EDJ parameters available for the stepwise procedure to choose from, and another with only those terms based on the latitude and intensity parameters. The differences in skill between these two models can therefore be attributed to the consideration of the new parameters. The models' skills (R2 for the MLRMs or explained deviance for the GAMs) are shown in figure 2 for each season and region (defined in section 2).
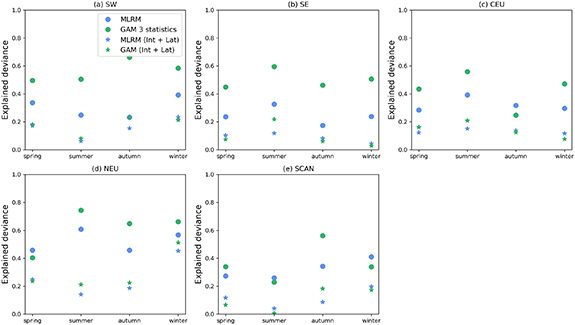
Figure 2. Statistical model skill of the monthly variability in air stagnation for each region (panels) and season (x-axis). Explained deviance is shown for generalized additive models (green markers) and R-squared for multilinear regression models (blue markers). Symbols denote statistical models using as predictors the latitude and intensity parameters of the EDJ (stars), and the full set of EDJ parameters (circles).
Download figure:
Standard image High-resolution imageThe best models are obtained when using GAMs and when selecting predictors from the full set of EDJ parameters, with the explained deviance typically between 0.4 and 0.7 for regions other than SCAN (where the skill is slightly lower). Air stagnation in SCAN is dominated by blocking occurring locally (Maddison et al 2021), variations in which have been shown to be relatively unconnected to the EDJ latitude (Madonna et al 2017), which may explain the lower skill of the models in this region. Including the additional jet parameters nevertheless improves the skill and suggests blocking in Scandinavia is related to a jet parameter other than latitude. These results have the following implications. First, there is a nonlinear relation between stagnation and the EDJ parameters (the GAMs' skills are higher than the MLRMs, comparing blue and green markers in figure 2). This is particularly evident when additional EDJ parameters are considered (blue and green circles in figure 2). Nonlinear relationships exist because stagnation can respond in strongly different ways depending on the EDJ parameters and their combinations (as highlighted in figure 1). Second, additional EDJ parameters (other than latitude and intensity) are required for a better description of air stagnation variability (comparing circles and stars in figure 2). These two factors combine to yield the highest skill. The added value of the new EDJ parameters and the degree of nonlinearity in the stagnation-EDJ linkages varies with region and season. In general, the new EDJ parameters add the most skill in northern regions (blue and green symbols are often closer than circles and stars for NEU, CEU and SCAN; figures 2(c)–(e)), meaning that the information carried by these additional EDJ parameters benefits the representation of stagnation responses to blocking events (the main drivers of stagnation therein; (Maddison et al 2021)). On the other hand, the additional effect of including nonlinearity in the model is more beneficial for southern Europe than for northern Europe (blue and green circles are further apart for SW and SE in figures 2(a) and (b). Nonlinearity may be stronger for southern Europe as stagnation in these regions is often influenced by subtropical ridges and the subtropical jet (e.g. Maddison et al 2021), which are nonlinearly related to the EDJ (Lee and Kim 2003). There may be additional sources of nonlinearity in the jet-stagnation relationship in southern Europe, the analysis of which goes beyond the scope of this article.
To check that the GAMs are not acquiring more skill because they are suffering from overfitting, which is a strong possibility here due to the relatively short time series of data and the associated reduced degrees of freedom, we use a cross validation approach (following Simpson et al (2018)). We split the time series into training and test subsets (containing 100 and 20 months, respectively), fit the GAMs on the training portion of the data and use the predictors and parameters obtained to predict the test data. The correlation between the true ASI time series and the GAM-output ASI time series is compared across all training periods (shown in supplementary figure S10). A model is typically said to fail if the 10–90th percentile range in the test correlations cross the zero line. Only one of our GAMs (in SE during winter) fails this test and will not be included in the following analyses. Correlations for the training and test data are generally similar for the other regions and seasons, suggesting the models are not overfit and provide reliable information.
4.2. Important jet parameters for air stagnation
The stepwise selection procedure used here enables a discussion on relevant EDJ parameters for air stagnation variability in Europe. When combined with GAMs, additional information can be gleaned concerning the added values of the selected EDJ parameters in terms of model skill. The leading predictors selected by the stepwise approach, and therefore those most related to stagnation variation, are summarized in figure 3. The number of times each parameter is included among the leading three predictors for all of the GAMs (across all regions and seasons) is shown by the bar height. The statistic category (termed average for mean and mode and variation for IQR) of the included predictors is denoted by colour, and the width of the bars measure the average skill that the predictors contribute to the GAMs. Note that because there are two average statistics and only one variation statistic, the latter's relative selection is higher than suggested in figure 3. The seasonal and regional dependence in the included predictors is explored below, but we first consider Europe and the year as a whole, to provide an overview of the EDJ diagnostics' influence on air stagnation. The western longitude and tilt terms are the most often included in the models, suggesting that the westward elongation of the EDJ and zonal asymmetries are key for describing stagnation variability. However, as all the predictor terms interact and can influence each other nonlinearly in the GAMs, the interpretation of individual predictors should be taken with care. The intensity and latitude terms are not among the most frequently selected in the GAMs, which explains the improvement in model skill when all EDJ diagnostics are used. However, other parameters describing the location (and often highly correlated with latitude), such as the southern and northern latitudes and longitude, are frequently included, confirming that knowledge of the EDJ position is important for air stagnation. The comparatively more limited information provided by the EDJ latitude could arguably be explained by the partial loss of its typical trimodal distribution (with southern, central and northern peaks in jet latitude) on monthly scales, or simply because other skilful correlated parameters are preferred by the model.
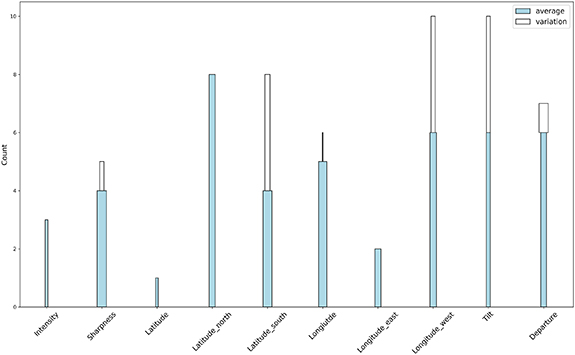
Figure 3. Relevant EDJ parameters for air stagnation variability (all European regions and seasons combined). The height of the bars indicates the number of times an EDJ parameter is included among the three leading predictors in the GAMs. The colour represents the statistic of the included predictors (either monthly average or intra-monthly variability), and the width of the bars is proportional to the mean added skill of the predictor to the GAMs.
Download figure:
Standard image High-resolution imageRegarding the statistic of the included predictors, both averages and variability of the parameters are frequently selected. Overall, the monthly averages of the predictors tend to contribute most to the GAMs skill. In particular, the average sharpness, longitude and northern latitudes are relevant aspects of the EDJ. However, for other EDJ parameters, such as the tilt and departure and southern latitude, the intra-monthly variability is as important than the average. This indicates that day-to-day variations in the zonality of the EDJ are related to air stagnation variability, suggesting that these terms (together with other terms localizing the mean jet) effectively capture the spatial distributions of the ASI components over Europe.
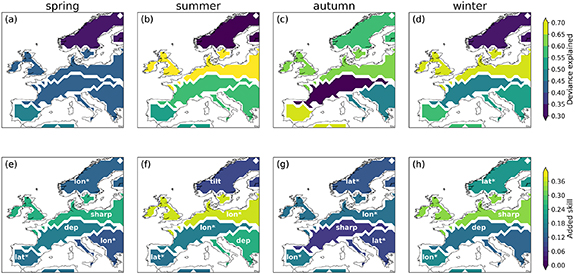
Next, we identify the most important predictors for stagnation in each region and season separately, and their added skills. The total deviance explained by the GAMs is shown for each region and season in figure 4(top row), together with the leading predictor and the deviance explained by that predictor alone (bottom row). The total deviance in air stagnation explained by the EDJ parameters varies between 0.25 and 0.75, depending on the region and season. The deviance explained is often higher for NEU when compared to the other regions (except for springtime).
The most influential EDJ parameter on stagnation is also regionally and seasonally dependent, though those related to latitude (lat, lats and latn, denoted lat* in figure 4) or longitude (lon, lone and lonw, denoted lon*) are most commonly the best predictor. The location of the EDJ is therefore of primary importance for air stagnation, but the central latitude (lat) alone is not sufficient. The intensity is not the leading predictor anywhere, with the sharpness (i.e. the anomaly of the wind intensity with respect to the meridional mean) being preferred instead (e.g. for NEU in spring and winter and CEU in autumn). On the other hand, the departure of the EDJ is important in summer for southern Europe. High departures of the EDJ may correspond to occasions when there are multiple or split EDJs with southern branches extending towards these regions. In these cases, the latitude can be misleading and little informative on the EDJ configuration, as it will only capture one of the two branches (Madonna et al 2017, Barriopedro et al 2022).
Considering figures 3 and 4 together, we conclude that predictors localizing the EDJ (but not necessarily related to its central latitude) are often the best predictors of stagnation (figure 4), and that it is the monthly average of these predictors that is normally most important (figure 3). The shape or configuration parameters of the EDJ related to zonal asymmetries are not typically the best predictor, but their intra-monthly variations are important, being recurrently selected among the three leading predictors of stagnation variability (figure 3). Therefore, monthly variations in air stagnation are well described by knowing the average location of the EDJ together with a term describing the variability in its configuration. This additional information on daily variations of the structure from its average position results in improved model skills.
Figure 4. Top row: explained deviance of monthly air stagnation variability for each region and season in the GAMs. Bottom row: explained deviance by the predictor that provides the highest skill when it is added to the GAMs in the stepwise procedure (predictor names are shown in text). Note that the values are shown for each region (defined in section 2) and the colour scale used is different in the top and bottom panels.
Download figure:
Standard image High-resolution image
5. Conclusions
A new multiparametric diagnosis of the North Atlantic EDJ, introduced by Barriopedro et al (2022), was assessed here to quantify and better understand the role of the EDJ in driving air stagnation monthly variability. The main aim of this study was to demonstrate that the influence of the EDJ on European air stagnation is larger than that expected from the EDJ latitude and intensity only, and that the new EDJ diagnostic can help uncover novel links with air stagnation, being beneficial to describe air stagnation variability from the large-scale atmospheric circulation. The key conclusions of this work, in support of this aim, are as follows:
- The spatial patterns of air stagnation frequency anomaly on seasonal and annual scales depend on the EDJ configuration, with different combinations of EDJ parameters (even for the same latitudinal location) yielding different, sometimes opposite, regional responses in air stagnation.
- The explained variance in monthly air stagnation variability is substantially improved (typically between 30% and 70%) over five European regions and across every season when additional EDJ parameters (other than the EDJ latitude and intensity) and nonlinear dependencies are considered. In particular, important information is retrieved from a more detailed description of the EDJ structure, including aspects related to its longitudinal locations and/or extension, sharpness and zonal asymmetries (tilt and departure from zonality).
- The influence of the EDJ on air stagnation variability is region and season dependent. Furthermore, the relationship between air stagnation variability and the EDJ is nonlinear, particularly for southern European regions, where stagnation is also affected by the subtropical jet and its nonlinear interactions with the EDJ. In northern regions, stagnation tends to be dominated by blocking, and the added value of the multiparametric EDJ description is interpreted in terms of improved EDJ-based constraints of blocking impacts on air stagnation.
- In most cases (regions and seasons), the monthly variability of air stagnation can be satisfactorily described by the leading three EDJ parameters: including one localizing the average EDJ (e.g. the monthly mean or mode value of a latitude- or longitude-related parameter), and another including information on intra-monthly variations of the EDJ shape (e.g. the daily variability of zonal asymmetries within the month).
Overall, the statistical models revealed that the EDJ can explain a significant amount of air stagnation variability in all European regions. The explained variance by the EDJ is similar to that obtained when air stagnation is modelled from other predictors describing the synoptic- to large-scale circulation, such as blocking, Rossby-wave breaking and subtropical ridge indices (Maddison et al 2021). This suggests that the multiparametric EDJ description is effectively capturing key features of the atmospheric circulation that are important for air stagnation. A benefit of this novel EDJ approach is that it is calculated using only the zonal wind, which is routinely available in output from a broad range of climate products, and the resulting diagnostics (ten one-dimensional time series) are very convenient from a data management perspective.
The new EDJ parameters offer additional insights into the influence of the large-scale atmospheric circulation on air stagnation, with potential implications for the study of air pollution, for which air stagnation can often serve as a proxy in Europe (Garrido-Perez et al 2018, 2021). Stagnation is especially relevant for ozone levels in summer and particulate matter in winter. For example, the statistical models based on these large-scale predictors can complement forecasts and projections of ASI and pollutants, which may be less reliable in seasonal forecast and climate models, due to their limited spatial resolution and simplified chemistry. This is relevant since air stagnation is projected to become more frequent under climate change for many regions across the globe (e.g. Horton et al 2012, 2014, Garrido-Perez et al 2022, Maddison et al 2022), as are air pollution extremes with harmful effects on human health (European Environment Agency 2020) in certain regions (Mickley et al 2004, Wu et al 2008, Schnell et al 2016, Fiore et al 2022). Here, we have demonstrated that the EDJ provides additional understanding of air stagnation variability which can aid in this ongoing research. The new EDJ diagnostics may also offer new insights into the drivers of other high impact weather events over Europe that are related to the EDJ, such as droughts, heatwaves or extreme rainfall (Gaetani et al 2011, Mahlstein et al 2012, Santos et al 2013, García-Herrera et al 2019), opening avenues for further research.
Acknowledgment
This paper was supported by project JeDiS (Jet Dynamics and extremeS). Contract No. RTI2018-096402-B-I00, funded by the Spanish MICINN (Ministerio de Ciencia, Innovación y Universidades).
Data availability statement
The data that support the findings of this study are openly available at the following URL/DOI: https://cds.climate.copernicus.eu/#!/search?text%20=%20ERA5%26type%20=%20dataset (Hersbach et al 2020).
Supplementary data (9.6 MB PDF)