

Abstract
Cover crops have long been seen as an effective management practice to increase soil organic carbon (SOC) and reduce nitrogen (N) leaching. However, there are large uncertainties in quantifying these ecosystem services using either observation (e.g. field measurement, remote sensing data) or process-based modeling. In this study, we developed and implemented a model–data fusion (MDF) framework to improve the quantification of cover crop benefits in SOC accrual and N retention in central Illinois by integrating process-based modeling and remotely-sensed observations. Specifically, we first constrained and validated the process-based agroecosystem model, ecosys, using observations of cover crop aboveground biomass derived from satellite-based spectral signals, which is highly consistent with field measurements. Then, we compared the simulated cover crop benefits in SOC accrual and N leaching reduction with and without the constraints of remotely-sensed cover crop aboveground biomass. When benchmarked with remote sensing-based observations, the constrained simulations all show significant improvements in quantifying cover crop aboveground biomass C compared with the unconstrained ones, with R2 increasing from 0.60 to 0.87, and root mean square error (RMSE) and absolute bias decreasing by 64% and 97%, respectively. On all study sites, the constrained simulations of aboveground biomass C and N at termination are 29% and 35% lower than the unconstrained ones on average. Correspondingly, the averages of simulated SOC accrual and N retention net benefits are 31% and 23% lower than the unconstrained simulations, respectively. Our results show that the MDF framework with remotely-sensed biomass constraints effectively reduced the uncertainties in cover crop biomass simulations, which further constrained the quantification of cover crop-induced ecosystem services in increasing SOC and reducing N leaching.
Export citation and abstract BibTeX RIS

Original content from this work may be used under the terms of the Creative Commons Attribution 4.0 license. Any further distribution of this work must maintain attribution to the author(s) and the title of the work, journal citation and DOI.
1. Introduction
Cover crops, a category of plants grown between cash crop growing seasons, are capable of providing multiple ecosystem services that improve soil quality and environmental sustainability, as well as reduce agricultural inputs. In the U.S. Midwest where intense agricultural practices cause soil organic carbon (SOC) and reactive nitrogen (N) loss (Tilman et al 2002), cover crops can be adopted as a mitigation approach to reduce risks related to crop productivity and environmental quality, including soil health and fertility degradation, greenhouse gas emission increase and water body pollution (Tonitto et al 2006, Poeplau and Don 2015, Jian et al 2020, Udvardi et al 2021, Deines et al 2023). Most notably, cover crops increase SOC stocks (Poeplau and Don 2015) by increasing aboveground and belowground crop residue input and reducing SOC loss by abating soil erosion. They also reduce N leaching by scavenging excessive N and reducing soil erosion-induced N loss (Kaspar et al 2001, Blanco-Canqui et al 2013, 2015). Despite the above qualitative understanding of cover crops benefits, there are still large uncertainties in quantifying these benefits. Economic incentives based on these economic and environmental benefits with large uncertainties may reduce the willingness of farmers to adopt cover crops, and thereby hinder the promotion of cover crops. Therefore, developing robust methods to accurately quantify the ecosystem benefits of cover crops is important for the promotion of cover crops.
Common methods of quantifying environmental outcomes of agroecosystems include observations (e.g. field measurements, remotely-sensed data) and modeling (Huang et al 2019), each of which has its pros and cons. Albeit providing relatively accurate measurements of the target variable, field observations are time-consuming and expensive to collect, and thus hard to scale up (Qin et al 2021, Wang et al 2023a). Remote sensing approaches provide certain observations at higher frequencies and on a larger spatial scale, yet they may carry significant uncertainties and can hardly detect belowground properties. Furthermore, both observational approaches cannot quantify the changes in SOC accrual and soil inorganic N retention relative to those in baseline scenarios. Process-based modeling can efficiently quantify net benefits in the ecosystem services by establishing counterfactual modeling scenarios. Compared with data-driven empirical models, process-based models also provide more comprehensive results as well as better extrapolation ability (Adams et al 2013) through explicitly representing agroecosystem mechanisms. However, given the complex mechanisms represented, performance of process-based models is largely limited by uncertainties in model parameterization, input and model structure (Adams et al 2013, Huang et al 2019). One possible solution to reduce modeling uncertainties is to use observations of critical variables for rigorous calibration and validation of process-based models (Peng et al 2020, Zhou et al 2021, Guan et al 2023).
Model–data fusion (MDF) is a technique that integrates observations and models through various mathematical methods (Gettelman et al 2022), and effective MDF can leverage the benefits of these two approaches to reduce prediction uncertainties. Models in the MDF framework can be either data-driven empirical models (e.g. statistical models, neural networks) or process-based models, while sources of observations may range from point-wise field measurements to in-situ sensors, and airborne and satellite remote sensing data (Guan et al 2023, Wang et al 2023b). These measurements are used for adjusting model parameters, state variables or structure to improve model predictions. The MDF approaches have already been widely applied in climate, weather and air quality prediction (Gettelman et al 2022). In ecological studies, specifically, common MDF approaches include Bayesian inference (Ellison 2004), data assimilation (Kalnay 2003) and emergent constraint (Wang et al 2020). In this study we used remotely-sensed cover crop aboveground biomass for constraining key cover crop growth parameters of the process-based agroecosystem model ecosys, which has previously been used to quantify the C budget (Zhou et al 2021) and evaluate the impacts of cover crops on cash crop yield (Qin et al 2021) in the U.S. Midwest agroecosystems. Meanwhile, the synergy of high-resolution satellite observations (Claverie et al 2018, Thieme et al 2020) and airborne hyperspectral imagery with soil-canopy radiative transfer modeling (RTM) (van der Tol et al 2009) has already been proven capable of realistically estimating cover crop aboveground biomass (Wang et al 2023a), which provides a cost-effective approach to establish an MDF framework fed on remotely-sensed cover crop information to quantify cover crop ecosystem benefits on a larger scale.
The objectives of this study are to evaluate the influence of integrating remotely-sensed biomass into process-based models on cover crop aboveground biomass simulations, as well as quantify corresponding changes in SOC accrual and N retention net benefits. Our major hypothesis is that adding the constraints of remotely-sensed biomass to process-based models can improve cover crop biomass simulations, which will consequently constrain simulations of SOC accrual and N retention through the mechanisms above and help the overall quantification of cover crop ecosystem services. To test this hypothesis, we developed an MDF framework that integrates remotely-sensed cover crop aboveground biomass with ecosys to constrain the quantification of cover crop aboveground biomass as well as cover crop-induced SOC accrual and N retention. We ran ecosys on 13 cover crop planting sites in central Illinois to simulate cover crop biomass growth as well as changes in (i) SOC stock and (ii) N leaching due to cover crop adoption. The target variables were first simulated without and with remotely-sensed cover crop aboveground biomass to constrain the model. Then we investigated the differences between unconstrained and constrained simulations to test our hypothesis.
2. Methods and data
2.1. Overview of the MDF framework
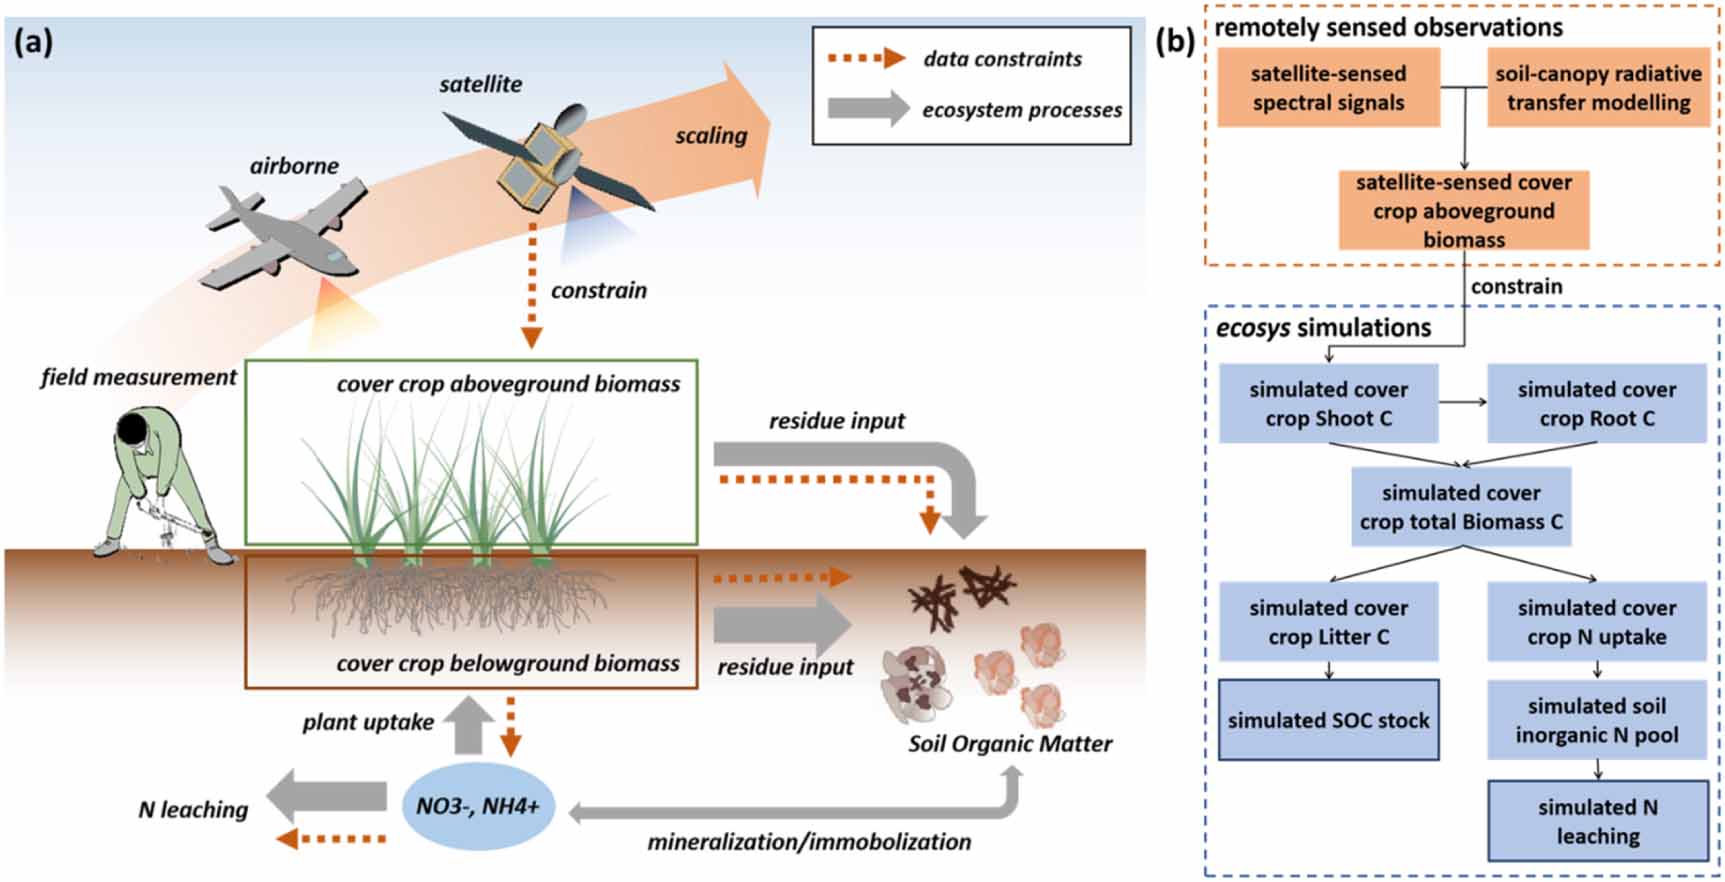
As is shown in the MDF framework (figure 1), satellite-based cover crop aboveground biomass is used to constrain cover crop aboveground and belowground biomass simulations through adjusting aboveground C fixation as well as related C allocation and biomass formation represented in ecosys. Variations in simulated cover crop aboveground and belowground biomass then change residue inputs from both parts at growth termination, which further influence the amount of SOC. Meanwhile, cover crop N uptake is also influenced due to changes in root N storage and surface area, which may consequently influence N leaching by changing soil aqueous inorganic N concentrations. Changes in other agroecosystem processes can also occur and influence SOC stock and N leaching (e.g., microbial immobilization of soil inorganic N following cover crop litter input can improve N retention). However, these influences are less dominant in quantity and thus are not discussed in detail.

Figure 1. Overview of the research framework in this study. (a) Illustration of scaling from ground observations to satellite-based observations as well as major pathways through which cover crop aboveground biomass influence SOC stock and N leaching. (b) General workflow of the proposed MDF framework.
Download figure:
Standard image High-resolution image2.2. Study sites and field data collection
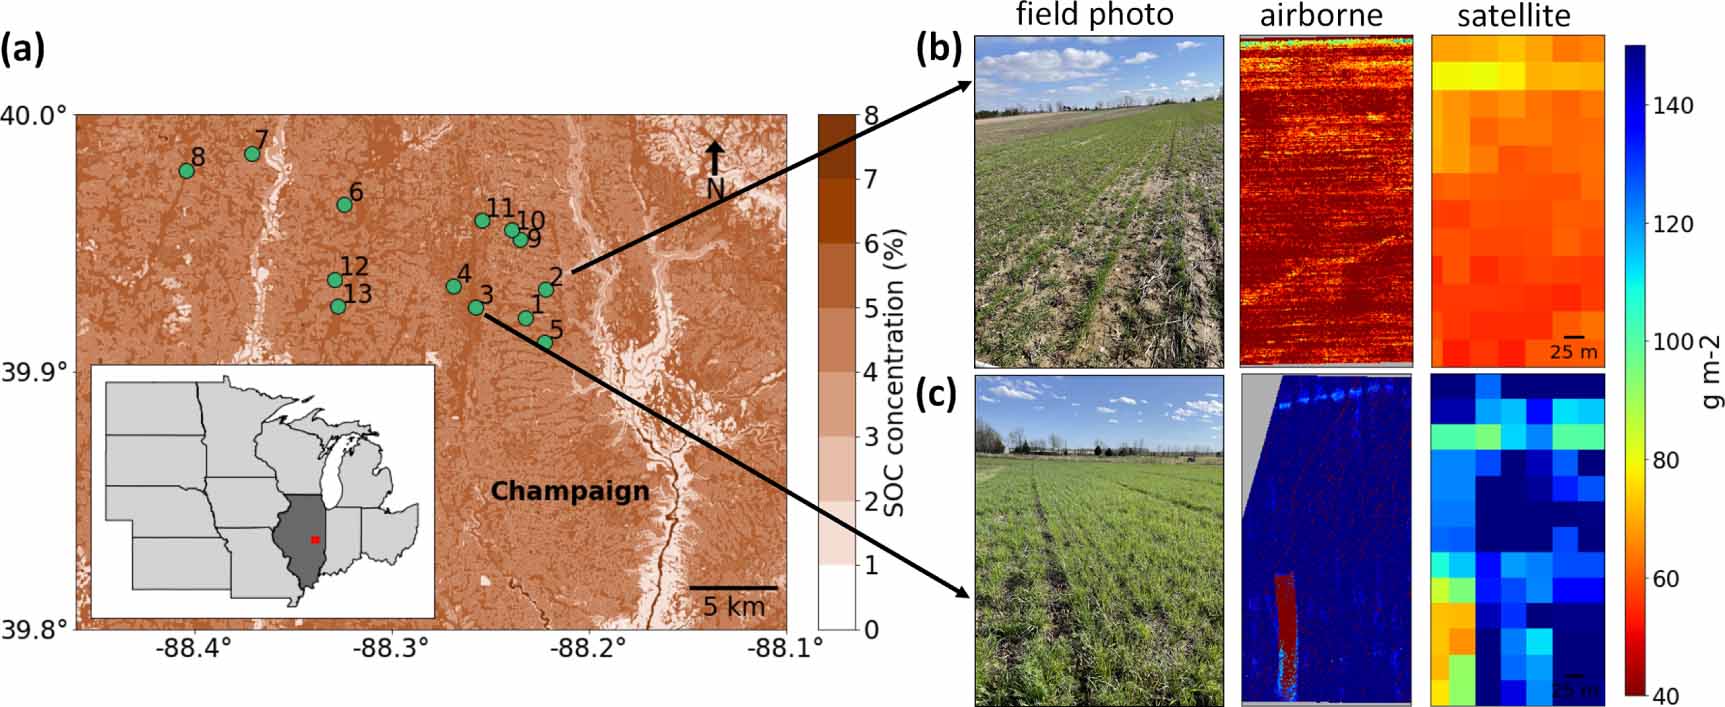
We selected 13 cover crop planting sites in central Illinois for study (figure 2(a)). The SOC concentration of these sites varied from 4.62% to 5.78%, with an average of 4.98 ± 0.38% (Potash et al 2022). Cereal rye (Secale cereale L.) was planted on all sites in autumn 2020 and terminated in spring 2021. Most of the sites were under corn–soybean rotations from 2008 to 2021 except that winter wheat was planted on site 2 in 2013 and site 11 in 2014, respectively. Cover crop aboveground biomass was collected in fields on March 20th and April 13th, 2021, with technical details described in text S1.

Figure 2. Locations of cover crop sites, distribution of SOC concentration, and examples of cover crop aboveground biomass on the study sites on April 13th, 2021. (a) Distribution of the study sites and SOC map of the studied region. (b) Field-measured, airborne and satellite-based (from left to right) cover crop aboveground biomass on site 2. (c) Field-measured, airborne and satellite-based (from left to right) cover crop aboveground biomass on site 3.
Download figure:
Standard image High-resolution image2.3. Remotely-sensed cover crop biomass measurement
An innovative and scalable ground-airborne-satellite integrated sensing framework along with RTM-based machine learning surrogate modeling (Wang et al 2021, 2023a) was developed to accurately and cost-effectively quantify field-level daily cover crop aboveground biomass. The inversion of process-based RTM SCOPE (van der Tol et al 2009) directly takes spectral reflectance as input to retrieve cover crop aboveground biomass (Wang et al 2023a), and it is more scalable than traditional empirical regression that requires intensive field measurements for model development and validation (Prabhakara et al 2015, Thieme et al 2020, Xia et al 2021). Considering the scale mismatch in directly benchmarking satellite pixels (30 m resolution) with quadrat-level field measurements (0.5 m resolution), we incorporated airborne hyperspectral data (0.5 m resolution) with rich spectral information as a bridge to fill spatial discrepancies between quadrat-level ground measurements and satellite remote sensing. More technical details about airborne hyperspectral data-based retrieval and satellite retrieval are described in text S1. We focused on aboveground biomass in the period of March 10th to May 31st, 2021, during which cover crops on all fields had detectable aboveground biomass. Planting dates of cover crops were obtained from growers, while the termination dates were inferred from the daily time series of satellite cover crop aboveground biomass. The date with maximal biomass was set as the termination date, and only data before this date were used for ecosys calibration and validation. To compare with ecosys simulations, the satellite-based cover crop aboveground biomass data were transformed into biomass C using a fixed carbon-to-biomass ratio of 42% (Wang et al 2023a).
2.4. Ecosys-based MDF
2.4.1. Model overview
Ecosys is a comprehensive mathematical model based on biophysical and biochemical mechanisms, and is capable of simulating water, energy, carbon and nutrient cycles in various natural and managed terrestrial ecosystems (Grant 2001). It has been validated in multiple studies on U.S. Midwest agroecosystem C and N cycles (Qin et al 2021, 2023, Zhou et al 2021, Li et al 2022, Yang et al 2022), which lays the foundation for using ecosys to investigate relevant processes in this study.
In ecosys, canopy fixed C is added to the mobile storage pool in branches, where it can be further oxidized to meet the needs of maintenance respiration (Grant et al 2001). The part that exceeds maintenance respiration combines with storage N and P to form new biomass (i.e. growth of length, area or volume of different organs) (Grant 1994, Grant et al 1999), which in turn influences the rates of C fixation and plant nutrient uptake. Whenever the C storage pool is depleted and C oxidation is slower than maintenance respiration, remobilizable C in leaves and twigs is oxidized to make up the gap, while the structural C detaches from the branch and becomes plant litterfall (Grant et al 2001). The litterfall is first added to a litter pool with different complexes of macromolecules (i.e. carbohydrates, protein, cellulose and lignin) as fresh organic C input, where they are further decomposed and form SOC (Qin et al 2023).
For plant N uptake, ecosys first solves for aqueous inorganic N concentrations at root and mycorrhiza surfaces in each soil layer by balancing radial transport by mass flow and diffusion with plant active uptake. Plant active N uptake is then calculated from the root and mycorrhizal length densities and surface areas, and is constrained by O2 and nutrient availability with inhibition by root N storage. The uptaken N is added to mobile storage pools in root and mycorrhizal layers and may further be used for biomass formation, be remobilized or lost to litter through senescence (Grant 1991, Grant and Robertson 1997). The dissolved inorganic N (DIN) concentrations are controlled by soil nutrient transformations through thermodynamically driven precipitation, adsorption, ion pairing reactions, convective dispersive solute transport and microbial mineralization-immobilization (Grant and Robertson 1997). The subsurface/surface DIN fluxes are simulated as the product of subsurface/surface flows and DIN concentration, with the subsurface flow calculated from hydraulic conductivity and soil water potential (matric potential + osmotic potential + gravimetric potential) gradients (Grant 2004), and the surface flux calculated from surface water velocity and water depth using Manning's equation (Mezbahuddin and Grant 2016).
2.4.2. Model setup
For model setup, we used hourly weather data from the North American Land Data Assimilation System 2 (NLDAS-2, NASA 2021). Initial soil properties on each site were extracted from the Gridded Soil Survey Geographic (gSSURGO) database, while the cash crop planting histories came from the USDA Cropland Data Layer (CDL) database. The model initialization period was 1998–2019, while the years 2020–2021 followed by a 9 year virtual simulation period were used for result analysis. To quantify the SOC accrual and N retention due to cover crop adoption, we set one cover crop planting scenario and one baseline scenario. The only difference between the two scenarios is that cover crop was planted between cash crop growing seasons during the result analysis period under the cover crop planting scenario, while there was no cover crop planted under the baseline scenario. Simulations under the baseline scenario are subtracted from those under the cover crop planting scenario to get the net ecosystem benefits brought by cover crops.
For the virtual simulation period, we used the 2012–2020 weather data and assumed corn-soybean rotation on all sites. For fertilizing we set 20 gN m−2 of urea ammonium nitrate 32 application 5 days before maize planting according to the 2018 Illinois N fertilizing statistics from USDA (https://quickstats.nass.usda.gov/results), and there was no fertilizer applied before other cash crops. No tillage or irrigation was implemented in our scenarios.
2.4.3. MDF and result analysis
To test our hypothesis about the influence of MDF on reducing simulation uncertainties of cover crop growth and ecosystem services, we compared the performance of constrained and unconstrained models. Each of the 13 sites was randomly divided into two spatially-continuous parts, and averages of satellite-based cover crop aboveground biomass on the two parts were used for model calibration and validation, respectively. For the constrained model, we calibrated planting density (recommended default value is 370 m−2 on all sites), rubisco carboxylation activity, climate zone, maturity group and primordia initiation rates to minimize the difference between satellite-based and simulated cover crop aboveground biomass during the whole growing period. The physical meaning of the calibrated parameters as well as the calibrated and pre-calibrated values are provided in table S1 and figure S1. Given the geographical proximity of study sites, we keep the climate zone constant across all sites, while other parameters may vary from site to site. The SCE-UA algorithm, which outperforms other algorithms in finding global optima (Duan et al 1994), is used for parameter optimization, and the parameter combination with the lowest average root mean square error (RMSE) compared with the satellite observation (for calibration) on all sites is selected. The calibrated and default cereal rye plant parameters were then used for simulation on the validation part of the site, and R2, RMSE and bias of the simulations compared against satellite observations (for validation) were used to evaluate the performance of the constrained and unconstrained models.
We also compared the constrained and unconstrained simulations of cover crop aboveground biomass C and N as well as net benefits in SOC accrual (ΔSOC difference) and N retention (−ΔDIN flux difference, sum of reduced surface and subsurface N leaching) on the study sites. To exclude the influence of litterfall accounted for in SOC, we calculated the annual average of these four terms during the result analysis period. The linear relationships between the annual average of termination aboveground biomass and the annual averages of the net ecosystem benefits were also investigated.
3. Results
3.1. Validation of remotely-sensed cover crop aboveground biomass
Before we used the remotely-sensed cover crop aboveground biomass for model calibration and validation, we first compared them against corresponding field measurements on March 20th and April 13th, 2021 for specific sites to validate their accuracy (figure 3). The result shows that the satellite multispectral imagery-derived measurements have relatively high performance with R2 = 0.83, RMSE = 22.53 g m−2 (38.0%) and bias = −1.46 g m−2.

Figure 3. Comparisons between field measurements and satellite multispectral imagery-based measurements of cover crop aboveground biomass on March 20th and April 13th, 2021. Error bars represent one standard deviation of the mean of field or satellite measurements.
Download figure:
Standard image High-resolution image3.2. Validation of ecosys performance in simulating cover crop aboveground biomass
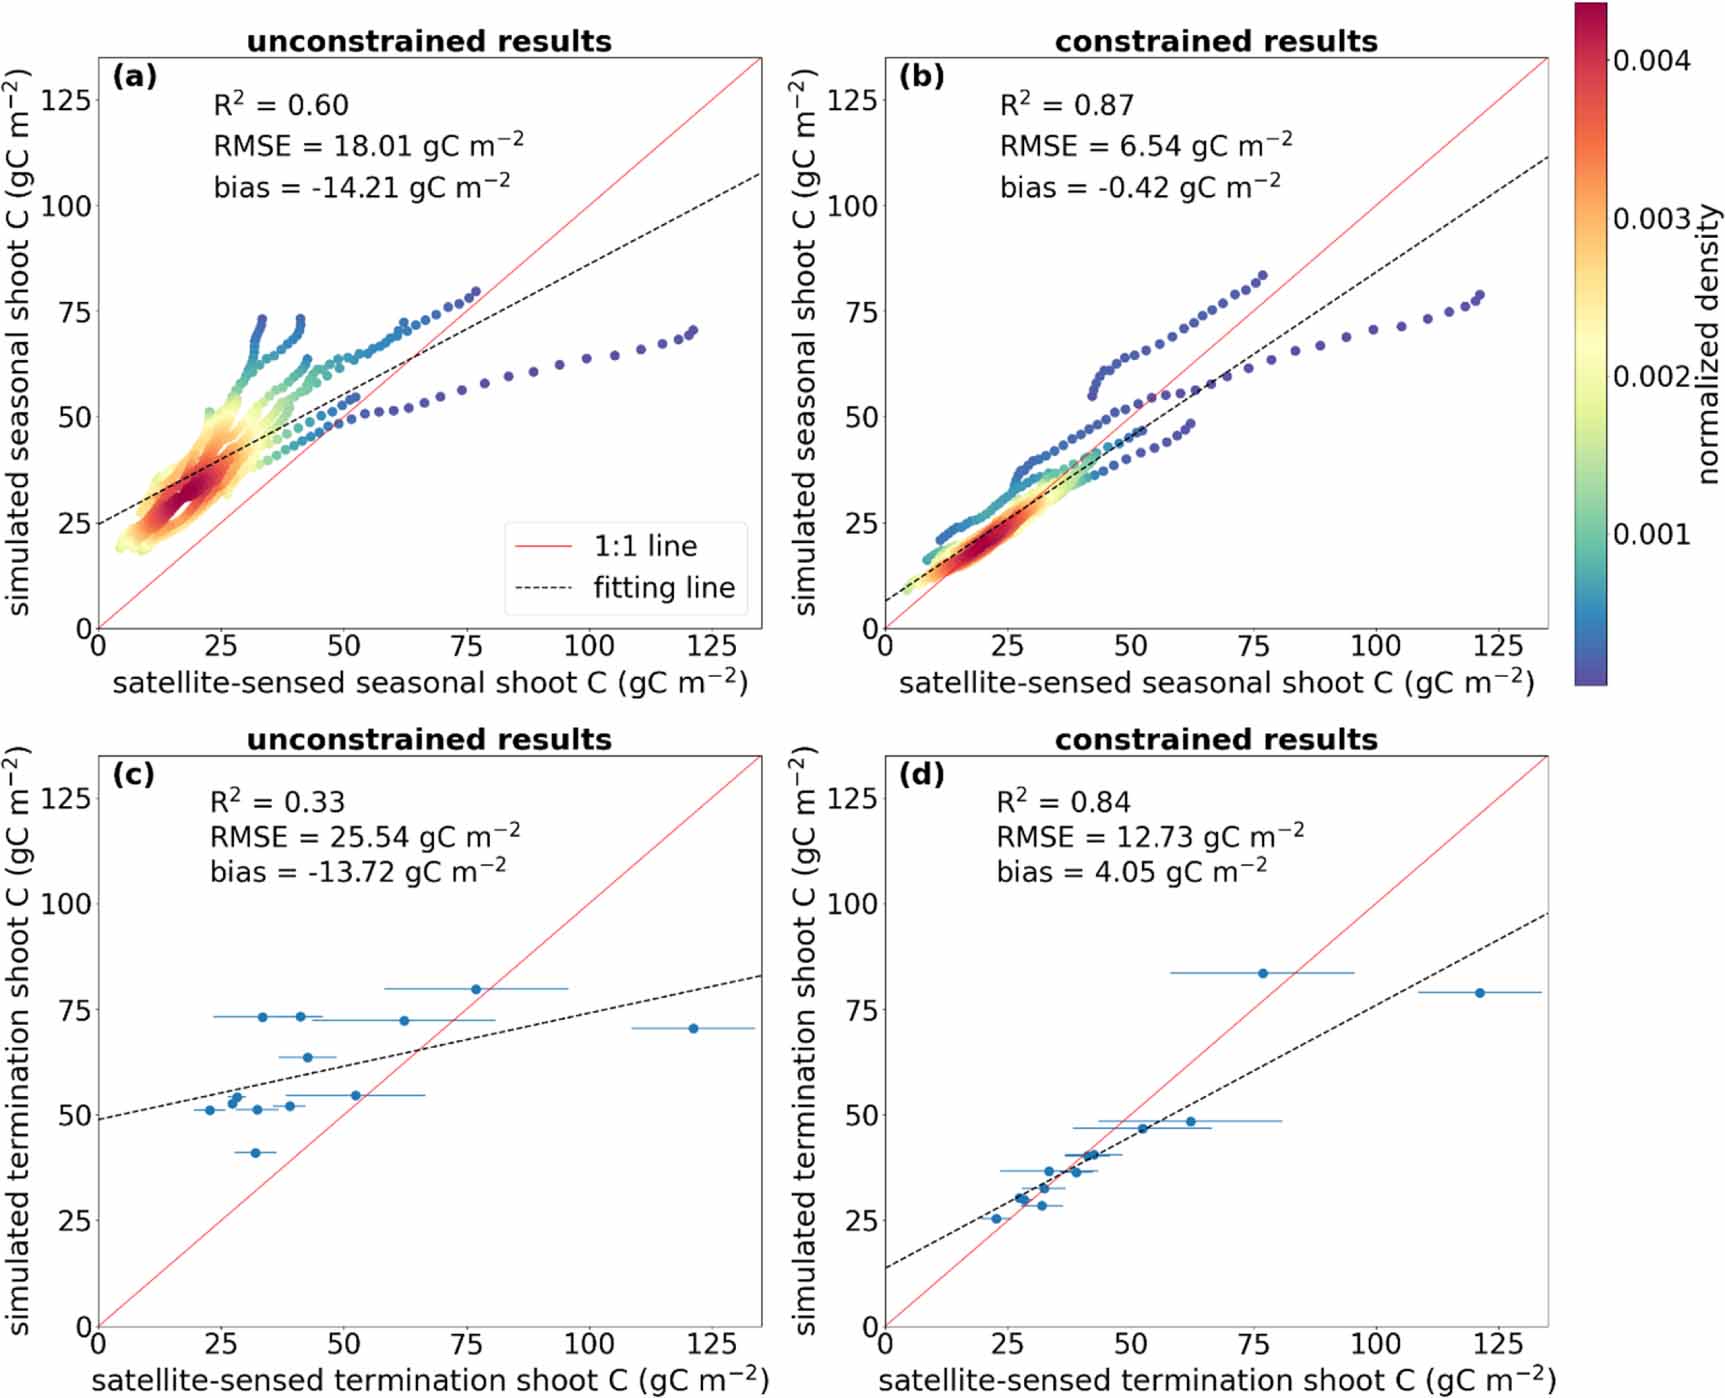
Our model validation results show that introducing remotely-sensed biomass constraints significantly improves the ecosys simulation of cover crop aboveground biomass (figure 4). There is a general overestimation for unconstrained cover crop aboveground biomass simulations, which is greatly reduced through adjusting cover crop growth relevant parameters. Constrained with remotely-sensed observations, the R2 increases significantly from 0.60 to 0.87, with RMSE and absolute bias decrease by 64% (18.01 gC m−2, 98%, to 6.54 gC m−2, 25%) and 97% (14.21 gC m−2 to 0.42 gC m−2) respectively, benchmarked with validation observations during March 10th to cover crop termination (figures 4(a) and (b)). At cover crop termination specifically, R2 increases from 0.33 to 0.84, while RMSE and absolute bias decrease by 50% (25.54 gC m−2, 70% to 12.73 gC m−2, 14%) and 70% (13.72 gC m−2 to 4.05 gC m−2) respectively after calibration (figures 4(c) and (d)). Such improvements support our hypothesis that performing MDF can effectively reduce simulation uncertainties, highlighting the necessity of using remotely-sensed observations to constrain the model.

Figure 4. Unconstrained and constrained simulations of cover crop aboveground biomass C (shoot C) vs. satellite multispectral imagery-based cover crop aboveground biomass C measurements (validation). Error bars represent one standard deviation of the mean of aboveground biomass C in the result analysis period. (a) and (b) Are the unconstrained and constrained results during the cover crop growing season, respectively. (c) and (d) Are the unconstrained and constrained simulations on the termination date, respectively.
Download figure:
Standard image High-resolution image3.3. Quantification of difference between constrained and unconstrained simulations of cover crop aboveground biomass
We further quantified the benefits of using remotely-sensed biomass observations to constrain ecosys by comparing constrained and unconstrained simulations of cover crop aboveground biomass C and N at termination on a 10-year average (figure S4). The constrained model better captures the high inter-site variability of cover crop growth: The averages of constrained simulations of termination aboveground biomass C and N on all sites are 46.07 ± 18.13 gC m−2 and 1.23 ± 0.54 gN m−2, while those of the unconstrained simulations are 63.97 ± 12.92 gC m−2 and 1.85 ± 0.38 gN m−2, respectively.
Differences between unconstrained and constrained simulations of aboveground biomass C at termination range from −11.93 gC m−2 on site 12 to 40.05 gC m−2 on site 7 (figure S4(a)). Since biomass C and N are closely connected through biomass formation, element remobilization and senescence in ecosys, variation trends in constrained simulations of cover crop aboveground biomass N are generally consistent with those of biomass C. Differences between unconstrained and constrained simulations of aboveground biomass N range from −0.16 gC m−2 on site 12 to 1.22 gC m−2 on site 7 (figure S4(b)). Overall, the unconstrained simulations of cover crop aboveground biomass C and N at termination are generally higher than the constrained ones (except for those on site 11 and site 12), and the average differences on all sites are 17.90 ± 14.17 gC m−2 (29.0 ± 20.0%) and 0.62 ± 0.38 gN m−2 (35.0 ± 19.0%), respectively.
3.4. Quantification of corresponding changes in simulations of SOC accrual and N retention net benefits
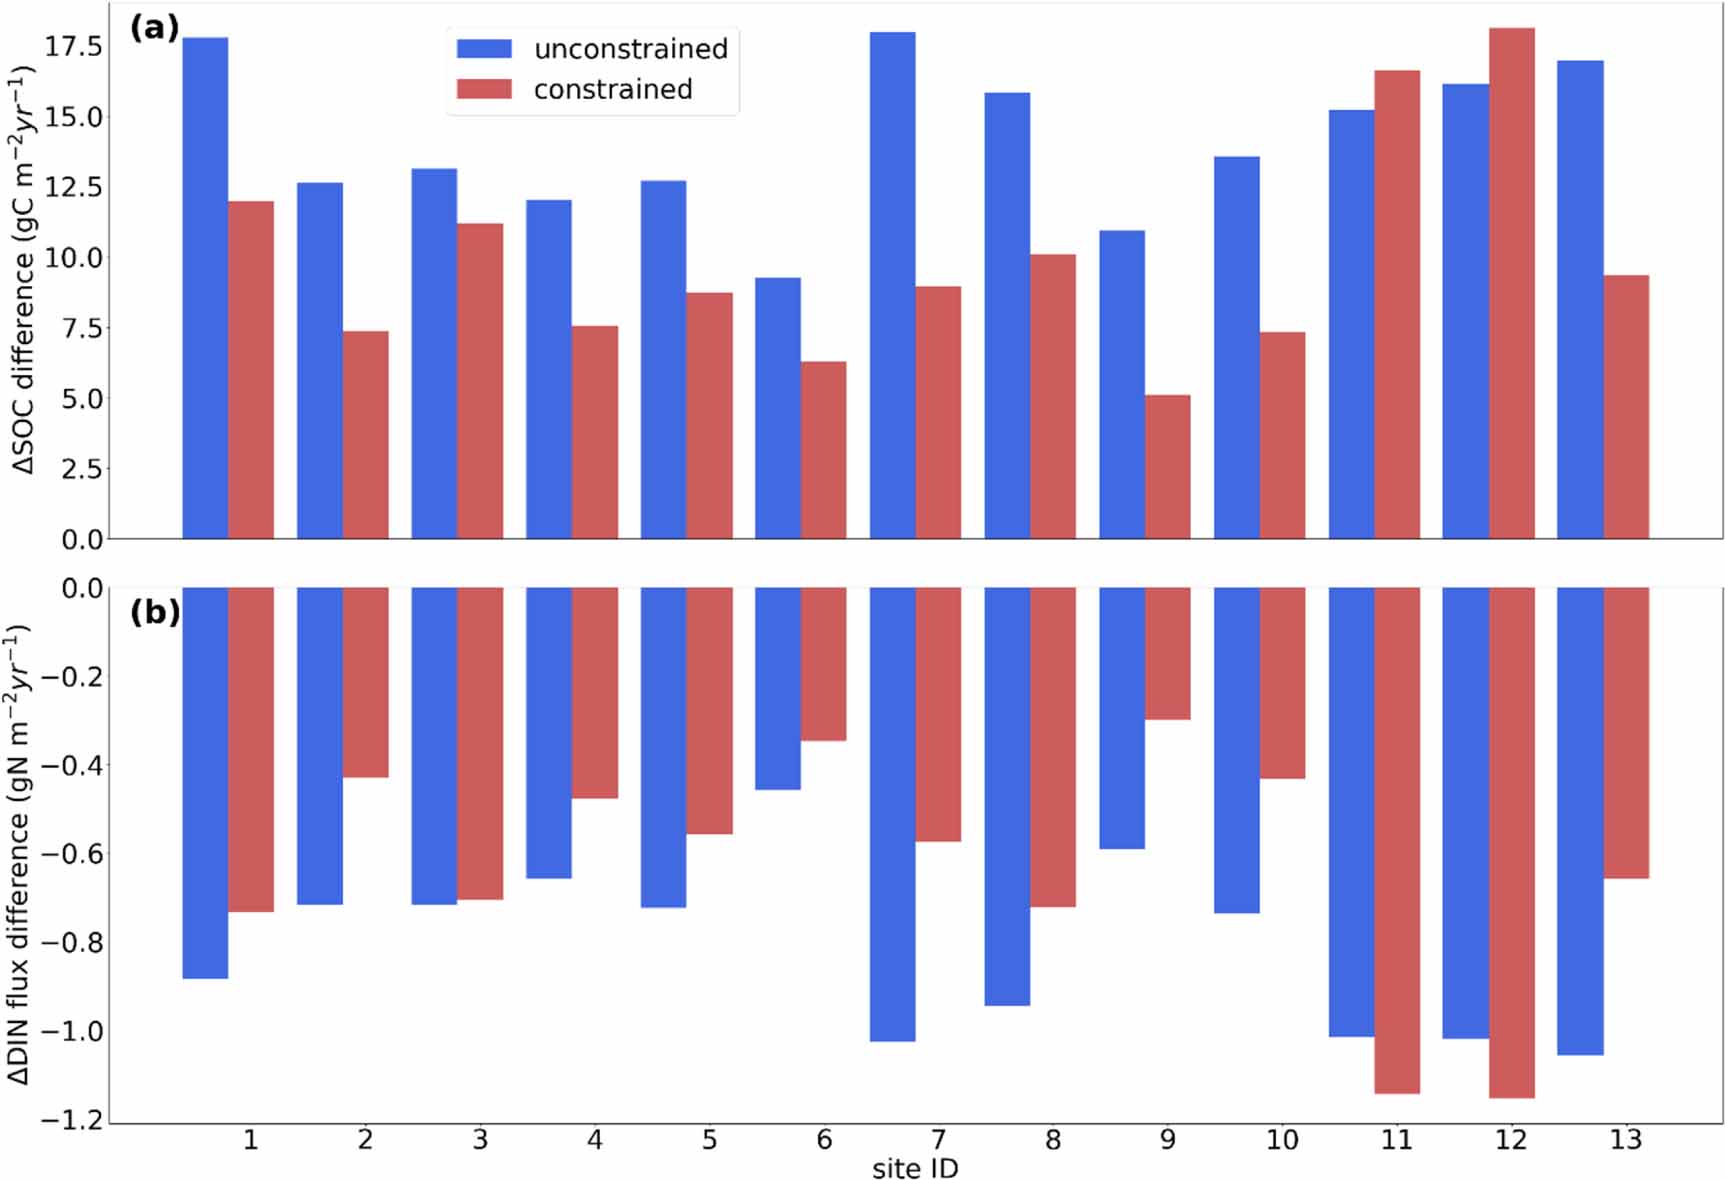
After quantifying changes in simulated cover crop aboveground biomass, we further studied the difference between unconstrained and constrained simulations of SOC accrual and N retention net benefits. Overall, the changes in simulated SOC accrual and N retention net benefits are consistent with that in simulated cover crop biomass C and N, which further indicates the importance of performing MDF. Within the 10-year analysis period, the differences between unconstrained and constrained simulations of SOC accrual net benefits range from −1.99 gC m−2 yr−1 to 9.04 gC m−2 yr−1 on all sites (figure 5(a)). The averages of simulated SOC accrual net benefits without and with satellite-based biomass constraints are 14.16 ± 2.60 gC m−2 yr−1 and 9.90 ± 3.68 gC m−2 yr−1, respectively, while the average of their differences is 4.27 ± 3.09 gC m−2yr−1 (31.0 ± 20.0%) on all sites. For N retention net benefits, the averages of unconstrained and constrained simulations are 0.81 ± 0.18 gN m−2 yr−1 and 0.63 ± 0.26 gN m−2 yr−1, respectively. Their differences vary from −0.13 gN m−2 yr−1 to 0.45 gN m−2 yr−1 (figure 5(b)). On all sites, the constrained simulations of net benefits in N retention are 0.18 ± 0.17 gN m−2 yr−1 (23.3 ± 19.7%) lower than the unconstrained simulations on average.
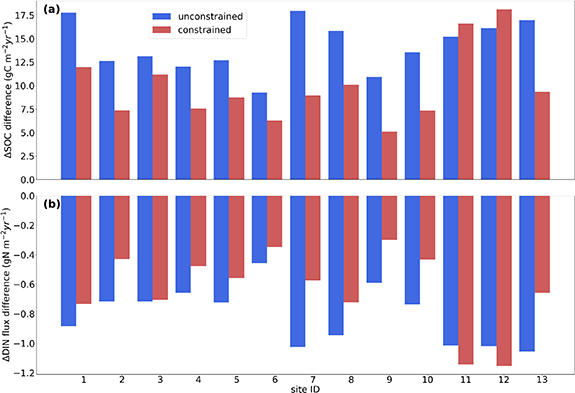
Figure 5. Comparisons between the 10-year average of unconstrained and constrained simulations of SOC accrual and N retention net benefits during the result analysis period. (a) ΔSOC difference (b) ΔDIN flux difference.
Download figure:
Standard image High-resolution imageFinally, the correlations between cover crop termination aboveground biomass and the net ecosystem benefits are investigated (figure 6). On a 10-year average, the simulated cover crop termination aboveground biomass C accounts for 98% of the variation in simulated SOC accrual net benefits, with 1 gC m−2 increase in aboveground biomass C leading to 0.21 gC m−2 yr−1 increase in SOC accrual net benefits. Meanwhile, the simulated cover crop termination aboveground biomass N accounts for 93% of the variation in simulated N retention net benefits, with 1 gN m−2 increase in aboveground biomass N leading to 0.42 gN m−2 yr−1 increase in N retention net benefits.

Figure 6. Correlations between the 10-year average of (a) simulated cover crop termination aboveground biomass C and ΔSOC difference (b) simulated cover crop termination aboveground biomass N and ΔDIN flux difference across all sites during the result analysis period.
Download figure:
Standard image High-resolution image
4. Discussion
In this study, we developed an MDF framework to effectively reduce the uncertainties in ecosys simulations of cover crop growth and ecosystem services by incorporating satellite-based cover crop aboveground biomass constraints. The necessity of performing MDF is illustrated as follows. Firstly, cover crop growth is the result of G (genotype) × E (environment) × M (management) (Peng et al 2020). Therefore, subtle environmental conditions (e.g., microclimate, ponding, topography) or management information that are unrepresented or underrepresented by model inputs, parameterization and structure may lead to biased simulations compared with ground truth on one site. Furthermore, two spatially-close sites (e.g., site 3 and site 4) can also show a large difference in termination cover crop biomass (figure S4) due to the uncaptured environmental and management differences. Therefore, these situations justify that cover crop planting parameters should be adjusted from site to site with the MDF framework. Meanwhile, more detailed environmental and management information (e.g. drainage condition, actual planting density, seed mass, etc) is required to further improve the performance of the MDF framework.
Utilizing time series data of satellite-based cover crop aboveground biomass as model constraints largely improves the applicability and scalability of the MDF framework on quantifying cover crop ecosystem services. Remote sensing can provide spatially large-scale observations of the target variable with high temporal resolutions due to its ubiquitous nature, while cover crop aboveground biomass can now be reliably estimated by remote sensing technology. On the one hand, remotely-sensed biomass time series enables the model to better capture both the termination biomass and the growing trend of cover crops, largely reducing the risk of calibrating wrong plant phenology parameters. On the other hand, given the strong constraint cover crop aboveground biomass has on SOC stock change, which is mainly due to its contributions to important SOC sources (Kutsch et al 2009, Araujo et al 2012, Balakrishna et al 2017, Jian et al 2020) and has been validated in previous studies on the field scale (Qin et al 2023), theoretically we expect that improved cover crop biomass quantification with remote sensing-based observations should lead to improved quantification of SOC change on the regional scale.
Given the relatively high performance of the current MDF framework, there are still spaces for improvement in the following aspects. First, the quality of the remotely-sensed cover crop aboveground biomass estimation can be further improved through (1) incorporating more field measurements for the RTM-based surrogate model training, and (2) performing cross-scale sensing (i.e. incorporating airborne hyperspectral imagery-derived cover crop aboveground biomass to improve scaling from field to satellite pixel levels) (Wang et al 2023a). Second, biomass data from other sources or data of other crop traits, environmental stresses and management information can be further incorporated as model constraints or input. For example, in addition to cover crop aboveground biomass, cover crop leaf traits (e.g. N contents) and cover crop adoption information can also be derived through cross-scale sensing (Wang et al 2023b) to further constrain N cycle relevant pathways and reduce information collection efforts (Thieme et al 2020, Wang et al 2021). Meanwhile, SOC stock and N leaching on the study sites can be further measured to validate the simulated ecosystem benefits. Last, the application of more advanced MDF approaches (e.g. AI-based solutions and graphics processing unit (GPU) computing) can effectively improve computational efficiency and extend the application scale of the MDF framework to a broader region (Guan et al 2023).
Apart from demonstrating the power of the MDF framework, our results also provide some practical implications for managing cover crops. The constrained cover crop planting densities range from 85 m−2 to 243 m−2 with an average of 139 ± 49 m−2 on all sites, showing a 63% decrease compared with the recommended default value of 370 m−2. Compared with the possibility that the actual planting density is lower than the default value on all 13 sites, this more likely indicates that the actual cover crop germination rates are lower than expected. Therefore, performing necessary management on cover crops can be of great importance to ensure their growth and ecosystem services. Possible measures include choosing appropriate cover crop varieties and high-quality seeds (i.e. high germination rate, low weed seed content), planting with drills to ensure proper seeding depth as well as introducing follow-up management practices (e.g., fertilization), and process-based models like ecosys can be used to select optimal management practices for cover crops.
5. Conclusions
In this study, we proposed an MDF framework that combines satellite-based cover crop aboveground biomass with the process-based agroecosystem model ecosys to better quantify the ecosystem services of cover crops. Adding the biomass constraints significantly reduced the uncertainties in simulated cover crop aboveground biomass, leading to a 17.90 ± 14.17 gC m−2 (29.0 ± 20.0%) decrease in simulated aboveground biomass C and a 0.62 ± 0.38 gN m−2 (35.0 ± 19.0%) decrease in biomass N on average at cover crop termination. The constraints are further passed on to the simulations of SOC accrual and N retention, resulting in a 4.27 ± 3.09 gC m−2 yr−1 (31.0 ± 20.0%) decrease in simulated SOC accrual net benefits and a 0.18 ± 0.17 gN m−2 yr−1 (23.3 ± 19.7%) decrease in simulated N retention net benefits. Our results reveal the necessity of constraining the process-based model with appropriate environmental variables, and the proposed remote sensing-based MDF framework provides an effective approach to quantify the environmental benefits of cover crops on a large scale. Meanwhile, we also emphasize the importance of properly managing cover crops to fully realize the potential of their ecosystem services.
Acknowledgments
Authors acknowledge the support from the Illinois Nutrient Research & Education Council (NREC 090273), NSF CAREER Award (NSF CBET 18-47334 CAR), USDA NIFA Program (AG 2018-68002-27961), and Foundation for Food and Agriculture Research (FFAR CA20-SS-0000000137).
Data availability statement
The data cannot be made publicly available upon publication due to legal restrictions preventing unrestricted public distribution. The data that support the findings of this study are available upon reasonable request from the authors.
Supplementary data (0.7 MB PDF)