

Abstract
Recent studies suggest that tropical Indian Ocean sea surface temperature (SST) anomalies, especially those associated with the Indian Ocean Dipole (IOD), may trigger Atlantic Niño through atmospheric teleconnection. However, it remains unclear whether the former has an impact on the prediction skill of the latter. This work applies hindcasts from 21 operational seasonal forecast systems based on dynamical climate models to verify the impact of the IOD in boreal autumn on the predictive skill of the Atlantic Niño in the following winter. The results indicate that the prediction skills of both the IOD and Atlantic Niño show pronounced seasonality, with a peak in the target season of boreal autumn for the former and in the following winter for the latter. The models with a stronger connection between the boreal autumn IOD and the following winter Atlantic Niño appear to have a higher skill in predicting the latter when compared to the weaker connection models. This leads to a significant in-phase relationship between the prediction skills of the boreal winter Atlantic Niño and the strength of the IOD–Atlantic Niño connection among the models. When compared to the weaker connection models, the stronger connection models tend to simulate a warmer climatological mean of SST in the tropical Indian Ocean during boreal autumn and winter. The warmer climatological mean of SST benefits a stronger atmospheric circulation response to the underlying SST forcing associated with the IOD. This suggests that mean state bias in the tropical Indian Ocean plays a role in modulating the strength of the simulated IOD–Atlantic Niño connection and thus prediction skill of the Atlantic Niño in boreal winter.
Export citation and abstract BibTeX RIS

Original content from this work may be used under the terms of the Creative Commons Attribution 4.0 license. Any further distribution of this work must maintain attribution to the author(s) and the title of the work, journal citation and DOI.
1. Introduction
Existing studies have suggested that interannual sea surface temperature (SST) variability in the equatorial Atlantic, dominated by the Atlantic Niño (also referred to as the Atlantic zonal mode or Atlantic equatorial mode; Zebiak 1993), have prominent effect on local and global climates (Xie and Carton 2004). For example, the Atlantic Niño tends to be accompanied by more rainfall anomalies over the African Sahel (Giannini et al 2003) and Northeast Brazil (Folland et al 2001), and could help to induce a Pacific La Niña event 6 months later through modulating the Walker circulation (Rodríguez-Fonseca et al 2009, Wang et al 2010, Ding et al 2012, Kucharski et al 2015, Polo et al 2015, Cai et al 2019). Additionally, the Atlantic Niño can modulate interannual variations in the Indian summer monsoon (Kucharski et al 2009, Pottapinjara et al 2016) and the Northwest Pacific–East Asian climate (Liu et al 2020, Ren et al 2021). Understanding the source of predictability for the Atlantic Niño is thus of great importance for the accurate prediction of seasonal-to-interannual climate variability in the surrounding countries and beyond.
The Atlantic Niños typically peak in boreal summer when the equatorial cold tongue is seasonally strengthened and are primarily maintained by the Bjerknes positive feedback (Lübbecke and McPhaden 2012, Lübbecke 2013, Richter et al 2013, Lübbecke et al 2018, Cabos et al 2019). The thermodynamic feedback may also play a role in maintaining the Atlantic Niño (Nnamchi et al 2015, 2021). Due to the relatively short-lived ocean–atmosphere coupling processes in the equatorial Atlantic (Nnamchi et al 2015, 2021), the seasonal predictability of the Atlantic Niño is usually limited (Stockdale et al 2006, Wang et al 2021). Only half of the seasonal forecast models from the North American Multi-Model Ensemble (NMME) project can provide a skillful prediction of the Atlantic Niño as long as 3 months in advance during 1980–2010 (Wang et al 2021).
In addition, there are also some Atlantic Niño events peaking in late boreal autumn and winter, which are referred to as the late-onset variety relative to the early-onset type that peaks in boreal summer (Okumura and Xie 2006, Vallès‐Casanova et al 2020). Zhang and Han (2021) revealed that the Indian Ocean Dipole (IOD) can trigger the Atlantic Niño, especially the late-onset type, via atmospheric teleconnection, with a lead of the former over the latter by ∼3–5 months. Similar results are found by Liao and Wang (2021), who focused on the impact of boreal winter SST anomalies in the Western Indian Ocean (WIO), the domain of which is almost consistent with that of the western lobe of the IOD, on the following summer Atlantic Niño. These results imply that the IOD may provide a source of predictability for the Atlantic Niño. However, whether the IOD has an impact on the predictive skill of the Atlantic Niño remains unclear.
By examining hindcasts from 21 operational seasonal forecast systems based on dynamical climate models, we identify a significant in-phase relationship between the prediction skills of the boreal winter Atlantic Niño and the strength of the IOD–Atlantic Niño connection among the models in this study. This finding supports the impact of the boreal autumn IOD on the predictive skill of the following winter Atlantic Niño. Moreover, we observe that mean state bias in the tropical Indian Ocean plays a role in modulating the strength of the simulated IOD–Atlantic Niño connection, and thus the prediction skill of the Atlantic Niño in boreal winter. The rest of this paper is organized as follows. Section 2 describes the data and methods. Section 3 presents the prediction skill of the Atlantic Niño and its relationship with the IOD, followed by a summary and discussion in section 4.
2. Data and methods
The present study utilizes hindcasts and real-time forecasts from 21 operational seasonal forecast systems provided by the NMME project (Kirtman et al 2014), the EUROSIP multi-model forecasting system over Europe (Mishra et al 2019), and the China Multi-Model Ensemble projects (CMME; Ren et al 2019). All model outputs were regridded to a horizontal resolution of 1° × 1°, with a forecast range of at least 6 calendar months for all models. The models have various ensemble sizes, ranging from 4 members to 40 (supplementary table S1). More details about the individual seasonal forecast systems can be found in their reference papers, listed in table S1.
For verification, this study uses SST from the Met Office Hadley Centre Sea Ice and Sea Surface Temperature (HadISST) dataset (Rayner et al 2003), with a horizontal resolution of 1° × 1° and available from 1870 to the present. Zonal and meridional components of 850 hPa wind and precipitation were obtained from the ERA5 reanalysis dataset on a 1° × 1° grid and available from 1979 to the present (Hersbach et al 2020). The monthly Atlantic multi-decadal oscillation (AMO) index is obtained from National Ocean and Atmospheric Administration (Enfield et al 2001).
The prediction skills are evaluated using the temporal correlation coefficient (TCC) and the root mean square error (RMSE). A multi-model ensemble (MME) is constructed as the equal-weighted average of models' ensemble means. If more than one versions is available from the same forecast system, only the forecasts from the latest version are used to construct the MME. In this work, 16 forecast systems contribute to the MME, including BCC_CSM1.1m, CanCM4i, CFSv2, CMCC-SPS35, COLA-RSMAS-CCSM4, ECMWF5, FGOALS-f2, FIO-ESM, GCFS21, GEM5-NEMO, GFDL-SPEAER, GloSea6, JMA-CPS3, MF7, NASA-GEOS5, and NUIST_CPS1.0.
Following previous studies (Zebiak 1993), the ATL3 index, a proxy to depict variation in the Atlantic Niño, is defined as the averaged SST anomalies over (3° S–3° N, 20° W–0°). The Dipole Mode Index (DMI), a proxy of the IOD, is defined as differences in SST anomalies averaged over the western (50° E–70° E, 10° S–10° N) and eastern (90° E–110° E, 10° S–0°) tropical Indian Ocean according to Saji et al (1999). The IOD is represented as the first leading EOF mode for the autumn-mean SST anomalies in the tropical Indian Ocean (15° S–30° N, 25° E–120° E) in both the observations and simulations, and the simulated pattern for all the individual models is generally well similar to the observed one (supplementary figure S1).
Analysis is performed for the period of 1994–2016 when forecasts and observations are all available. The statistical significance of correlation coefficients and regression coefficients, as well as differences in the climatological mean between two groups of models, is determined by a two-tailed Student's t test, while the differences between two regression coefficients are assessed by a Chow test (Chow 1960). Monthly anomalies are calculated relative to the climatology of the entire period, and linear trends were removed prior to the analysis. The seasons refer to those in the Northern Hemisphere. SON, OND, NDJ and DJF denote the average of September–October–November, October–November–December, November–December–January and December–January–February, respectively.
3. Results
3.1. Prediction skills of the Atlantic Niño and IOD
Figure 1 depicts the TCC skills of the ATL3 and DMI indices as a function of lead times for all months combined in the individual models and MME. It is shown that the prediction skills of the ATL3 index decay slightly faster than those of the DMI index in both the individual models and MME when the lead time increases (figures 1(a) and (b)). When 0.5 is chosen as the cut-off value for the TCC skill, following the previous study (Stockdale et al 2006, Wang et al 2021), less than half of the models can predict the ATL3 index skillfully 2 months in advance, while most of the models can predict the DMI index skillfully at 2 month lead. The result regarding the DMI index is consistent with that of Liu et al (2017). For a cut-off value of 0.6, only the MME and ECMWF5 have a predictive skill for ATL3 as long as 2 months. For both indices, the MME shows higher TCC skills than almost all the individual models (figures 1(a) and (b)). Especially for lead times ranging from 2 to 4 months, the MME can predict the ATL3 index much better than the individual models, which may imply that there is still much room for improvement in predicting the ATL3.
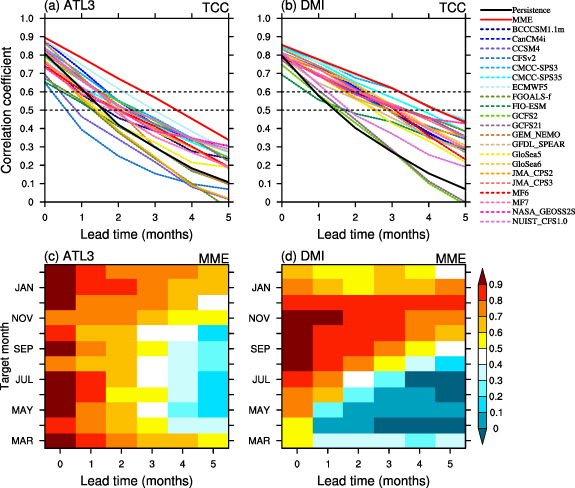
Figure 1. TCC skill of the (a) ATL3 and (b) DMI indices as a function of lead times for all months combined for the individual models (dashed line) and the MME average (red solid line). Black solid lines denote the persistence forecast. (c)–(d) As in (a)–(b), but for the TCC skill as a function of the target calendar month (y axis) and lead month (x axis) for the MME average.
Download figure:
Standard image High-resolution imageThe seasonal dependence of the TCC skills in the ATL3 and DMI indices is further examined. In general, the TCC skills of the ATL3 index are lower for target months in summer and higher in winter (figure 1(c)). For the MME average, the effective forecast (TCC ⩾ 0.6) of the ATL3 index can reach 5 months in winter but is limited to only 2 months in summer. Although the TCC skills of the DMI index are relatively low for target months in spring and summer, the skills become higher for target months in autumn and are even higher than 0.7 at 5 month lead in late autumn (figure 1(d)). Moreover, a comparison of figures 1(a) and (b) indicates that the individual models generally perform better in predicting the DMI index than the ATL3 index, though the MME has a similar performance when all months are combined. The higher TCC skills of DMI in autumn remind us of that the IOD peaking in autumn may provide a source of predictability for the Atlantic Niño peaking in the following winter.
3.2. Impact of the IOD on the prediction skills of Atlantic Niño
To examine the impact of the IOD on the prediction skills of Atlantic Niño in winter, figures 2(a)–(d) show the inter-model relationship between the TCC skill of the ATL3 index in DJF and the strength of the IOD–Atlantic Niño connection with a lead of the IOD over the Atlantic Niño in DJF by 0–3 months. Note that the strength of the IOD–Atlantic Niño connection is represented as the correlation coefficient between the ATL3 and DMI indices, where the ATL3 index is fit on the target season of DJF, and the DMI index varies with the lead time. It is indicated that the TCC skill of the ATL3 in DJF has a significant and in-phase relationship with the strength of the IOD–Atlantic Niño connection among the models when the IOD leads the Atlantic Niño in DJF by 1–3 months. Moreover, the majority of the models capture a positive correlation between the DJF ATL3 and the previous autumn DMI index, as seen in the observations, suggesting that these models can reasonably reproduce the observed IOD–Atlantic Niño connection. Considering the difference in the prediction skills of the eastern and western lobes of the IOD (Luo et al 2005), the impacts of the IODW and IODE on the TCC skills of the ATL3 in DJF are further examined, and similar results are obtained, except that the IODW-related inter-model relationship is slightly stronger than that for the IODE (figures 2(e)–(l)). Therefore, these results confirm that the IOD that peaks in autumn provides an important source of seasonal predictability for the Atlantic Niño in the following winter.
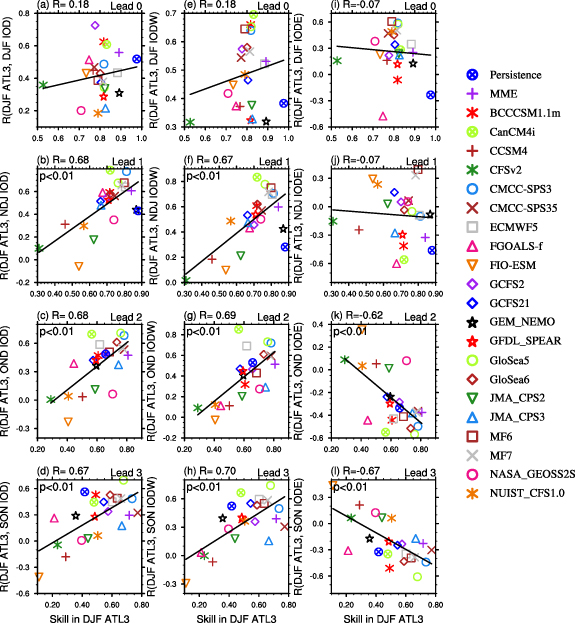
Figure 2. Inter-model relationship between the TCC skill of the ATL3 index in DJF and the strength of the IOD–Atlantic Niño connection with a lead of the IOD over the Atlantic Niño by (a) 0 month, (b) 1 month, (c) 2 months and (d) 3 months. (e)–(h) and (i)–(l) As in (a)–(d) but for the IODW and IODE indices, respectively. Blue cross denotes persistence skill in the observation.
Download figure:
Standard image High-resolution imageTo further verify the impact of the IOD–Atlantic Niño connection on the prediction skills of DJF ATL3, we compare the prediction skills of the ATL3 index in six models that have the strongest IOD–Atlantic Niño connection (i.e. CMCC-SPS3, GloSea5, CanCM4i, MF6, ECMWF5 and GloSea6, referred to as the strong-connection models hereafter) with those in six models that have the weakest IOD–Atlantic Niño connection (i.e. CFSv2, FIO-ESM, JMA_CPS2, CCSM4, NUIST_CFS1.0, and GEM_NEMO, referred to as the weak-connection models hereafter). Note that the strong- and weak-connection models are chosen according to the correlation coefficient between the ATL3 index in DJF and the DMI index in the previous November. For the strong-connection models, the correlation coefficients between the DJF ATL3 and November DMI indices are all significant at the 95% confidence level (p< 0.05), while for the weak-connection models, the correlation coefficients are below significance at the 90% confidence level (p> 0.1). The correlation coefficients between the ATL3 in DJF and DMI indices in October and September are also verified, and similar results are obtained.
Figure 3 displays the TCC and RMSE skills of the DJF ATL3 index as a function of lead times for the MME of the strong- and weak-connection models, respectively. It is evident that the TCC skills of DJF ATL3 for the MME average of the weak-connection models are lower and decay faster than those for the MME average of the strong-connection models, with a skill value of less than 0.50 for the former but higher than 0.70 for the latter at 3 month lead (figure 3(a)). Consistently, the RMSE of DJF ATL3 for the MME average of the strong-connection models is smaller than that for the MME average of the weak-connection models (figure 3(b)). Moreover, models with a stronger IOD–Atlantic Niño connection generally have higher prediction skills for the winter ATL3 index than those with a weaker IOD–Atlantic Niño connection. These results support the significant impact of the IOD in autumn on the seasonal predictability of Atlantic Niño in the following winter.
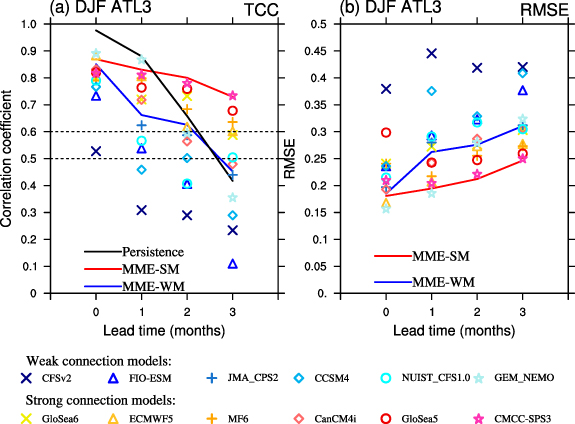
Figure 3. Comparison of the (a) TCC and (b) RMSE skills of the DJF ATL3 index as a function of lead times for the MME between the stronger (red solid line) and weaker (blue solid line) IOD–Atlantic Niño connection models. Black solid lines denote the persistence forecast. Marks with warm (cool) colors denote the individual models with stronger (weaker) IOD–Atlantic Niño connection.
Download figure:
Standard image High-resolution imageIn both the observations and MME of the strong-connection models, two of the three typical positive IOD events (1994, 1997, and 2006) during 1994–2016 are corresponding to an Atlantic Niño event in the following winter (supplementary figure S2), supporting the significant impact of the IOD on the late-onset Atlantic Niño event. For the three typical negative IOD events (1996, 2010, and 2016), however, only the one in 1996 is followed by an Atlantic Niña event, while the other two correspond to neutral SST anomalies in the eastern equatorial Atlantic in the following winter. Such an asymmetry in the response of the Atlantic Niño/ Niña to the IOD may be attributed to the asymmetry in the amplitude of the IOD. The positive IOD events tend to have a larger amplitude and therefore stronger climate impact than the negative IOD events (supplementary figure S2, Cai et al 2013, Qiu et al 2014, Behera and Ratnam 2018).
We also examined the inter-model relationship between the strength of the IOD–Atlantic Niño connection and the prediction skill of the ATL3 index in other seasons, but no significant relationship was found (figure not shown). Liao and Wang (2021) suggested that the western lobe of the IOD in DJF can trigger an Atlantic Niño event that peaks in the following summer, indicating that the former leads the latter by approximately two seasons. However, the time range for hindcast and forecast is only 6 calendar months for most of the operational seasonal forecast systems used in this study, which may be too short to detect the impact of the WIO SST anomalies on the prediction skill of the Atlantic Niño that peaks in summer.
3.3. Model performance in simulating the IOD–Atlantic Niño connection
To investigate the model performance in simulating relationship between the winter Atlantic Niño and the previous autumn IOD, regression analysis is applied to the SST and 850 hPa wind anomalies from SON to DJF and the DMI index in SON for the observations and the MME averages of the strong- and weak-connection models, respectively. Note that all the hindcasts used here are initialized from September, and CCSM4 and NUIST_CFS1.0 are excluded in the analysis due to the lack of wind data. As suggested by Zhang and Han (2021), the positive rainfall anomalies over the western lobe of the IOD in autumn can trigger an anomalous lower-level cyclonic circulation over the southern tropical Atlantic in the following months, accompanied by westerly wind anomalies in the equatorial eastern Atlantic and northern wind anomalies over western Africa (supplementary figures S3(a)–(d)). Consequently, warm SST anomalies appear along the coast of Angola 1 month after the peak of IOD in SON and then extend to the eastern equatorial Atlantic and peaks in DJF. It is found that the MME average of the strong-connection models can reasonably capture the IOD-related lower-level cyclonic circulation anomalies over the southern tropical Atlantic and thus the warm SST anomalies in the eastern equatorial Atlantic in NDJ and DJF, although the amplitude of the anomalies is weaker than the observed one (supplementary figures S3(g) and (h)). In contrast, the MME average of the weak-connection models fails to reproduce the lower-level circulation and SST anomalies in the southern tropical Atlantic, though the spatial pattern of the circulation and SST anomalies in the tropical Indian ocean resembles that in the observation as well as in the MME average of the strong-connection models (supplementary figure S3).
To better understand the factors that affect model performance in simulating the IOD–Atlantic Niño connection, figure 4 displays the differences in the SST and 850 hPa wind anomalies from SON to DJF regressed onto the DMI index in SON between the strong- and weak-connection models. Compared to those in the weak-connection models, significant warm SST anomalies appear in the equatorial Atlantic in the MME average of the strong-connection models (figures 4(a)–(d)), which are associated with the lower-level cyclonic circulation anomalies over the southern tropical Atlantic developing in OND (figures 4(c) and (d)). These wind anomalies are likely originated from the stronger positive response of precipitation to the SST warming in the western lobe of the IOD in the strong-connection models when compared to the weak-connection models (figures 4(f)–(h); supplementary figures S4(f)–(h) and (j)–(l)). The westerly wind anomalies in the equatorial Atlantic associated with the lower-level cyclones induce eastward oceanic currents and ultimately lead to warm SST anomalies in the eastern Atlantic basin through the Bjerknes positive feedback (Zhang and Han 2021). These results suggest that the stronger precipitation response to the SST forcing in the western lobe of the IOD contributes to a stronger IOD–Atlantic Niño connection in the models.

Figure 4. Differences in the SST (shadings) and 850 hPa wind (vectors) anomalies in (a) SON, (b) OND, (c) NDJ and (d) DJF regressed onto the DMI index in SON between the stronger and weaker IOD–Atlantic Niño connection models initialed from September. (e)–(h) As in (a)–(d), but for the precipitation anomalies. Only the areas (vectors) with significance at the 95% confidence level are shaded (blacked).
Download figure:
Standard image High-resolution image3.4. Effect of mean state bias on the IOD–Atlantic Niño connection
A question arises as to why some seasonal forecast models show a stronger precipitation response to the SST anomalies in the western lobe of the IOD and thus a stronger IOD–Atlantic Niño connection than the other models. It can be expected that the mean state bias in the tropical Indian Ocean SST may play a role, as a higher background SST generally benefits more active deep convection over the tropics (Gadgil et al 1984, Graham et al 1987, Waliser and Graham 1993).
As shown in figure 5, when compared to those in the weak-connection models, the MME average of the strong-connection models shows a higher climatological mean of SST in the western Indian Ocean in autumn (figure 5(a)), accompanied by heavier climatological mean of precipitation there (figure 5(c)). Similar results are observed in winter (figures 5(b) and (d)), except that the significant differences in the climatological mean of SST and precipitation mainly occur over the southern tropical Indian Ocean. Comparison of figures 5 and 4 indicates that the stronger precipitation response to the IOD-related SST anomalies is consistent with the warmer mean SST in the western Indian Ocean in the strong-connection models when compared to those in the weak-connection models. Additionally, when compared to the climatological mean of SST in observations, the MME average of the strong-connection models shows a warmer SST bias in the western tropical Indian Ocean both in autumn and winter (supplementary figure S5), which is consistent with the stronger IOD–Atlantic Niño connection in those models than in the observations (figure 2(b)). In contrast, the MME average of the weak-connection models suffers a colder SST bias over the tropical Indian Ocean in winter (supplementary figure S5(d)).
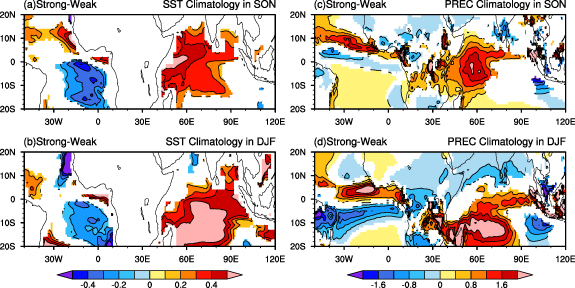
Figure 5. Differences in the climatological mean of SST (°C) in (a) SON and (b) DJF between the stronger and weaker IOD–Atlantic Niño connection models initialized from September. (c), (d) As in (a), (b), but for the precipitation (mm day−1). Only the areas with significance at the 95% confidence level are shaded.
Download figure:
Standard image High-resolution image
In short, the warmer climatological mean SST in the western tropical Indian Ocean benefits a stronger precipitation response to the underlying SST forcing in the strong-connection models. The stronger precipitation response to the western lobe of the IOD then triggers a stronger Gill-type Rossby wave response over the tropical southern Atlantic, which ultimately enhances the westerly wind anomalies over the equatorial Atlantic and thus warm SST anomalies in the eastern Atlantic basin. This is consistent with the result regarding the mechanism responsible for the linkage between the IOD and Atlantic Niño, as proposed by Zhang and Han (2021). Inter-model relationship of the mean SST and precipitation biases in the tropical Indian Ocean with the TCC skill of the DJF ATL3 index as well as the SON DMI–DJF ALT3 correlation is examined (supplementary figure S6), and the results support our conclusion regarding the effect of tropical Indian Ocean mean state bias on the IOD–Atlantic Niño connection and thus prediction skill of the Atlantic Niño in boreal winter. Previous studies have demonstrated that the warmer SST bias in the tropical Indian Ocean in autumn can be traced back to errors in the South Asian summer monsoon and can interact with the equatorial easterly bias over Indian Ocean through the Bjerknes feedback (Li et al 2015, Lu et al 2018b, Long et al 2020), but this is beyond the scope of the present study.
4. Summary and discussion
By examining hindcasts from 21 operational seasonal forecast systems based on dynamical climate models, this study highlights the significant impact of the IOD in boreal autumn on the prediction skill of the Atlantic Niño in the following winter. We showed that the prediction skills of both the IOD and Atlantic Niño exhibit pronounced seasonality, with a peak in the target season of boreal autumn for the former and in the following winter for the latter. The individual dynamic models, as well as the MME average, generally perform better at predicting the IOD than the Atlantic Niño when all months are combined. The dynamic models with a stronger connection between the boreal autumn IOD and the following winter Atlantic Niño appear to have a higher skill at predicting the latter than the weaker connection models. This leads to a significant in-phase relationship between the prediction skills of the boreal winter Atlantic Niño and the strength of the IOD–Atlantic Niño connection among the models. Therefore, these results verified the significant impact of the IOD in boreal autumn on the predictive skill of the Atlantic Niño in the following winter, supporting the conclusion of Zhang and Han (2021).
Moreover, we found that the stronger IOD–Atlantic Niño connection in the dynamic models can be attributed to the stronger precipitation response to the SST anomalies in the western lobe of the IOD in boreal autumn and winter. Consistent with the results of Zhang and Han (2021), the stronger precipitation response leads to an anomalous lower-level cyclone over the southern tropical Atlantic, and thus westerly wind anomalies over the equatorial Atlantic, ultimately leads to warm SST anomalies in the eastern Atlantic basin through the Bjerknes positive feedback. Further analysis suggested that the stronger precipitation response is related to the warmer climatological mean of SST in the tropical Indian Ocean, which benefits a stronger atmospheric circulation response to the underlying SST forcing associated with the IOD in boreal autumn and winter.
In addition to the mean state bias in the tropical Indian Ocean SST, other factors may also impact the model's performance in simulating the IOD–Atlantic Niño connection and thus the Atlantic Niño. For instance, previous studies have demonstrated that mean state thermocline slope and depth have an effect on the simulated amplitude of the IOD (Cai and Cowan 2013, Liu et al 2014, Lu et al 2018a). Okumura and Xie (2006) revealed that a shallower thermocline benefits a stronger SST response to surface wind changes in the equatorial Atlantic in later autumn, implying that mean state biases in the tropical Atlantic may also have an effect on the IOD–Atlantic Niño connection. However, these issues, as well as the possible causes for the mean state bias in the tropical Indian Ocean SST, still require further examination in future works.
This work has verified the significant impact of the IOD on the predictive skill of the Atlantic Niño in boreal winter, implying that improving model's performance in simulating the IOD and its connection with the Atlantic Niño may help to improve the prediction skills of latter. In particular, the IOD can be skillfully predicted 7 months in advance through deep learning approach (Liu et al 2021), suggesting room for improvement in the prediction of Atlantic Niño. It should be noted that a typical Atlantic Niño event matures in boreal summer, while the late-onset Atlantic Niño focused on in the present study peaks in boreal winter. We found that the IOD contributes significantly to the seasonal prediction skill of the late-onset Atlantic Niño event but not the canonical one. This is consistent with the previous studies that the two types of Atlantic Niño events show distinguished spatiotemporal features (Okumura and Xie 2006, Vallès-Casanova et al 2020).
Previous studies have revealed that interannual variability of the tropical Atlantic SST anomalies and their climate impacts could be modulated by the AMO (e.g. Chen et al 2015, Park and Li 2019). We found that the relationship between the IOD in boreal autumn and the Atlantic Niño in the following winter is non-stationary in both the observations and simulations (supplementary figure S7). However, possible causes of instability in the IOD–Atlantic Niño connection, particularly the role of the AMO, are topics that require further investigation in future studies.
Acknowledgments
This work is jointly supported by the National Key Research and Development Program of China (2021YFA0718000), the National Natural Science Foundations of China (41975102, U2142211) and the Joint Research Project for Meteorological Capacity Improvement (22NLTSZ002). The authors are grateful to the two anonymous reviewers for their insightful comments, which helped us improve the quality of this paper.
Data availability statement
The HadISST data set is available at https://www.metoffice.gov.uk/hadobs/hadisst/data/download.html. The ERA5 reanalysis dataset and the EUROSIP multi-model forecasting system datasets are available at https://cds.climate.copernicus.eu/cdsapp#!/search?type=dataset. The monthly AMO index for 1950–2016 is available from https://psl.noaa.gov/data/timeseries/AMO/. The NMME model datasets can be obtained from http://iridl.ldeo.columbia.edu/SOURCES/.Models/.NMME/. The CMME model datasets are available from the corresponding author on reasonable request.
Supplementary data (10 MB PDF)