

Abstract
Boreal forest ecosystems are predicted to experience more frequent summer droughts due to climate change, posing a threat to future forest health and carbon sequestration. Forestry is a regionally dominant land use where the managed secondary forests are typically even-aged forests with low structural and tree species diversity. It is not well known if managed secondary forests and unmanaged primary forests respond to drought differently in part because the location of primary, unmanaged, forests has remained largely unknown. Here we employed a unique map detailing over 300 primary forests in Sweden. We studied impacts of the 2018 nationwide drought by extracting and analyzing a high-resolution remote sensing vegetation index over the primary forests and over buffer zones around the primary forests representing secondary forests. We controlled for topographical variations linked to soil moisture, which was a strong determinant of drought responses, and analyzed Landsat-derived EVI2 anomalies during the drought year from a multiyear non-drought baseline. We found that primary forests were less affected by the drought compared to secondary forests. Our results indicate that forestry may exacerbate the impact of drought in a future climate with more frequent and extreme hydroclimatic events.
Export citation and abstract BibTeX RIS

Original content from this work may be used under the terms of the Creative Commons Attribution 4.0 license. Any further distribution of this work must maintain attribution to the author(s) and the title of the work, journal citation and DOI.
1. Introduction
Boreal forest ecosystems are predicted to experience hotter summers due to climate change, leading to more frequent and severe droughts (Seidl et al 2017). The 2018 European drought may be an early showcase of what is to be expected in the future (Hari et al 2020). The economic consequences for Sweden were severe, as the country grappled with forest fires, temperature extremes, and crop failures, and the situation was declared a national crisis (Swedish Ministry of Enterprise and Innovation 2019). While longer-term impacts on forests are still unknown, ecosystem monitoring stations across northern Europe observed favorable growth conditions during spring, followed by strongly reduced carbon uptake during summer, suggesting locally severe stress responses that were driven by a combination of local soil moisture (SM) and atmospheric vapor pressure deficits (Fu et al 2020, Smith et al 2020).
Forestry is the dominant land use type in Sweden, currently covering about 60% of the country's total area, and wood products constitute a major export revenue (Lindahl et al 2017). The legacy of forest management is a landscape largely dominated by even-aged forest stands of Scots pine (Pinus sylvestris) and Norway spruce (Picea abies), which are planted or seeded following a clear-cut, typically succeeded by several rounds of thinning and cleaning, and eventually clear-cut again after 60–120 years (Vestin 2017). Furthermore, selection of fast-growing, damage-resistant phenotypes and fertilization are common practices, as well as drainage of wetlands (KSLA 2015, Paul et al 2021), with the latter potentially exacerbating local SM and atmospheric vapor pressure deficits during periods of drought.
At the same time, it has been stated that Sweden officially harbors the largest area of remaining primary forests in Europe (Sabatini et al 2018), although no official comprehensive map of the location of these forests exists. Primary forests can be used as an analogue to which managed forests can be compared: they remain in a relatively pristine and undrained condition, are naturally regenerated, and display an uneven age structure, as well as a larger presence of dead wood (FAO 2015). How these characteristics influence drought resistance is currently not well understood. Recent research has shown that temperate and boreal forests with a higher diversity in hydraulic traits exhibit a buffering effect on latent heat flux variations, thus suggesting stronger drought resistance in more diverse forests (Anderegg et al 2018). Mixed stands have also been shown to display facilitative interaction effects, such as by hydraulic uplift of deeper rooting species (Pretzsch et al 2013). Repeated fertilization of managed stands can cause substantial loss of lichen and bryophyte cover (Hedwall et al 2010), while the presence of bryophytes and deadwood potentially increases water retention capacity (Pypker et al 2006, Oishi 2018, Klamerus-Iwan et al 2020). Drought resistance is closely linked to tree size and age, and taller trees, as found in primary forests, are considered more susceptible to drought-induced tree-mortality (Bennett et al 2015). On the other hand, uneven-aged forests can favor the relative growth of smaller trees, with the latter benefitting from the shading and the reduced water consumption of the taller trees during drought, thus stabilizing overall stand growth (Pretzsch et al 2018). In short, whether characteristics typically found in primary forests jointly favor drought resistance in comparison to managed forests constitutes a major research gap that is critical for informing future forest management decisions.
To compare drought responses in primary and managed forests, we used a new, detailed map of 348 Swedish primary forests (Ahlström et al 2020) and located surrounding secondary forests using spatial buffers. Together they form spatially proximate pairs experiencing comparable environmental conditions, landscape history and atmospheric drought impacts. We analyzed July–September median two-band enhanced vegetation index (EVI2) values based on Landsat data at a 30 m spatial resolution (Jiang et al 2008), and calculated 2018 EVI2 z-scores, which express anomalies of drought-year greenness as standard deviations from the long-term (2008–2017) mean. EVI2 is linearly related to gross primary production (Huang et al 2019) and has been employed in previous drought impact studies (e.g. Reinermann et al 2019).
Primary forests are generally found on steeper slopes and drier terrain less favorable for wood production than surrounding secondary forests (Ahlström et al 2020), and a recent study in the Pacific Northwest found drought sensitivity to be dependent on landscape topography (Cartwright et al 2020). We therefore control for topographical variations by dividing the dataset into five topographical SM classes, and then calculate separate per-forest z-score means for each SM class.
2. Materials and methods
2.1. Description of primary forest map and forest pairing
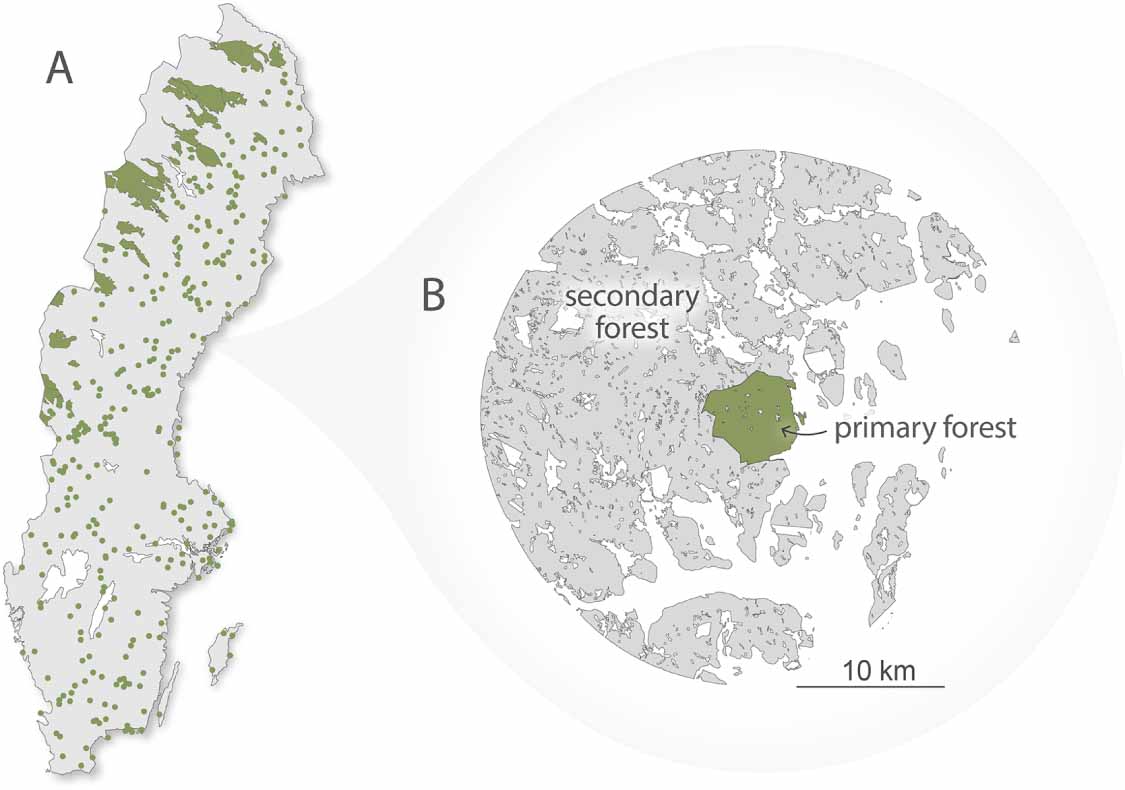
Primary forest locations were retrieved from an unpublished map containing the boundaries of 391 Swedish primary forests; the map itself represents a digitized and updated version of a nationwide forest inventory conducted in the late 1970s (Ahlström et al 2020). The forests have since been ranked by their level of naturalness following the framework introduced by Buchwald (2005), based on additional information mainly regarding estimated past human disturbances. For this study, we only considered forests equivalent to level five or higher (i.e. intact forests untouched for at least 60 years). We analyzed a total of 348 forests, which are scattered across Sweden, with the largest continuous stretches in the northwest of the country (figure 1(A)). We then established 15 km buffer zones around all primary forests representing forests dominated by planted and seeded managed secondary forests (figure 1(B)). While the precise species composition of the forest pairs analyzed here remains unquantified, both primary and secondary forests are dominated by the tree species Norway spruce (Picea abies) and Scots pine (Pinus sylvestris), but there is likely overall a larger share of broadleaved trees in the primary forests.
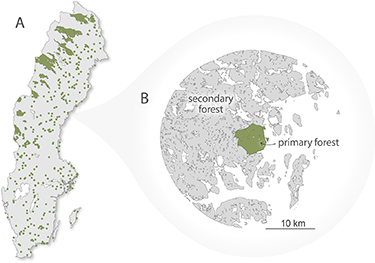
Figure 1. (A) Map of primary forests included in the analysis. Forests are shown as green polygons (large forests) and points (smaller forests). (B) Illustration of the spatially proximate pairs. The figure illustrates a primary forest (green) and managed forest (grey) pair.
Download figure:
Standard image High-resolution imageWe compared the primary and secondary forests (buffer zones) in pairs to minimize environmental and drought condition differences between the primary and secondary forests. The buffer distance size of 15 km were chosen as a balance between including enough secondary forests as not to introduce unnecessary uncertainty due to sampling errors, while not extending too far from the primary forest edges where environmental characteristics and meteorological conditions during 2018 could diverge from the conditions of the primary forests. The sensitivity of varying the buffer size between 5 and 50 km has been tested and found to be overall low in a previous study that shares some of the experimental design of this study (Ahlström et al 2020).
A set of maps was used to exclude areas in primary forests and in the buffer zones to minimize environmental differences and better differentiate managed forests from natural forests. Firstly, only productive forests (forests producing more than 1 m3sk per hectare and year) according to the 2018 Swedish land cover map were included in both primary forests and in the buffers (Naturvårdsverket 2019a, 2019b). Secondly, the same Swedish land cover map was used to exclude the classes 'temporary not forest' that mainly represent areas that recently experienced clear-cuts, but may also include limited areas that experienced recent natural disturbances, these inclusions and exclusions were made in both primary forests and in the buffers (Naturvårdsverket 2019b). Third, in buffers only, all forests under some protection status were excluded from buffer zones. In addition, known cuts were excluded from primary forests, and water bodies and areas affected by the 2018 wildfires were excluded from both forest types, see table S1 for further details.
Recent research suggests that around 8% of unprotected productive forests are older forests that pre-date the large-scale use of clear-cutting (Ahlström et al 2022). These forests have likely never been clear-cut but may have been subject to selective logging. These 8% do not include younger forests that have not been clear-cut but instead regenerated following natural disturbances which constitute a likely smaller but unknown fraction of forest in the buffers. These that have likely not been clear-cut but are likely not primary forests have not been mapped and have therefore not been excluded from the buffer zones and are included in the analysis of secondary forests. In summary, this implies that clear-cut, planted or seeded forests, dominates the forest area in the buffer zones referred to as secondary forest, with a likely smaller but unknown fraction of forests that have not been clear-cut with varying histories of logging and other human impacts.
2.2. Quantifying drought responses
We calculated July-September median EVI2 values (i.e. 2.5x(NIR-RED)/(NIR+2.4xRED+1.0)) for the years 2008–2018 based on land surface reflectance of the Landsat archive Tier 1 Collection 2 in Google Earth Engine, including Landsat 5 from 2008–2012, Landsat 7 from 2008–2018, and Landsat 8 from 2013–2018. We focused on the months July–September, since this timeframe corresponds closely to the period of strongest GPP anomalies measured at several Swedish ecosystem monitoring stations during 2018; it is therefore likely representative of the period of strongest vegetation stress.
To improve the temporal continuity of the Landsat archive, we calibrated EVI2 values obtained from Landsat-5 TM and Landsat-8 OLI to match Landsat-7 ETM+ by applying transformation coefficients. Coefficients were computed following the correction method introduced by Roy et al (2016). All scenes were masked for clouds, cloud shadows, and snow cover based on the quality flags of the Landsat dataset. For each 30 m pixel, z-scores were extracted, which express how many standard deviations the 2018 EVI2 values are from the baseline mean (2008–2017). We also calculated absolute anomalies (2018—baseline mean) but found that using absolute anomalies instead of z-scores had no influence on the study's overall conclusion (figure S1).
To evaluate the effect of topography on drought response, we analyzed drought responses in five separate SM classes representing zones of increasing topographical wetness. For this we used a modeled SM index, which combines the depth-to-water and topographical wetness indices (Naturvårdsverket 2019c). We then extracted per-forest mean anomalies for each SM class. The methodology to quantify drought response is building upon previous work by Wolf (2020), and the choice of metric described in more detail therein.
2.3. Statistical analysis
To test whether primary forests are associated with lower drought impacts (higher z-scores) than their surrounding secondary forests, a one-tailed Wilcoxon signed-rank test (Wilcoxon 1945) was performed for each SM class separately. A nonparametric test was chosen, because the z-score differences of the forest pairs display a negatively skewed distribution, and only pairs in the wettest SM class were found normally distributed (Shapiro–Wilk test, significance level α = 0.05) (Shapiro and Wilk 1965). To test the effect of topography on overall drought impacts, we first performed a Kruskal–Wallis test (Kruskal and Wallis 1952) on the difference in drought impacts between the SM classes, followed by a pairwise Wilcoxon signed-rank test to evaluate whether overall drought impacts were smaller in consecutively wetter SM classes. Lastly, we also tested for the effect of topography on z-score anomaly differences between primary and secondary forests (using a Kruskal–Wallis test).
3. Results
3.1. Topography effects
We found that a forest's drought response is dependent on its topographic position in the landscape. Vegetation in drier positions such as slopes and hilltops showed lower 2018 EVI2 z-score anomalies (larger drought impact) compared to vegetation in valley bottoms which are generally moister. This finding is illustrated in detail in figure 2 for the primary forest Skuleskogen National Park. A similar pattern of increasing drought impact with topographic dryness was observed across all 348 primary and secondary forests when averaging over five SM classes in each primary and secondary forest (figure 3). The drought impact was significantly smaller in each consecutively wetter SM class (Kruskal–Wallis & pair-wise Wilcoxon signed-rank test, all p < 0.01). Primary forests showed smaller EVI2 anomalies (reductions) compared to secondary forests in all SM classes. Further, a larger share of primary forests showed positive EVI2 anomalies: 5.5% of all secondary and 19.7% of all primary forests showed positive anomalies in the driest class, and 30.9% and 43.0% in the wettest class, respectively.

Figure 2. 2018 EVI2 z-scores in Skuleskogen National Park mapped onto an elevation model to illustrate how local topography influences forest drought impacts.
Download figure:
Standard image High-resolution image
Figure 3. Drought response in different forest types and topographic soil moisture classes. Distribution of per-forest mean 2018 EVI2 z-scores of primary (dark green) and secondary (light green) forests for the five topographical soil moisture (SM) classes.
Download figure:
Standard image High-resolution image3.2. Difference in responses between paired primary and secondary forests to the 2018 drought
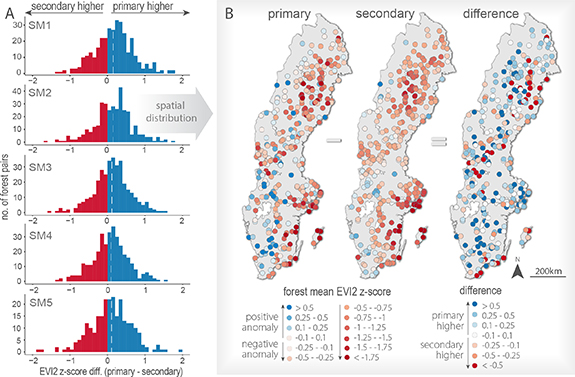
Because of the strong influence of topographical position, and a larger relative share of primary forest pixels in the drier SM classes (figure S2), we compared primary and secondary forest-pairs for each SM class separately. In each SM class primary forests were associated with significantly higher 2018 EVI2 z-scores (lower drought impacts) than their surrounding managed secondary forests (one-tailed Wilcoxon signed-rank tests, all p < 0.01) (figure 3). More specifically, overall mean z-score differences (primary—secondary) for the five SM classes were +0.154, +0.145, +0.119, +0.086, and +0.108, respectively. The mean difference was thus largest in the driest SM class and became smaller in wetter classes, although this trend was not statistically significant (Kruskal–Wallis, p = 0.11). Moreover, variability in z-scores was found to be higher for primary than secondary forests.
The most negatively impacted primary and secondary forests were located near the southeastern coastline, as well as more inland in northern Sweden (figure 4(B)). Several forests with positive anomalies were concentrated in southwestern Sweden, and the remainder were scattered across the country. In contrast, there was no clear spatial pattern concerning the distribution of z-score differences (primary—secondary) (figure 4(B)).
Figure 4. Countrywide differences between primary and secondary drought responses. (A) Frequency distribution of EVI2 z-score differences (primary—secondary). White dashed lines indicate the overall mean difference for each SM class. (B) Spatial distribution of z-scores for primary forests (left map), their surrounding secondary forests (middle), and relative difference of each forest pair (right). Maps display results for SM2, which is the most frequent soil moisture class.
Download figure:
Standard image High-resolution image
4. Discussion
In this study, we analyzed how forest management and topography affect drought responses by comparing anomalies of a high-resolution (30 m) satellite-derived vegetation index of greenness across more than 300 paired Swedish primary and managed secondary forests during the unprecedented 2018 nationwide drought. This constitutes a novel approach that provides a complementary and larger-scale perspective to in-situ comparisons of tree rings or measurements of local carbon uptake at eddy-covariance flux sites (e.g. Grossiord et al 2013, Anderegg et al 2018).
An uncertainty inherent in the use of satellite data is the ability of the chosen metric to accurately detect actual drought stress on the ground. Landsat data, due to the relatively low revisit frequency of 16 d per satellite, constitutes a relatively blunt tool to study a phenomenon that dynamically evolves over time, making data gaps due to clouds and the diminished scene quality associated with the Landsat 7 ETM+ scanline failure a potential issue. Furthermore, EVI2 essentially measures changes in greenness. It is possible that some forests showing no change, or even greening due to preceding spring conditions, still experienced elevated stress levels later in the season, leading to a reduction in photosynthesis but not detectable changes in EVI2. However, the pair-wise approach where spatially adjacent primary and managed forests are compared has the strength to ameliorate some of the uncertainties associated with satellite data, since impacts are expressed as relative differences of z-scores between primary and secondary forests, where the data over both forest types can be expected to have experienced similar noise inducing conditions (e.g. cloudiness).
The fact that the EVI2 z-scores successfully captured local differences in drought response associated with topography-dependent SM differences provides further confidence in the metric as an adequate proxy of drought impacts at large. In contrast, most past drought studies at the national- or European-scale are based on satellite data at a resolution of 250 m or coarser (e.g. Buras et al 2020). Studies using remotely sensed vegetation indices at coarser spatial resolution than used here, in topographically complex environments, may therefore fail to correctly identify drought impacts, because positive and negative responses in adjacent wet and dry locations may cancel to a weaker signal when averaged across a larger pixel.
We employed a spatially paired analysis to control for environmental factors and drought severity. This is a tractable method to ensure that differences between the forest types are minimized. More information on the actual forests could improve the analysis and potentially offer more information on why the forest types responded differently to the drought. However, primary forests have remained unmapped until recently and they are not well represented in the Swedish national forest inventory (Fridman et al 2014). We therefore argue that the method where spatially proximate forests are compared in pairs is a tractable and robust method. Our method assumes that productive unprotected forests that are not included in our primary forests map are secondary forests. It can however be expected that around 8% of the unmapped unprotected forests are old natural forests that have never been clear-cut (Ahlström et al 2022). These forests, together with an unknown fraction of young non clear-cut forests, have not been mapped, and therefore cannot be excluded from the analysis. While their small share of productive forest land implies that their inclusion in the secondary forest class in this study is expected to have limited impact on our results, mapping and exclusion of this forest type would improve the accuracy of similar future studies.
Our results suggest that primary forests showed smaller drought impacts than their adjacent secondary forests. There are multiple potential reasons for why this could be the case. Primary forests likely harbor both taller and older individual trees in general. However, previous literature discussing the role of tree size and age for drought stability is inconclusive. While several studies found taller trees to be more vulnerable to drought due to their inherently higher risk of experiencing hydraulic failure (e.g. Bennett et al 2015, Trugman et al 2018, Liu et al 2022), a recent paper investigating tree-ring based drought impacts from a large set of trees across five continents found that younger upper-canopy trees showed larger growth reductions during drought compared to older trees (Au et al 2022). This may reflect a more extensive rooting system of older trees providing access to deeper soil water, thus alleviating water stress in forest stands where deeper soil water is not depleted yet.
However, our study focused on the difference between primary and secondary forests, which involves differences in a larger and partly unknown set of ecosystem characteristics beyond tree age and size. These include but are not limited to characteristics that have been suggested to improve drought stability, including but not limited to, no drainage of wetlands which may increase ecosystem water storage (Paul et al 2021), larger structural and trait variability (e.g. Anderegg et al 2018), and unknown potential roles of diversity in tree species and biodiversity in general, but it remains difficult to disentangle the role of individual factors when there are very many potential reasons in a complex ecosystem with limited available data.
Overall, our study, and the data currently available, only allow for speculation on the key characteristics that induce the apparent difference in drought responses between the forest types. We hope that the results presented here will inspire targeted field data collection and studies on potential drivers of the observed differences in drought impacts between primary and secondary forests in Sweden.
5. Conclusion
We applied a novel and highly detailed map of primary forests in Sweden to offer first insights into drought responses in primary and secondary forests. We found that primary forests showed smaller negative canopy impacts in response to the 2018 drought. The results also show a clear dependency of drought impact severity on topographic wetness on a relatively fine spatial scale. During 2018, wetter parts of the forest landscapes showed small or even positive vegetation responses to the drought, likely linked to increased sunlight with sufficient water supply. Our results therefore suggest that, due to the large risk of cancelling out positive and negative responses, it may be critical to use data at higher spatial resolutions in topographically complex regions, such as Sweden or elsewhere, to successfully monitor drought responses in forests.
Acknowledgments
A A acknowledge funding from the Crafoord Foundation, Ebbe-Kocks Stiftelse, Längsmanska Kulturfonden, the Swedish research council (2021-05344) and Horizon Europe, Project ID 101059888, Climb-Forest. Views and opinions expressed are however those of the authors only and do not necessarily reflect those of the European Union or the Research Executive Agency. Neither the European Union nor the Research Executive Agency can be held responsible for them. F T acknowledges funding from the Nation Natural Science Foundation of China (Grant No. 42001299) and the Seed Fund Program for Sino-Foreign Joint Scientific Research Platform of Wuhan University (No. WHUZZJJ202205). K G was supported as a Lawrence Fellow by the LLNL-LDRD Program under Project No. 21-ERD-045, under the auspices of DOE Contract DE-AC52-07NA27344. The study is a contribution to the research environment Biodiversity and Ecosystem Services in a Changing Climate (BECC) at Lund University.
Data availability statement
The data that support the findings of this study are available upon reasonable request from the authors.
Supplementary data (0.1 MB PDF)