

Abstract
Legacy nitrogen (N) is recognized as a primary cause for the apparent failure of watershed N management strategies to achieve desired water quality goals. The ELEMeNT-N (exploration of long‐term nutrient trajectories for nitrogen) model, a parsimonious and process-based model, has the potential to effectively distinguish biogeochemical and hydrological legacy effects. However, ELEMeNT-N is limited in its ability to address long-term legacy N dynamics as it ignores temporal changes in soil organic N (SON) mineralization rates. This work represents the first use and modification of ELEMeNT-N to quantify legacy effects and capture spatial heterogeneity of legacy N accumulation in China. An exponential function based on mean annual temperature was employed to estimate yearly changes in SON mineralization rate. Based on a 31 year water quality record (1980–2010), the modified model achieved higher efficiency metrics for riverine N flux in the Yongan watershed in eastern China than the original model (Nash–Sutcliff coefficient: 0.87 vs. 0.72 and R2: 0.80 vs. 0.71). The modified ELEMeNT-N results suggested that the riverine N flux mainly originated from the legacy N pool (88.2%). The mean overall N lag time was 11.9 years (95% confidence intervals (CIs): 8.3–21.3), of which biogeochemical lag time was 9.7 years (6.3–18.4) and hydrological lag time was 2.2 years (2.0–3.0). Legacy N accumulation showed considerable spatial heterogeneity, with 219–239 kg N ha−1 accumulated in soil and 143–188 kg N ha−1 accumulated in groundwater. The ELEMeNT-N model was an effective tool for addressing legacy N dynamics, and the modified form proposed here enhanced its ability to capture SON mineralization dynamics, thereby providing managers with critical information to optimize watershed N pollution control strategies.
Export citation and abstract BibTeX RIS

Original content from this work may be used under the terms of the Creative Commons Attribution 4.0 license. Any further distribution of this work must maintain attribution to the author(s) and the title of the work, journal citation and DOI.
1. Introduction
Excess anthropogenic nitrogen (N) inputs have greatly altered the global N cycle and elevated N loadings to surface and ground waters, resulting in widespread eutrophication and water quality impairment (Galloway et al 2008, Gu et al 2015, Breitburg et al 2018). Despite intensive efforts to mitigate riverine N pollution worldwide, few attempts have achieved their expected goals. For instance, in spite of significant reductions in N inputs to the Mississippi watershed and several European rivers, riverine N levels in these regions remained high (Worrall et al 2009, Gren and Destouni 2012, van Puijenbroek et al 2014, Van Meter et al 2017, 2018, Basu et al 2022). Legacy N has been implicated as a primary reason for these failures to meet expected water quality objectives (Meals et al 2010, Chen et al 2014b, Van Meter et al 2018, McDowell et al 2021, Basu et al 2022).
Watershed models are the most effective method for determining the relationship between anthropogenic N inputs and riverine N fluxes. These modeling approaches include statistical models (e.g. the pollution load model, Spatially Referenced Regressions on Watershed Attributes (SPARROW), and PolFlow; Du et al 2014, Chen et al 2014b, Li et al 2015) and mechanistic models (e.g. Agricultural Non-point Source Pollution model (AGNPS), Hydrological Simulation Program Fortran (HSPF), Generalized Watershed Loading Function (GWLF), and Soil and Water Assessment Tool (SWAT); de Wit et al 2000, Moriasi et al 2007, Ilampooranan et al 2019). Nevertheless, current watershed models usually do not explicitly consider N legacy effects (Chen et al 2018, Basu et al 2022), which often limit their prediction accuracy. Several efforts have modified existing models and developed new models to explicitly quantify nutrient legacy effects. For example, based on net anthropogenic nitrogen inputs (NANI), Chen and coworkers constructed a series of models to determine N legacy effects, including statistical (Chen et al 2014b), mechanistic (Chen et al 2014a) and semi-mechanistic, semi-statistical models (Chen et al 2015). Furthermore, Ilampooranan et al (2019) coupled SWAT with a travel-time distribution model to capture hydrological lag times; whereas Guillaumot et al (2021) utilized a hillslope-scale aquifer model modified with a travel-time distribution model.
Currently, most watershed models do not explicitly consider potential residence times associated with watershed N cycling processes, hence they are unable to distinguish between the lag time components associated with biogeochemical and hydrological processes (Basu et al 2022). Additionally, the fixed and empirical model parameters prevent these watershed models from effectively capturing the spatial heterogeneity of legacy N accumulations (Van Meter et al 2017, Ilampooranan et al 2019, Chang et al 2021). While some existing watershed models (e.g. SWAT) can overcome many of these limitations, the interacting complexities of changes in climate and land use, as well as comprehensive data requirements, hinders their widespread application (Chen et al 2018).
To overcome these limitations, Van Meter et al (2017) developed a parsimonious, process-based model termed ELEMeNT-N (exploration of long‐term nutrient trajectories for nitrogen). ELEMeNT-N couples long-term watershed land-use trajectories and a source-zone N loss function utilizing a limited number of parameters and input data to project long-term trends in stream, soil and groundwater N (Van Meter et al 2017, 2018, Basu et al 2022). It explicitly considers N biogeochemical processes within various landscapes and the impacts of land-use change. Therefore, the model can effectively distinguish between biogeochemical and hydrological lag time, as well as capturing the spatial heterogeneity of legacy N storage at the watershed scale. ELEMeNT-N has been successfully applied in America and Europe, e.g. Chesapeake Bay (Chang et al 2021), Mississippi watershed (Van Meter et al 2018), Susquehanna watershed (Van Meter et al 2017), Grand watershed (Liu et al 2021a), Weser basin (Sarrazin et al 2022) and Mondego Basin (Marques et al 2022). However, ELEMeNT-N has not been previously applied to Chinese watersheds, which have considerably different climate and agricultural cropping practices.
For soil organic N (SON) dynamics, ELEMeNT-N assumes a fixed SON mineralization rate. Nevertheless, the SON mineralization rate, especially in active pools, often presents significant temporal variations due to changing temperature, soil moisture and land management (Francis et al 2007, Brookshire et al 2011, Moreau et al 2019, Shen et al 2022). For example, the N contribution from SON mineralization increased 4.1-fold during 1980–2019 in the Yongan watershed of eastern China due to increases in temperature and soil drainage systems (Wu et al 2022). Moreover, the N input from SON mineralization varied from 4–12 kg N ha−1 month−1 in two forest watersheds in North Carolina due to changes in temperature (Brookshire et al 2011). Therefore, it is warranted to consider the variation in annual SON mineralization rates to reduce uncertainties of model output, especially in long-term studies.
This study is the first attempt to address long-term (31 years), watershed-scale legacy N dynamics using ELEMeNT-N that considers annual changes in the SON mineralization rate in China. Based on a 31 year water quality record (1980–2010) in the Yongan watershed of eastern China, the main objectives of this study were to: (i) modify ELEMeNT-N with a dynamic SON mineralization rate; (ii) capture spatial heterogeneity of legacy N storage within the watershed; and (iii) distinguish biogeochemical and hydrological legacy effect components. The modified ELEMeNT-N model overcomes a potential limitation of the original ELEMeNT-N model without adding excessive model complexity or increasing data requirements. Model results provide important information to assess and improve N pollution control strategies for water quality management at the watershed scale.
2. Methods and materials
2.1. Study area
As a typical rainfall-dominated watershed, the Yongan watershed is located in the subtropical region of eastern China (120.23–121.01°E/28.47–29.04°N; elevation ∼15–1000 m; figure 1). Dominant land-use types are forest (∼68%) and agricultural (∼15%) lands. The Yongan River is the third largest river of Zhejiang province draining 2474 km2 and flowing into the East China Sea with an average discharge of 72.9 m3 s−1 at the downstream sampling site. Climate is subtropical monsoon with average annual precipitation and temperature of 1400 mm and 17.4 °C; rainfall mainly occurs in May–October. During 1980–2010, total population and poultry production (chicken and duck) increased ∼81% and 4.8-fold, respectively, whereas other domestic livestock production decreased by ∼25% (Chen et al 2015). Over the study period (1980–2010), paddy field (two crops per year) and dryland (tea, vegetables and fruits) area contributed 43%–70%, and 18%–48% of total agricultural area, respectively (Chen et al 2015). Since 2000, the watershed experienced a remarkable reduction (∼49%) in N fertilizer application (Hu et al 2018). Renovations to the old agricultural drainage system (stone/mud construction in 1950s) and construction of new drainage systems (cement channels/pipes) increased the area of drained agricultural land by ∼2-fold since 2000 (4800 ha in 2000 and 10 300 ha in 2010; Chen et al 2014a).
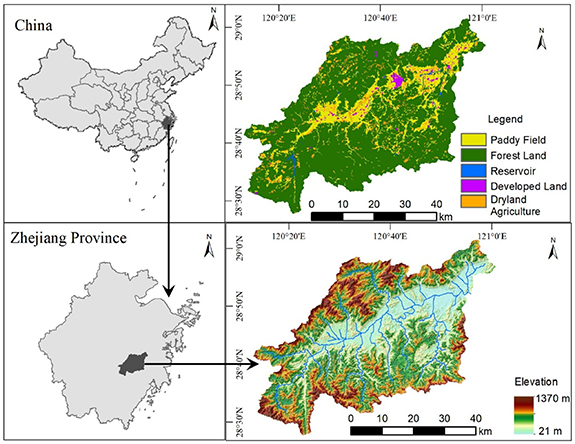
Figure 1. Location and land-use distribution of Yongan watershed. The subfigure at the top right shows land-use distribution in 2010.
Download figure:
Standard image High-resolution image2.2. Model description and modification
ELEMeNT-N utilizes a coupled framework that integrates source-zone dynamics depicting SON accumulation/depletion processes within the source zone, and a travel-time model that describes hydrological processes for groundwater (figure 2). The model conceptualizes the landscape as a bundle of stream-tubes, each with a unique travel time to the watershed outlet, thus establishing a watershed travel-time distribution function f(τ). The travel-time distribution function controls N load trajectories (Mout(t)) at the watershed outlet:
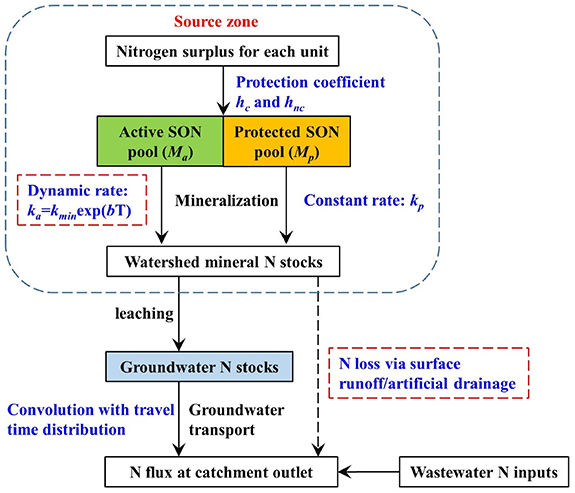
Figure 2. Modified ELEMeNT-N framework. Blue fonts represent key nitrogen conversion/transport processes. Red dashed box denotes modification to original ELEMeNT-N model. Dotted arrows represent N loss via surface runoff/artificial drainage, which is conceptualized as groundwater with shorter transport time in ELEMeNT-N.
Download figure:
Standard image High-resolution imagewhere Js,wshd is annual nitrate flux leaching from source zone to groundwater; f(τ) represents the travel-time distribution (f(τ) = 1/μ × e(−τ/μ); where τ is travel time and μ is mean travel time); γ is first-order rate constant describing N removal via denitrification along hydrologic pathways; and DMSTCsw(t) is wastewater-N discharge to stream. More details of ELEMeNT-N are described in supporting information (SI, Part A).
SON mineralization rate is mainly mediated by microbial reactions (Gruber and Galloway 2008), which are affected by various factors. Temperature usually plays the most important role in well-drained, humid ecosystems (Francis et al 2007, Brookshire et al 2011). Laboratory/field experiments demonstrate that temperature alters soil microbial metabolic processes and rates, thus significantly altering SON dynamics (Dai et al 2020). Moreover, temperature data are relatively easy to access for most watersheds. Therefore, we employed mean annual temperature (MAT) to describe variations of SON mineralization rate for the active N pool (figure 2) in the form of an exponential function (Rey and Jarvis 2006, Brookshire et al 2011):

where ka is mineralization rate of the active organic N pool,  is basal N mineralization rate at 0 °C, T is MAT, and b is the sensitivity of ka to temperature.
2.3. Data sources
Data inputs for ELEMeNT-N include annual riverine N flux, SON content, water discharge, land use and the components contributing to the N surplus. Annual riverine N fluxes were estimated by the Weighted Regressions on Time, Discharge, and Season (WRTDS) model based on the 31 year record of total N concentrations and water discharge at the Yongan watershed outlet as calculated using EGRET package in the R framework (Hirsch et al 2010, Wu et al 2022). The WRTDS model excludes the influence of random temporal variability in streamflow to evaluate trends in riverine N flux (Hirsch et al 2010). SON content in 1980 was estimated from a soil organic carbon assessment (Liang et al 2019) assuming a C/N ratio of 14. Inorganic N fertilizer, manure N application, biological N fixation and wastewater discharge were directly obtained from local yearbooks. Atmospheric N deposition was obtained from published reports (Liu et al 2013). Landsat images were interpreted to acquire annual land-use distributions that were subsequently used to construct watershed land-use trajectories (www.gscloud.cn/). Mean groundwater travel time was derived from previous results obtained using stable isotopes of oxygen and hydrogen (Hu et al 2020).
2.4. Model calibration and uncertainty analysis
The model was calibrated using the 31 year record of annual riverine total N fluxes. Nash–Sutcliff coefficient (NSE) and determination coefficient (R2) were used to evaluate goodness-of-fit. The Markov Chain Monte Carlo procedure with the Differential Evolution Adaptive Metropolis (DREAM-ZS) algorithm was used to calibrate parameters and determine uncertainties (SI, Part B). Then, we replaced the constant SON mineralization rate with the dynamic exponential function in the source code. A similar procedure was repeated to calibrate the newly introduced parameters (i.e. kmin and b). Global parameter sensitivity analysis was used to determine the parameters having the most significant influence on riverine N flux for the modified model. All model coding, sensitivity analysis and statistical analyses were conducted in MATLAB (Ver. 10.0, MathWorks, USA).
3. Results and discussion
3.1. Model performance
Model sensitivity analysis indicated that simulated riverine N fluxes were most sensitive to denitrification rates in human waste, soil and groundwater (λpop, λs and γ, table S1). Calibrated values for basal SON mineralization rate (kmin) and temperature sensitivity (b) were 0.04 (95% CIs: 0.01–0.39) and 0.55 (95% CIs: 0.02–1.30), respectively. Based on the calibrated parameters, the SON mineralization rate displayed considerable variations, ranging from 0.09 to 0.12 yr−1 (average = 0.10 yr−1, figure 3(e)). This indicates that using a fixed SON mineralization rate may impose a maximum 16.7% over/underestimate in a given year (i.e. (0.12–0.10)/0.12), highlighting the benefit of using a variable SON mineralization rate based on actual temperature variability.
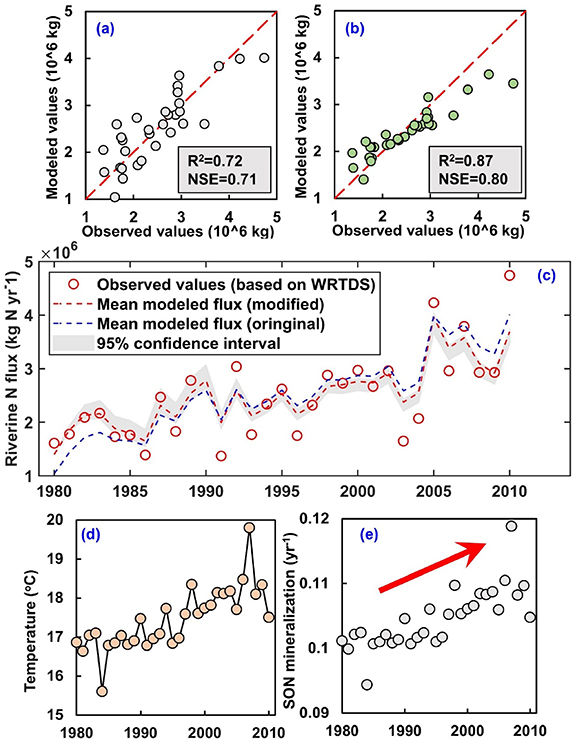
Figure 3. Scatter plot for riverine total nitrogen fluxes versus (a) the original ELEMeNT-N model, (b) modified ELEMeNT-N model, (c) line chart for observed N fluxes (based on WRTDS) and modified ELEMeNT-N modeled N fluxes, (d) variations of mean annual temperature, and (e) soil organic nitrogen mineralization rate during 1980‒2010 in the Yongan watershed. Shaded areas in subfigure (c) denote the 95% confidence intervals.
Download figure:
Standard image High-resolution imageCompared to previous applications of ELEMeNT-N, some of the calibrated parameters presented large differences. Specifically, we found a lower protection coefficient for cropland (hc: 0.14, 95% CIs: 0.01–0.27), lower soil denitrification rate (λs: 0.07, 95% CIs: 0.01–0.23), higher soil porosity (n: 0.64, 95% CIs: 0.54–0.70) and higher water content (s: 0.63, 95% CIs: 0.53–0.70; table 1). We attribute these differences primarily to the cropping frequency and types. In Europe and America, the cropping index is ∼105%, whereas it often exceeds 200% in this region (Liu et al 2021b). The higher cropping frequency leads to more frequent tillage resulting in greater soil disturbance, which hinders the formation of the protected SON pool and increases soil porosity (Morugan-Coronado et al 2020). Soil oxygen exchange with the atmosphere increases with higher soil porosity, thereby limiting soil denitrification, whereas higher soil water content can promote denitrification. In addition, denitrification is strongly influenced by soil organic matter (SOM) availability. The SOM content in this region is low, with ∼50% of cropland having SOM content below 20 g kg−1 (Liang et al 2019). Therefore, the combination of low SOM content and high soil porosity may have a strong effect on denitrification, limiting soil denitrification rate. Our previous stable isotope studies also demonstrated weak denitrification in this region (Hu et al 2019). No site-specific characteristics were observed for SON mineralization rate in the protected pool (kp: 2.4 × 10⁻⁴, 95% CIs: 2.0–4.4 × 10⁻⁴), protection coefficient for non-cultivated land (hnc: 0.40, 95% CIs: 0.28–0.52), denitrification rate in groundwater (γ: 0.16, 95% CIs: 0.02–0.40) and human waste (λpop: 0.83, 95% CIs: 0.59–0.99, table 1).
Table 1. The prior distribution and calibrated values of model parameter. Calibrated values represent the mean value and 95% confidence interval (in the bracket).
| Parameter | Description | Range | Reference | Calibrated value | |
|---|---|---|---|---|---|
| Min | Max | ||||
| kp | Soil mineralization rate, passive pool (yr−1) | 1 × 10⁻⁵ | 5 × 10⁻⁴ | Van Meter et al (2017) | 2.4 × 10⁻⁴ |
| (2.0–4.4 × 10⁻⁴) | |||||
| kmin | Basal soil mineralization rate, active pool (yr−1) | 0.01 | 0.50 | Rey and Jarvis (2006) | 0.04 |
| (0.01–0.39) | |||||
| b | Parameter related to the sensitivity | 0 | 2 | Rey and Jarvis (2006) | 0.55 |
| (0.02–1.30) | |||||
| n | Soil porosity | 0.33 | 0.70 | Van Meter et al (2017) | 0.64 |
| (0.54–0.70) | |||||
| s | Soil water content | 0.35 | 0.70 | Van Meter et al (2017) | 0.63 |
| (0.53–0.70) | |||||
| λs | Soil denitrification rate constant (yr−1) | 0.05 | 0.75 | Van Meter et al (2017) | 0.07 |
| (0.01–0.23) | |||||
| hc | Protection coefficient, cultivated land | 0.01 | 0.30 | Van Meter et al (2017) | 0.14 |
| (0.01–0.27) | |||||
| hnc | Protection coefficient, non-cultivated land | 0.28 | 0.52 | Van Meter et al (2017) | 0.40 |
| (0.28–0.52) | |||||
| μ | Mean travel time (years) | 2 | 8 | Hu et al 2020 | 2.26 |
| (2.01–2.97) | |||||
| γ | Denitrification rate constant, groundwater (yr−1) | 0.01 | 0.40 | Van Meter et al (2017) | 0.16 |
| (0.02–0.40) | |||||
| λpop | Denitrification rate constant, human waste (yr−1) | 0.56 | 1 | Van Meter et al (2017) | 0.83 |
| (0.59–0.99) | |||||
The modified ELEMeNT-N model incorporating temperature-dependent SON mineralization achieved a high accuracy, accounting for 87% (R2) of the variability in annual riverine N flux and a NSE of 0.80 (figure 3(b)). These metrics can be considered as 'very good' according to watershed model performance ratings (R2 >0.75 and NSE >0.75; Liew et al 2003, Moriasi et al 2007), and the efficiency metrics were comparable or superior to previous ELEMeNT-N applications (mean NSE: 0.76, ranges: 0.56–0.95). Compared to the original ELEMeNT-N (R2: 0.72 and NSE: 0.71, figure 3(a)), the most significant improvement occurred during the period when the riverine N flux irregularly changed (i.e. no regular increasing/decreasing trend during 1980–2002; figure 3(c)). These results verify the efficacy of the model modification and document the applicability of the modified ELEMeNT-N for use in the Yongan watershed. Despite the overall good performance metrics for the modified ELEMeNT-N, it should be noted that several simulation results deviated appreciably from the measured riverine N fluxes (figures 3(b) and (c)). These discrepancies likely result from the lack of data before 1980 that prevented determination of pre-1980 nitrogen accumulation in watershed soils (Yang et al 2020, Hu et al 2023).
3.2. Long-term legacy N dynamics
During the study period (1980–2010), a total of 1630.0 kg N ha−1 was applied to the Yongan watershed (SI, Part C, figure S1). The model results indicate that only 20.4% (12.4%–34.5%) of the cumulative N input was removed via riverine N export (figure 4). This fraction is consistent with 20%–25% determined by previous studies in this watershed (Chen et al 2014a, Hu et al 2018) and falls in the mid-range determined for several global watersheds (mean: 20%, range: 10%–40%; Han et al 2009, Howarth et al 2012, Swaney et al 2012). The majority of N input was removed via denitrification, accounting for 43.2% (range: 38.0%–64.4%; figure 4). This leave an estimated 36.4% (range: 13.2%–62.5%) of surplus N (593 kg N ha−1) retained within the watershed as legacy N pools in SON (26.2%; range: 12.0%–42.4%) and groundwater (10.2%; range: 1.2%–20.1%; figure 4). These results are supported by a 65% increase of N in the upper 20 cm layer of agricultural soils between 1980 and 2009 (Chen et al 2014b) and a 3.8-fold increase in groundwater N concentrations between 1980 and 2019 in the Yongan watershed (Wu et al 2022). When compared to a previous study within this watershed, the magnitude of legacy N accumulation was much higher than the ∼480 kg N ha−1 estimated by the ReNuMa model (Hu et al 2018). An important distinction is that the ReNuMa model assumed that a considerable proportion of N was retained in forest biomass (∼134 kg N ha−1; Hu et al 2018), whereas ELEMeNT-N does not explicitly distinguish N accumulation in forest biomass from that in SON/groundwater. Therefore, the legacy N accumulation calculated by the modified ELEMeNT-N is generally consistent with that of ReNuMa when considering legacy total N accumulations in soil, groundwater and forest biomass.
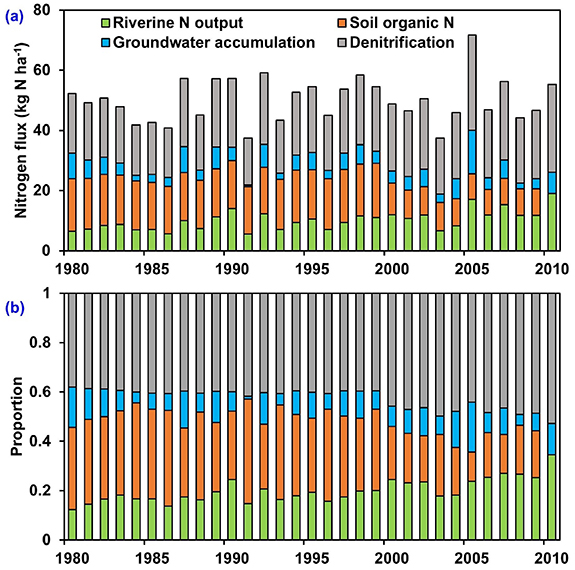
Figure 4. Source-sink dynamics for nitrogen export by river, denitrification and net storage (soil and groundwater) in Yongan watershed (1980–2010) estimated by modified ELEMeNT-N: (a) quantities and (b) proportions.
Download figure:
Standard image High-resolution imageModeled SON accumulation presented a ∼2.5-fold spatial variation (219–539 kg N ha−1), while a smaller variation was observed for groundwater (143–188 kg N ha−1; figures 5(a) and (b)). Specifically, SON accumulation in forest lands (average: 385 kg N ha−1) was significantly lower than that in other land uses (410 kg N ha−1). This can be attributed to the lower N inputs and higher denitrification rate in forest soils (Wang et al 2018). Monitored groundwater N concentrations and simulated groundwater N accumulation showed a strong positive correlation (figure 5(a), R2 = 0.99, p< 0.01). A recent study documented a considerable amount of nitrate accumulation in deeper soil horizons and vadose zone of subtropical red soils (Yang et al 2020). These results indicate that the deep soil/vadose zone can function as a transient N storage zone, absorbing N leaching from upper soil horizons and thereby retarding its transport to groundwater. We attribute the smaller spatial variations in groundwater N accumulation to this transient storage in the deeper soil/vadose zone.

Figure 5. Spatial distribution of (a) groundwater nitrogen accumulation, and (b) soil organic nitrogen accumulation in the Yongan watershed (1980–2010) estimated by modified ELEMeNT-N.
Download figure:
Standard image High-resolution imageAs expected, the spatial distribution of legacy N accumulation was closely related to the magnitude of surplus N (figure 6(c)). Specifically, the correlation between total legacy N and surplus N was strongest (figure 6(c), R2 = 0.65, p< 0.01), followed by SON (figure 6(c), R2 = 0.52, p< 0.01), and weakest for groundwater N (figure 6(c), R2 = 0.47, p< 0.05). The direct groundwater N source is soil N leaching rather than N inputs to the watershed (Gu et al 2013). Therefore, the accumulation of groundwater N is also regulated by SON mineralization rate and soil permeability/leaching dynamics (Wu et al 2016, Liu et al 2020).

Figure 6. Dynamics of legacy nitrogen accumulation (a), scatterplot for legacy nitrogen accumulation versus drained agricultural land area (b), and scatterplot for accumulated nitrogen surplus versus legacy nitrogen accumulation (c) in Yongan watershed (1980–2010). Legacy nitrogen was divided into three components for analysis: total legacy nitrogen, soil and groundwater.
Download figure:
Standard image High-resolution imageBoth SON and groundwater were important N sinks throughout the study period. The accumulation rate of legacy N storage displayed a continuous decreasing trend (figure 6(a)), with a rate of −0.32 kg N ha−1 yr−1. The trend for SON accumulation can be divided into two stages: a relatively constant (16.5 ± 0.6 kg N ha−1) stage during 1980–1999 versus a decreasing trend from 2000 to 2010 (from 10.5 to 8.3 kg N ha−1, figure 6(a)). We assign two primary reasons for these results. The primary reason is the increasing temperature in recent years (figure 3(d)), which leads to a higher SON mineralization rate. Meanwhile, the N inputs decreased during these periods (figure S1). As such, SON accumulation decreased from 2000 to 2010. Another reason may derive from an increase in the area of drained agricultural land. Correlation analysis indicated that drained agricultural land area was negatively related to both legacy N and SON accumulation (figure 6(b)). Increases in drained agricultural land result in faster routing of precipitation and irrigation water to streams, thereby reducing SON accumulation (Blann et al 2009, Basu et al 2011). Theoretically, enhanced drainage systems can also lead to faster transport of subsurface N to streams and reduced accumulation in groundwater (Blann et al 2009, Buzek et al 2009). However, no significant trend was observed in groundwater N accumulation over the study period, with a mean (±SD) accumulation rate of 5.0 ± 2.7 kg N yr−1. This may be ascribed to the accumulation of nitrate in the deeper soil/vadose zone (Yang et al 2020), which may provide an additional N supply to groundwater as soil moisture conditions change (Wu et al 2016).
3.3. Riverine N lag time
The ELEMeNT-N modeled lag time between watershed N inputs and riverine export in the Yongan watershed was 11.9 years (95% CIs: 8.3–21.3 years). This result was consistent with the decadal lag time determined by previous studies in this watershed (Chen et al 2014a, 2015, Hu et al 2018). The majority of anthropogenic N input to a watershed is transiently stored in as SON before subsequently being released to groundwater through mineralization and leaching (Spoelstra et al 2001, Sebilo et al 2013). In terms of ELEMeNT-N results, the residence time for SON was 9.7 years (95% CIs: 6.3–18.4) in the active pool versus 4281 years (95% CIs: 2276–35 981) in the protected pool. The simulated hydrologic lag time was 2.2 years (95% CIs: 2.0–3.0), which was lower than the mean groundwater transit time (4.5 years, 95% CIs: 4.0–5.5) determined by stable isotopes (Hu et al 2020). We posit two primary causes for this groundwater hydrology deviation. First, current estimation methods for groundwater transit time are subject to large uncertainties (Yang et al 2018, Rodriguez and Klaus 2019). Thus, the deviation may be introduced by differences in characterizing transit times between the two methods. Additionally, mean travel time of legacy N in the modified ELEMeNT-N includes the surface runoff component, which has a much lower travel time than groundwater.
ELEMeNT-N indicated that riverine N load at the watershed outlet was dominated by legacy N. Current year's N application (including point and non-point sources) contributed only 11.8% (range: 6.3%–20.2%) of the riverine N flux and legacy N contributed the remaining 88.2% (79.8%–93.7%). These results were consistent with those determined by a dual stable nitrate isotopes approach, in which the N source apportionment indicated that >80% of riverine N originated from legacy N pools (i.e. soil + groundwater; Hu et al 2019).
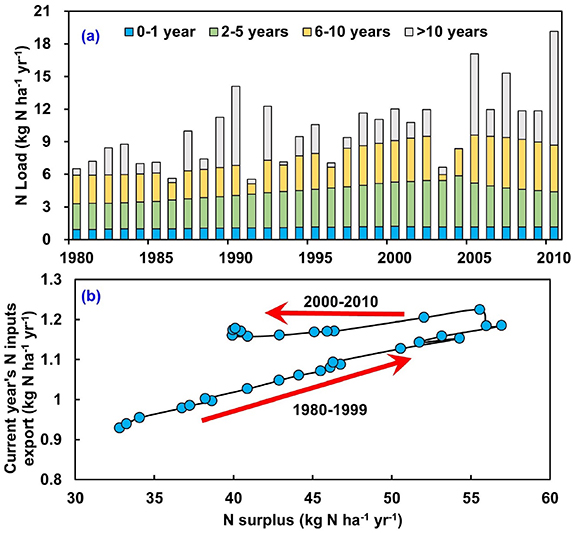
Due to N removal via denitrification, biomass uptake/storage and riverine output, the contribution of previous years' N applications decreased with increasing time. Anthropogenic N applied 2–5 years, 6–10 years and >10 years ago contributed 35.2% (range: 25.4%–83.7%), 30.6% (range: 8.1%–34.0%) and 22.3% (range: 0%–44.5%) of the total riverine N load (figure 7(a)). Notably, limited by the model structure and data availability, N aged >10 years consisted of two components: N inputs from more than 10 years ago and the natural background N pool. This result was similar to previous estimates (Chen et al 2014a, 2015), in which the contribution of the current year's net anthropogenic N inputs was ∼10%, whereas the legacy and natural background N contributed ∼75% and ∼15%, respectively.
Figure 7. Age distribution of nitrogen at watershed outlet (a) and scatterplot for annual nitrogen surplus versus riverine nitrogen export from current year's nitrogen input (b) in the Yongan watershed.
Download figure:
Standard image High-resolution image
Riverine export of current year's N applications exhibited contrasting trends for different time periods, namely a continuous increase during 1980–1999 followed by no significant trend during 2000–2010 (figure 7(a)). When compared to annual surplus N inputs (SI, Part C, figure S1), an obvious nonlinearity was observed (figure 7(b)). In subtropical watersheds, 10.7 kg N ha−1 yr−1 was suggested as a threshold value for N saturation (Howarth et al 2012, Swaney et al 2012). During the study period, observed N inputs far exceeded this threshold value, leading to a progressive N saturation. Therefore, the capacity of soil, vegetation and groundwater to transiently store N declines as N saturation progresses. The decrease in N inputs may be offset by this reduction in N storage efficiency, thereby resulting in a relatively stable riverine export of current year's N application (figure 7(b)). In addition, N aged 2–5 and 6–10 years began to decrease after their long-term continuous increase in the earlier portion of the study period. The transition occurred 4 and 7 years after the decrease in surplus N inputs (∼2000) (figure 7(a)). These results confirm those of previous studies that found reducing N inputs is essential for reducing the impact of legacy N on mitigating N pollution.
3.4. Implications for N pollution control and remediation
The modified ELEMeNT-N provides quantitative information for watershed N legacy effects (figures 4, 5 and 7(a)), which are critical considerations for managers designing science-based, N pollution control strategies and assessing their efficacy. For example, the spatial distribution of legacy N provided by ELEMeNT-N (figure 5) allows decision makers to prioritize nutrient management strategies to critical regions. The model predicted that it could take at least 15–21 years following a 50%–100% reduction of N surplus to meet the water quality goal for the Yongan River (1 mg N L−1) (figure S3). Therefore, it is necessary to set appropriate expectations for the public in meeting long-term pollution targets (Bouraoui and Grizzetti 2014). Due to the large legacy N contributions to riverine N flux, targeted strategies should be adopted to proactively prevent legacy N accumulation. Reducing N inputs (e.g. fertilizer, manure) is the most direct approach, as they are a direct source of the legacy N (figure 6(c)). Construction of agricultural drainage systems is a necessary and effective measure to limit legacy N accumulation as well. It can lead to shorter watershed travel time, thus effectively reducing legacy N accumulation, especially as SON (figure 6(b); Blann et al 2009, Sloan et al 2017). However, drainage systems may result in more immediate N pollution delivery to rivers. Therefore, additional strategies targeting drainage water treatment (e.g. buffer zones between drainage and rivers) are warranted to avoid short-term water quality impairments (Mander et al 2005, Hu et al 2019).
4. Conclusions
This was the first study to apply the ELEMeNT-N model to watershed conditions typical of eastern China. ELEMeNT-N was demonstrated to be an effective tool for addressing legacy N dynamics, and the modified version incorporating temperature-dependent SON mineralization rates improved riverine N flux predictions. Compared to the original ELEMeNT-N, the NSE and R2 increased 0.15 and 0.1, respectively, highlighting the importance of considering temperature-dependent variations in SON mineralization when modeling long-term riverine N fluxes. Based on model output, quantitative information is provided on (i) contributions from different N sources to riverine N flux (i.e. current year's N application vs. legacy N pools), (ii) the magnitude of different watershed N sinks (e.g. riverine N export, denitrification and legacy N accumulation), (iii) required time between initiation of water quality improvements and reductions in riverine N fluxes (i.e. lag time), (iv) N-age distribution at catchment outlet, and (v) spatial distribution of legacy N accumulation in the watershed. Quantitative information concerning specific biogeochemical/hydrological lag times and spatial distributions of legacy N accumulation provided by ELEMeNT-N aids watershed managers in designing/optimizing non-point source N pollution control strategies. This study confirms the applicability of the ELEMeNT-N model as an effective tool for addressing long-term legacy N dynamics in watersheds of eastern China.
Acknowledgments
We thank local government departments for providing relevant data for this investigation and Dr Randy A Dahlgren (University of California–Davis) for his review of the manuscript. This work was supported by the National Key Research and Development Program of China (2021YFD1700802) and National Natural Science Foundation of China (42107393/42177352).
Data availability statement
All data that support the findings of this study are included within the article (and any supplementary files).
Supplementary data (0.7 MB PDF)