

Abstract
Long-term records of animal behaviour are useful sources of data for generating new testable hypotheses, though often human and financial resources limit opportunities to acquire such datasets. Citizen science can potentially fill the gap by generating win:win outcomes for science and society. In the present study, non-scientist participants (i.e. school classes and citizen scientists) joined the long-term monitoring of three avian model species (greylag goose, Anser anser; common ravens, Corvus corax; northern bald ibis, Geronticus eremita) by collecting sightings of individually marked birds. Objectives of the study were to address accuracy (in terms of correct identification of bands/species for individual birds) of the observations compiled by the participants depending on the specific tool used for data collection; compare the results obtained with analogue vs digital tools about the spatial abundances of the greylag geese; investigate potential differences in data collection depending on the species' habits (ground-dwelling or not); and to merge both analogue and digital datasets to model spatial patterns of abundance for one of the monitored species, the greylag goose. Digital or analogue tools were used to collect data over three years. Training modules were offered before starting data collection. Data accuracy varied across focal species and tasks (range 12.5%–100% correct). Among the three monitored avian species, greylag geese (ground-dwelling) were observed the most compared to the common ravens and northern bald ibis (both aerial and/or arboreal). Furthermore, greylag geese showed differences in their abundance between locations as well as preferences for specific spatial hotspots within the study area. Spatial patterns did not differ between breeders and non-breeders. Our study underscores that participants of citizen science projects can contribute accurate behavioural data which could be used to develop a robust model of spatial patterns and abundance of the greylag goose. Involvement of non-scientist participants in research projects is expected to generate further benefits for science (management related decision) and society (enhanced knowledge and awareness of the process of scientific enquiry).
Export citation and abstract BibTeX RIS

Original content from this work may be used under the terms of the Creative Commons Attribution 4.0 license. Any further distribution of this work must maintain attribution to the author(s) and the title of the work, journal citation and DOI.
1. Introduction
The involvement of interested volunteers in the scientific process, such as the use of citizen science as a methodological approach, could contribute to closing the gap between research that involves long-term data and the time and financial constraints of science management (Kullenberg and Kasperowsky 2016). Long-term datasets are of high value for documenting biological changes in population size within and between species (Wolfe et al 1987, Lunney et al 2018, Wells et al 2019, Frigerio et al 2021), and for monitoring biodiversity loss (Magurran et al 2010, Beck et al 2020). Citizen scientists can provide valuable information; for instance, on avian ring wear and loss in colour-ringed Oystercatcher populations. Citizen science may therefore be essential to collect long-term data on avian behaviour at the individual level (Allen et al 2019). Collaborations between scientists and volunteers can result in large datasets, peer-reviewed publications and reports as well as increased scientific literacy and biodiversity awareness in society (Bonn et al 2016, Kullenberg and Kasperowski 2016).
The level and degree of engagement as well as the time span of the activities that volunteers are involved in may affect the quality and type of such outputs (Ceccaroni and Piera 2017, Frigerio et al 2018). In particular, volunteers who received training prior to data collection provided more accurate data (Aceves-Bueno et al 2017). But, data still need to be verified by trained experts to ensure proper interpretations, as was the case in coccinellid-focused citizen science projects where volunteers overestimated species richness (Gardiner et al 2012). Over the past years, involving schools among the collaborators and participants of citizen science projects has emerged as a promising field (Bonney et al 2009, Bela et al 2016), not least because there is empirical evidence that collaboration between education and research increases motivation for out-of-school learning (Miczajka et al 2015, Scheuch et al 2018) and improves the acquisition and retention of knowledge compared to classroom-based curriculum learning (Hirschenhauser et al 2019). In order to establish a win–win situation for all participants, it is important for scientists to inform the public about the different phases of the project in a targeted and understandable way (e.g. from data collection to dissemination; Richter et al 2019).
In recent years, biological research in general and citizen science approaches specifically have profited from the power of smartphone/digital applications (apps; e.g. Adriaens 2015, Jepson and Ladle 2015). Digital devices are used in a variety of citizen science studies on avian behaviour, for instance to record song dialects (Yellowhammer, Emberiza citronella; Diblíková et al 2019), to observe behavioural interactions between birds at bird feeders (Miller et al 2017), to record the effects of the COVID-19 lockdown on the behaviour of urban birds (Gordo et al 2021), or to evaluate low-risk collision areas for wind energy development (Ruiz-Gutierrez et al 2021). Digital applications raise public engagement, sometimes even by an order of magnitude (Pocock and Evans 2014). However, the age and experience of the volunteers may strongly affect the success of employing apps in citizen science projects, as senior volunteers may not be familiar with digital tools and children may not yet own an appropriate device (Burgess et al 2017, Frigerio et al 2018). Applying analogue tools (e.g. pen and paper) takes time and resources to transfer the data collected into digital form, suitable for analyses. The wide range of available tools, both 'analogue' and 'digital', indeed eases the implementation of a specific research question, but finding and developing the right method is rather the result of several 'trials and errors' and the success might depend on the specific research question as well as on the characteristics, e.g. age, of the participating volunteers (van der Sanden and Flipse 2016, Rauchfleisch and Schäfer 2018).
Research into the effect of the monitoring tool on data accuracy and in relation to the study species is less common, also from the perspective of offering monitoring tool choice to citizen scientists. In the present study, we involved participants of different ages in the long-term monitoring of the spatial patterns of different colour-ringed avian species, the greylag goose (Anser anser), the northern bald ibis (Geronticus eremita), and the common raven (Corvus corax). For this purpose, participants could choose to use analogue (pen and paper protocols) or digital (software application) tools. Individual life history parameters have been monitored for several years or decades (Hemetsberger 2001, Scheiber et al 2013). Therefore, the collected data provide information about presence/absence of the individual animals in certain locations at certain times as well as about the social relationships (pair- or familial-bond) among sighted individuals. We aimed to (1) measure accuracy of data collected by the participants depending on the tool used, i.e. the accuracy of identification of coloured leg bands and reported species; (2) compare the results obtained with analogue vs digital tools about the spatial abundances of the greylag geese; (3) investigate potential differences in data collection from ground-dwelling (i.e. greylag goose), aerial and arboreal (i.e. northern bald ibis and common raven) species; and (4) model the spatial patterns of abundance of one of the focal species, the greylag goose, in different biologically relevant periods of the reproductive season (i.e. before, during and after breeding) and additionally investigate whether breeders and non-breeders show similar spatial abundance patterns during the breeding season. We predicted that participants would deliver reliable observations of the focal species, as measured by the correctness of both the location and the identification of the individual bands of the birds as suggested by preliminary results (Frigerio et al 2012, Puehringer-Sturmayr et al 2018). We predicted similar behavioural patterns (i.e. spatial patterns of abundance) when considering different tools, as we assumed the applied tools to be best suited for the respective participants. Because of its presence on the ground compared to the more aerial/arboreal common ravens and northern bald ibis, we expected the greylag geese to be the most frequently observed species. Finally, we predicted greylag geese to prefer particular hotspots within the study area with breeders and non-breeders occupying the same locations.
2. Material/methods
2.1. Study site and focal animals
Data were collected at the Cumberland Wildpark (47.80°N, 13.95°E), a game park situated in a narrow valley at the northern edge of the Austrian Limestone Alps and adjacent to the Konrad Lorenz Research Center (KLF). The area of the game park (approx. 60 ha) was considered as the study area.
Focal animals were individual birds belonging to three different avian species, the greylag goose, the northern bald ibis and the common raven. These are the model species of the KLF, where scientists conduct basic research on the complexity of avian social systems. Neither populations of greylag geese nor northern bald ibis show regular migration, though occasional dispersal has been documented (Puehringer-Sturmayr et al 2022). Ravens undergo fission—fusion dynamics and might be present at the study site in different group sizes (50 upwards; e.g. Gallego-Abenza et al 2019). The flock of greylag geese is food-supplemented twice a day year-round and consisted of approx. 130 individuals at the time of data collection (see also Scheiber et al 2013); the colony of northern bald ibis is food-supplemented during winter and the breeding season (approx. till mid-July), with approx. 40 individuals at the time of data collection (e.g. Puehringer-Sturmayr et al 2020). Both populations use the study site for breeding and roosting at night while the foraging sites are located outside of the study area. The ravens use the study site as a regular food source by scrounging at the feedings of captive animals in the game park such as brown bears, wolves and wild boars.
All individuals of the three avian populations are free flying; all greylag geese and northern bald ibis and most of the common ravens are individually marked with a unique combination of coloured leg bands and wing tags (only ravens). No two individuals have the same combination of coloured leg bands. The birds are habituated to the close presence of humans, i.e. they can generally be approached to less than 5 m. Since the beginning of research on these bird species (greylag geese 1973, Frigerio et al 2014; northern bald ibis 1997, Frigerio and Gegendorfer 2013; common ravens 1995, Beck et al 2016), the long-term monitoring by the KLF has included the collection of life history data (age, sex, number of offspring, pair partner, etc) and social background (number of pair partners, duration of the pairbond, etc) for each banded individual from hatching (Hemetsberger 2001, Frigerio et al 2021).
2.2. Data collection
Data collection was supported by participants of any age, including school classes aged 6–18. Data were collected by applying two different tools: (i) 'analogue' and (ii) 'digital'. Both analogue and digital tools were applied to collect data on greylag geese, while only digital tools were used for observations on northern bald ibis and common ravens.
2.2.1. Analogue data
Analogue data were collected with pen and paper between April 2017 and August 2019. Along a route of approx. 2 km through the game park, participants recorded the following parameters on greylag geese: (1) the colour combination of the individual leg bands, (2) the location in which the goose was sighted, and (3) the date and time of the sighting (figure S1). To standardize data collection regarding the locations, pegs with the letters 'a' to 'm' were placed at intervals of about 160 m along the route through the game park. The same letters were reported on the map on the observation sheet the participants used to enter their sightings. A total of 424 observation sheets (figure S1) collected by approximately 800 participants provided a total number of 4896 sightings of individual greylag geese in the study area. Several participants joined the data collection repeatedly (e.g. once per month). Participation was not evenly distributed over the period of data collection with a peak in spring (i.e. April to June). All visitors of the game park were invited to join the data collection, though many school classes and several other participants visited the game park ad hoc for the data collection. The 'analogue' tool was mainly used with primary school pupils (i.e. children younger than 10 years) joining the project within the context of a collaboration programme between their school and the KLF. The participants were offered the possibility of joining a training session about the aims and methods of data collection. The training for school classes consisted of hands-on riddles and test-trials for the data collection, including a final playful test on the ability of correctly identifying the individual leg bands, as described elsewhere (Hirschenhauser et al 2019). Twenty-one school classes were among the participants (primary school pupils between 6 and 10 years of age). During data collection, all participants were given the possibility of being accompanied by scientific staff (generally one to two Master students, offering in situ support for leg band identification and location). In this respect, it is important to note that data were collected by participants alone, as such persons were exclusively trouble-shooting throughout the walk across all sampling locations.
2.2.2. Digital data
Digital data were collected between January 2018 and December 2019 using the app 'Forschen im Almtal' (Spotteron, www.spotteron.net). Per sighting, the following parameters were recorded: (1) the bird species observed, (2) the colour combination of the individual leg bands or/and the wing tag, (3) a photo of the observed bird (this was a mandatory field, to control for potential errors, such as entering an incorrect species name or an incorrect combination of the coloured leg bands in the entry mask of the app), (4) the location of the individual bird (GPS coordinates, recorded automatically by activating the GPS function of the digital device used and by marking the individual bird as a spot on a map provided by the app). Date and time of the sighting were provided automatically via the GPS function of the digital device used. Over the period of data collection, 2123 sightings were uploaded. Of these, 1539 sightings referred to the three model species (1245 greylag geese; 98 northern bald ibis; 196 common ravens), whereas the other sightings referred to other animal species seen in the game park. During the two-year observation period, 130 participants created an app account; groups (e.g. school classes) generally used one account that allowed several people to upload their observations. The total number of participants is estimated to be 930. Among the participants, 31 school classes and 11 other groups (e.g. families, adults, summer holiday groups) joined the project. The 'digital' tool was generally used by children older than 10 years (if they joined the project with their school class) and by the majority of the other participants. The participants were offered an introduction to the project and methods for data collection.
For reasons related to privacy policy, we are only able to provide an approximate number of participants in relation to exactly reported number of sightings.
Detailed information on data entry is listed in the supplementary material.
2.5. Data analyses
2.5.1. Verification of data accuracy
In order to test for data accuracy, (i) leg band, and (ii) species identifications were checked for correctness in both 'analogue' and 'digital' tools. To measure the accuracy of leg band identification, recorded leg band combinations were first compared with the leg bands visible on the mandatory photo taken of the observed individual (digital tool, participants had to upload a photo using the app) and, in a second verification step (both analogue and digital tools), with the Research Centre's databases, which are available for each species. These databases contain all individuals with their respective leg band combinations and wing tags. The accuracy of species identification (data collected via the digital tool) was verified using the mandatory photo.
Observations were classed into (1) leg band combinations noted, which was further divided into leg bands correctly identified and leg bands indicated with minor mistakes, (2) leg band combinations not noted, and (3) species identified. Minor mistakes were considered when the leg band combinations of the right and left leg of the animal were swapped (e.g. left leg was indicated as green-yellow instead of the right leg) or when the order of the leg band combination was given bottom-up instead of top–down (e.g. yellow-green instead of green–yellow. The corrected dataset—either the mistakes were already noticed by the accompanying persons or the submitted data were compared with the mandatory photo and/or the species databases—was used for further analyses.
2.5.2. Comparison between analogue and digital methods
To enable comparison of patterns of results between analogue and digital tools, GPS coordinates of the digital data collection were linked to the peg locations of the analogue data collection. Sum of sightings was calculated by counting the single observations per data collection method ('analogue' vs 'digital'), day (date on which observations were collected), and location (pegs 'a' to 'm'), which was included as response variable in the model.
To estimate the effects of data collection method ('analogue' vs 'digital') and location (pegs 'a' to 'm') on spatial abundance (sum of greylag goose sightings), we used a generalized additive model (GAM) with a Tweedie response distribution. Data collection method, location, and their interaction were included as fixed effects. The reason for including the interaction was that we expected differences in the sighted locations depending on the data collection method used. To account for varying observation number per location and data collection method, we included number of observations (log-transformed) as an offset term into the model. In addition, we evaluated the significance of each predictor variable using the Wald-like tests. For this model, we created a subset of the three-year dataset including only the years of data collection in which both methods were used (i.e. 2018–2019).
2.5.3. Spatial patterns of abundance in greylag geese
In order to investigate spatial patterns of abundance of the greylag geese in different periods of the reproductive season, we clustered the data according to three biologically relevant periods: (i) before the breeding period (before incubation start), (ii) during the breeding period (from incubation start to fledging of the young), and (iii) after the breeding period (after fledging of the young). Such biologically relevant phases were defined considering the beginning of the breeding period with the first day of incubation of the female greylag geese. The end of the breeding period was set at fledging of the young (∼10 weeks after hatching). For the individual geese which did not reproduce, the breeding period was set considering the very first day of incubation (∼March 10th) and the very last day of fledging within the flock (∼July 15th). Furthermore, the last day on the nest or the last day having goslings were set as end of the breeding period in case individual geese failed reproduction. Such life history information is part of the long-term monitoring of the KLF and relies on regular observations since 1973 (up to three times a week, Hemetsberger 2002). Accordingly, all individuals having a nest were considered as 'breeders' whereas those not having a nest were considered as 'non-breeders'. We combined data from both analogue and digital data collections for further analysis.
Sum of sightings was calculated by counting the single observations per breeding period (before, during, after), day (date on which observations were collected), and location (pegs 'a' to 'm'), which was included as response variable in the model.
To estimate the effect of breeding period (before, during, after) and location (pegs 'a' to 'm') on spatial abundance (sum of sightings) of greylag geese independent of their breeding status (breeder, non-breeder), we used a GAM with a Tweedie response distribution. Breeding period, location and the interaction between breeding period and location were included as fixed effects. The reason for including the interaction was that we expected location preferences to vary between breeding periods. As above, to account for varying observation number per location, we included the number of observations (log-transformed) as an offset term in the model. In addition, we evaluated the significance of each predictor variable using the Wald-like tests. Densities of spatial abundance represent distribution clusters for each location using the sum of sightings data (computed clusters of the sightings from 'a' to 'm' on locations). The density plots were created with geom_density_ridges in R. Density hotspots (kernel density estimation) were then calculated by summing all sightings per location (i.e. computed clusters of the sightings from 'a' to 'm' on the entire data). The hotspot plots were plotted with stat_density2d in R. The dataset for this model comprised both analogue (2017–2019) and digital (2018–2019) data.
To test whether breeders and non-breeders show similar spatial distributions (locations from 'a' to 'm') during the breeding period, we applied a chi-square test of independence.
All statistical analyses for the analogue and digital data collection were performed using the software R 4.0.2 (R Core Team 2020) and the package 'mgcv' (Wood 2011). For the GAM models we tested two different distributions for the response: negative binomial and Tweedie. The negative binomial and Tweedie response distributions were almost identical in terms of performance (using Spearman's Rank Correlation to assess the performance of each model in terms of the ranking of predicted counts; this method is suitable when analysing the abundance of species). Thus, we selected the Tweedie distribution, which is suitable for processing data with extreme counts. Both GAM models include Julian day (same calendar dates in different years had the same value for day of the year) as a spline smooth function (default values were retained) and were fit through the restricted maximum likelihood method. The models were checked with the gam.check function.
3. Results
3.1. Accuracy of leg band identification in 'analogue' data (only greylag geese)
Overall, the percentage of useable data collected by the participants with analogue tools ranged from 89% (non-school classes) to 94.3% (school classes). Pupils made 11.6% fewer minor mistakes compared to other participants (28.4% vs 25.1% respectively).
3.2. Accuracy of leg band and species identification in 'digital' data (all three species)
We collated the accuracy of species and colour leg band identification by all participants. The three focal species were correctly identified in most cases (greylag geese 99.3%, northern bald ibis 100%, common ravens 100%; figure 1). The accuracy of colour leg band identification differed across focal species and was higher for greylag geese (63.3% correct leg bands) than for northern bald ibis (12.5%) and for common ravens (60%). Participants made the fewest number of minor mistakes when noting wing tags in common ravens (10%) compared with coloured leg bands in greylag geese (34.7% minor mistakes) or northern bald ibis (75% minor mistakes; figure 1).
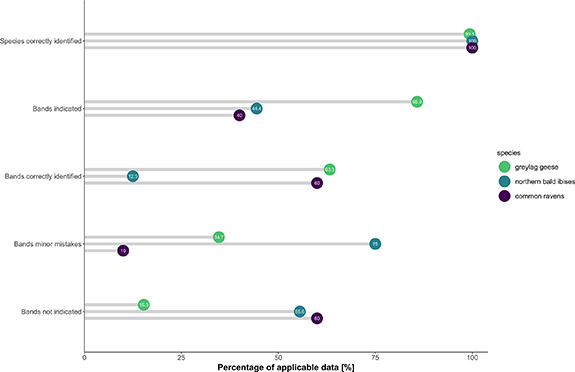
Figure 1. Accuracy of band and species identification in digital data, shown as percentages of correctly identified species, correctly identified bands, minor mistakes, indicated or not indicated bands for the three avian species considered (greylag geese, green; northern bald ibis, teal; common ravens, purple).
Download figure:
Standard image High-resolution image3.3. Comparison between analogue and digital methods
Overall, spatial patterns of abundance (sum of sightings per data collection method, day and location) clearly differed with the interaction between data collection method and location ('a' to 'm', Wald-like test for individual fixed effects: F11 = 1.921, p = 0.036; table S1). Higher abundances were recorded in location 'i' using the digital tool compared to analogue tool (table S1; figure 2); in addition, locations 'j–k' tended to also have higher abundances recorded with digital tools. However, spatial hotspots were found to be similar between the two different methods applied for data collection, although the effect was most pronounced after the breeding season compared to the other two seasons (figures 3(A) and (B)).

Figure 2. Density of spatial abundance of greylag geese from locations 'a' to 'm'. Sightings were collected from 2018 to 2019 with the analogue (purple, pen and paper) or digital (yellow, app) tool.
Download figure:
Standard image High-resolution image
Figure 3. Density hotspots of abundance of greylag geese in the locations 'a' to 'm' before, during and after the breeding season collected with analogue (A) and digital (B) tools from 2018 to 2019. The level shows a gradient of values increasing with abundance (black—low abundance, yellow—high abundance). White dots and labels indicate the mean longitude and latitude of locations 'a' to 'm'. Several hotspots of greylag geese sightings are apparent.
Download figure:
Standard image High-resolution image3.4. Spatial patterns of abundance in greylag geese
Spatial patterns of abundance varied with location (Wald-like test for individual fixed effects: F12 = 7.068, p < 0.001; table S2) and season (Wald-like test: F2 = 5.269, p = 0.005; table S2). Greylag geese were more abundant at locations 'd–m' (table S2; figure 4(A)). Hotspots of greylag goose sightings within the study area were identified in locations 'a', 'b', 'c', and 'h', 'i', 'j' (figures 3(A) and (B)). Furthermore, greylag geese were more abundant during and after the breeding season compared to before the breeding season (table S2; figure 4(B)). The interaction between location and season did not affect spatial abundance (Wald-like test: F24 = 1.492, p = 0.064; table S2).
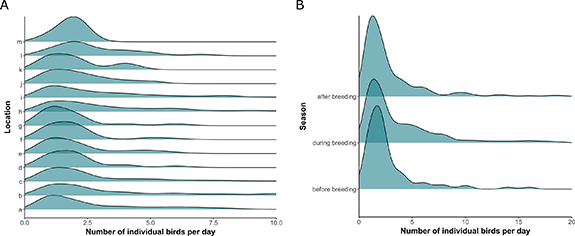
Figure 4. Density of spatial abundance of greylag geese from 2017 till 2019 collected with analogue and digital tools. (A) Goose abundance in relation to the locations 'a' to 'm'. (B) Goose abundance during the three different seasons (i.e. before, during, and after the breeding season).
Download figure:
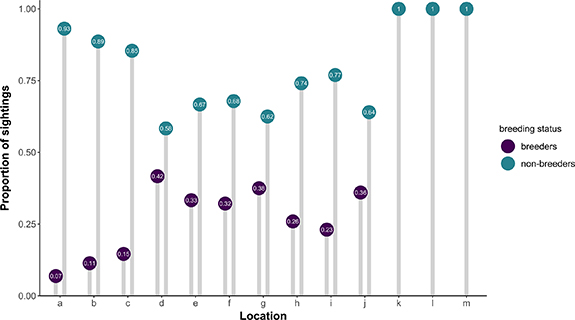
Standard image High-resolution imageMoreover, during the breeding season, breeding status was significantly associated with goose location (chi-squared = 35.839, p-value = < 0.001). Specifically, non-breeders and breeders were sighted together in the same locations (both males and females; figure 5), even though non-breeders were sighted significantly more often at locations 'a', 'b', and 'c' compared to breeders. Other locations ('k', 'l', 'm', figure 5) were apparently exclusively used by non-breeders.
Figure 5. Proportion of sightings of greylag geese in the locations 'a' to 'm' depending on their breeding status, i.e. breeders (male or female, purple) vs non-breeders (teal). Data were collected from 2017 to 2019 with analogue and digital tools.
Download figure:
Standard image High-resolution image
4. Discussion/conclusions
Our study finds evidence that two different methods applied for data collection provided different results with respect to spatial abundance of greylag geese. However, similar results were found with respect to spatial hotspots of greylag geese. Pronounced differences in the quantity and quality of the collected data were found depending on the study species. As expected, the more aerial/arboreal ravens and northern bald ibis were sighted less frequently and with more mistakes than the ground-dwelling greylag geese.
Similar patterns were found for accuracy of sightings. The participants had low accuracy in identifying the leg bands of northern bald ibis (12.5% accuracy) compared with greylag geese (63.3%) and ravens (60%). This could be associated with the conspicuous presence of the greylag geese in the study area along the data collection route and with the difficulty of searching for birds in trees and identifying their leg bands or wing tags. In general, even though participants were asked to record sightings of all focal species, data collection for the greylag goose was most exhaustive, i.e. with the least amount of missing information. The frequency of sightings was unevenly distributed among the three focal species, with most observations of the ground-dwelling greylag goose (1200 sightings) compared to the mostly arboreal and aerial northern bald ibis (approx. 100 sightings) and raven (approx. 200 sightings). There are known temporal differences in the behaviour of the three focal species, with diurnal behaviour in greylag geese (Scheiber et al 2013) and more early morning activity patterns in northern bald ibis and ravens in the study area (Gallego-Abenza et al 2019, Puehringer-Sturmayr et al 2020), which may have biased the frequency of sightings between species. In addition, other context-dependent considerations may have indirectly favoured the sightings of greylag geese compared to the other two avian species: (i) greylag geese tolerate humans in close presence (<5 m); (ii) further free-living waterfowl present in the research area can hardly be confused with the greylag goose (e.g. resident species: mute swans, Cygnus olor, mallards, Anas plathyrynchos; migratory species: common teals, Anas crecca, garganey, Spatula querquedula, tufted duck Aythya fuligula, regular visitors: goosander Mergus merganser; Drack 1992; J. Hemetsberger pers. comm.) whereas (iii) carrion crows (Corvus corone) might have challenged species identification in relation to ravens, and (iv) no optical aids (i.e. binoculars, spotting scopes) were provided, which may have limited sightings of northern bald ibis and ravens. However, we cannot exclude the possibility that volunteers brought their own equipment for data collection. Therefore, a key finding of this study is the need to carefully identify participant accuracy profiles for each focal species and consider adapting e.g. the temporal window for data collection to the strength of the participants. This could be achieved by fostering communication, e.g. in form of interaction and feedback between the scientists and the participants (Peter et al 2021).
Monitoring activities are among the most common tasks for citizen scientists, especially in natural and environmental sciences (Bonney et al 2014, Chandler et al 2017, Crimmins and Crimmins 2022). In general, our study underscores the importance of the project design in order to obtain useful data (Peter et al 2021). In our study, the use of either analogue or digital tools for data collection produced different patterns of abundance, suggesting that different tools might reach out to different groups of participants and that rather the combination of different tools contributes to an exhaustive picture for the research question. In general, the use of an app instead of pen and paper shortens the time necessary for entering the data, which may explain the increase in greylag goose numbers recorded with the digital tool. Additionally, our app had a mandatory field for uploading a photo of the sighted animal, which eased the post-hoc control of the collected observations by both the participants themselves and the scientists. The analogue approach was compelled by the cooperation with the schools, even though it was not used exclusively by children of compulsory school age. This way, our project contributed indirectly to inclusion for citizen science projects by considering the diversity of the participants (Brown et al 2019, Spiers et al 2019, Pateman et al 2021).
Indeed, the diversity of the participants is a major aspect for project design as it could affect data accuracy. In our study, school classes participated in the project during school time, and the sightings and activities (both digital and analogue) were part of their school lessons, although they did not form part of any formal assessment. The students were accompanied by a Masters student during the participation and presumably this person could troubleshoot and respond to questions or uncertainty in real time. It is plausible that most of the pupils behaved according to school rules and structures and were therefore very aware of the tasks. The 'non-school class participants' contributed to data collection as part of their own leisure activities and mostly in the absence of a mentor/scientist to whom they could direct questions during the activity. However, a special feature of the app that allowed the users to showcase accurate sightings with the framing 'Top Spots' was used to give feedback to users and, at the same time, emphasize best practice examples for other participants. Furthermore, the age of the participants could have affected the accuracy of the data. For instance, there is evidence to suggest that observers' age may negatively affect long-term monitoring of some avian species because of, for example, hearing loss effects (Farmer et al 2014). Pateman et al (2021) showed different degrees of participation depending on age, often in combination with ethnicity and/or rural-urban environmental context. In our case, we certainly only know the age of the participants from the school classes joining the analogue data collection, therefore, the possible effect of age remains speculative and could be specifically addressed in the future (a preliminary comparison between children in compulsory school age and all other participants suggests no age-related differences, own unpublished data).
A further aspect of project design in such a long-term research approach is the recruitment of and on-going support for participants. For this purpose, game elements (i.e. competition, reward) can be applied to support data collection and foster participation (Thiel and Fröhlich 2017). Therefore, we joined public outreach events, such as for instance the Austrian Citizen Science Award, a national award promoted by the Federal Ministry for Science and Education and offered prizes in cash to school classes, whereas single persons could compete for non-cash prices. Together with the management board of the game park, we promoted a 'Wildpark Challenge' as a seasonal event was aimed at collecting 1000 sightings over a period of a couple of months in spring-summer. In both cases, i.e. the local and national award, the best participants that provided the most correct sightings were awarded in different categories (i.e. school classes and single persons).
Finally, beyond the methodological aspects for citizen science projects, we also generated new scientific knowledge. The participants contributed to quantify spatial patterns of abundance and spatial hotspots of the greylag goose flock. In fact, even though we were aware of the regular presence of the flock at the study site in general, time and financial constraints did not allow the regular collection of such information and therefore potential preferences in the use of specific locations within the study area remained unexplored. This represents one of the major benefits of citizen scientist involvement in research, i.e. the possibility to collect data over large geographical and temporal scales that a small team would be unable to collect. Our results show differences in the use of the available area. Research results on greater snow geese, Chen caerulens atlantica, showed large individual variation in space and habitat use by goose families, though on a much larger scale than ours (70 km2 area against 0.6 km2 study site in our case; Hughes et al 1994). In the greater snow goose study, ecological factors seem to play a role as do site fidelity and foraging behaviour (Cooke et al 1995). The patterns found in our study are of interest as they can create new testable hypotheses. The results of this study showed areas with non-breeders only, which we were not aware of. Additionally, both male and female breeders (individuals with an active nest) were sighted in the same locations as non-breeders which suggest that social relationships play a major role in affecting spatial patterns of abundance in greylag geese. Social complexity, including close and long-term family relationships are well known in greylag geese (Scheiber et al 2013). Generally, male and female pairs occur in close proximity to relatives, including offspring of former years (Frigerio et al 2001, Scheiber et al 2009). This pattern seems to persist also during the breeding season, when the flock disperses and the tight secondary family bonds (i.e. parents and subadult offspring) loosen up (Rutschke 1982). Understanding the mechanism and function of such complex associations is a core challenge for biologists examining social complexity (De Vries et al 2003). There is evidence that proximity to relatives reduces physiological stress profiles (Kaiser et al 2003, Scheiber et al 2009), thwarts predation attempts, increases access to food resources, and enhances mating opportunities (Krebs et al 2012).
Taken together, our findings support the view that the involvement of volunteers in research projects can generate accurate data collection for certain focal species with the potential to open new vistas on complex phenomena that cannot be captured by small teams. While the participation of school classes does not formally qualify as volunteering because the teachers and/or the school authority made the decision that students participate, their contribution to scientific projects might be advantageous for education outcomes, as it was shown to foster the long-term retention of the acquired knowledge (Hirschenheauser et al 2019). Thus, while not measured in this study, the participation in such projects is expected to generate benefits for society, both because expansive datasets can inform decision-making about complex phenomena such as, for instance, biodiversity loss, and because transformative processes in individual participants may lead to changes in knowledge, attitudes and behaviours about natural resources (e.g. Brewer 2002, Brossard et al 2005, Razen et al 2020). In our specific case, the citizen science approach strengthened the collaboration with the game park and supported the standing of the Research Centre and of science in general within the local and regional community (Frigerio et al 2019). Combined, citizen scientist participation can result in win-win outcomes for all stakeholders: the researchers gain relevant data, the game park can offer special leisure activities (engagement) associated with knowledge acquisition, and society can benefit from its members' enhanced educational engagement and appreciation.
Acknowledgments
We gratefully acknowledge C Steinbacher for valuable field assistance and preliminary supervision of the digital data collection; P Hummer (Spotteron) for the permanent and constructive support with regard to the digital data collection; B Lankamier and the staff of the Cumberland Wildpark Grünau im Almtal for the willingness and engagement to build up a long-term cooperation. Our deep appreciation goes to the app-users for their valuable contribution to research: Alexander Wiesinger; Alma Nussbacher; Almdonald; Andreas Bartl; Anna, 2c; Barbara Buchegger; BBS Rohrbach, IV b HAK; Berufsschule, 3. Klasse; BG Gmunden 3a; BG/BRG Lichte 6c; BG/BRG Lichtenfels 6a; BG/BRG Lichtenfels 6b; bggmunden1c; Brg solar city, 6 Kasse; Carlos Trilsam; Christian Hagmayr; Christof Buchegger; Citizen Science Summer School, Spotteron; Cora, 2c; DavidG; Deniz Cankaya; Elisagula20; Elitsa Popova; Ester Ganzenbacher; Fabian Leeb; FeldmethodenkursSS18; Felix Bauer; Felix H; Flo Hirti; Francesca0809; führungklf; Gamershund; GegendorferE; Georgine Szipl; GerdaFellinger; Graugans; GudrunBraun; Gym Gmunden, 3A; gymgm3c; Ha Haspip; HakGmunden; Harald Oswald; Helgari; Ines Huemer; Isomax; Johannes Steinbacher; Jürgen Poschacher; Ka vonSeiten; Katharina Buchegger; Kinderuni; Kinderuni Steyr; KinderUniOOE; KIUAlmtal; Klara Mitter; Klasse1; Klaus Kienesberger; KXXsch; Laurenz; Lena Campostrini; Lenalol; Leom Wittig; Lisa Rötzer; Livia, 6. Klasse; Lorenz Schinagl; Luan493; Ludwig Leeb; Makakihe; ManuelAchleitner; Margarita Artemis Milidakis; Maria Fuschl; Maria Kienesberger; Marlene Moser; Martina W.; Matteo Wilhelm; Merry Hemetsberger; Methodenkurs19; Michael Forintic; Michl Kutschera; Nane Steinbacher; Nellie; Niklas13; Nikolaus; Nils Holgerson; Nina Brunner; NMMSStMartinez2m; NMS Gmunden Stadt 3C; NMS Gmunden Stadt, 3A; NMS Gmunden, 1B; NMS Scharnstein, 3b; NMS SEITENSTETTEN, 3a; NMS Sierning, 1a; Nms timelkam, 1b; NMS21b; nmstimelkam1a; nmstimelkam1c; Nono1234554321; Nora Bisi; Olivia S.; P2; Pamela Leberbauer; Pamina; Paul Lidauer; PaulHubmer; Pol-Edern Le Renard; PTS Kirchdorf, P3; PTS Kirchdorf, P6; Rita Sieberer-Kefer; ROLO203; Roland Kurzmann; Sabine Hafner; Sabrina Jungheim; Sabsinehart; SimonSchnitzel; SMS Mondsee, 2d; Smsmondsee2c; Stockha; Talente19; talentekurs18; Tweety Steinmaurer; UlrikeWagner; Underground; Valentin Mittermayr; Valentin Springer; Wolfgang1; Wolve888. Likewise, we greatly appreciated the interest in and the support for our activities by the several schools involved in the analogue data collection (herewith the teachers are mentioned): Volkschule Grünau: K Hufnagl, M Lankmaier, A Merschitzka, S Schiefermair, M Wallner, R Wittmann; Volkschule Mühldorf: M Bammer, C Freund, M Hasibeder, M Holzinger, A Lasch, K Mairhofer, C Pfisterer, B Steinhäusler, K Steinkogler; Europaschule Linz: U Danninger, J Leeb, J Sternberg, R Wimberger; Volksschule Gschwandt: A Hauer, G Plasser; Hort St Florian: E Kornfeind; Volkschule 10 Wels: S Kaiblinger. Additionally, we wish to acknowledge all the anonymous participants, whose names are currently not known to us.
Data availability statement
All data that support the finding of this study are included within the article (and any supplementary files).
Funding
Programme Sparkling Science, Project SPA-05/26 and Programme Top Citizen Science, Project TCS-02/06 to VPS. Programme Sparkling Science, Project SPA-06/155 to JR, GG and DF. Programme FFG-Bridge, Project 858551, to DF. Programme NATURSCHAUSPIEL.AT to JR and GG. Permanent support came from the 'Verein der Förderer der Konrad Lorenz Forschungsstelle' and the "Herzog von Cumberland Stiftung". Open access funding provided by University of Vienna.
Conflict of interest
The authors have no conflict of interest to declare.
Authors contribution
The manuscript contains only material that is either original and has not been published or submitted elsewhere or stems from publications identified by a reference. All authors have seen the final manuscript and take responsibility for its contents.
DF conceived the ideas and designed methodology. DF, GG, JR and VPS designed data collection. GG, JR and VPS contributed to data collection. JR processed the data. VPS performed statistical analysis. DF, VPS and SK led the writing of the manuscript. All authors commented critically on each draft of the manuscript and gave final approval for publication.
Ethical statement
This study complies with all current Austrian laws and regulations concerning the work with wildlife. All data were collected non-invasively under Animal Experiment Licence Nr. BMWF-66.006/0011-WF/II/3b/2014 by the Austrian Federal Ministry for Science and Research. The authors adhere to the 'Guidelines for the use of animals in research' as published in Animal Behaviour (1991, 41, 183–186). We confirm that the owner of the land, the Duke of Cumberland, gave permission to conduct behavioural studies on his site. A partnership agreement was signed between the research institution (KLF) and the authorities of the schools joining the project. Furthermore, according to Austrian privacy policy (BGBI. I Nr. 165/1999), a declaration of consent was signed by the parents of the children participating to the project. Afterwards we additionally asked for consent from the legal school authorities. The adult participants were voluntarily joining the project.
Supplementary data (<0.1 MB CSV)
Supplementary data STAT2 (<0.1 MB CSV) Spatial patterns of abundance
Supplementary data STAT3 (<0.1 MB CSV) Reproductive status
Supplementary data TEXT (0.3 MB PDF) Additional material