


Abstract
Household access to clean energy is a priority for public health and the environment in low- and middle-income countries. However, past illustrative studies have explored benefits of replacing all polluting energy sources, a transition that is only theoretically possible. Factors that limit achievement of the entire theoretical reduction potential should be explored to inform programmatic decision making. We propose a hierarchy of reduction potentials for emissions from household energy, representing different implementation barriers. Following similar work in renewable energy, we propose four categories of reduction potentials beyond the theoretical maximum: distributional, technical, economic, and market. We apply this framework to household energy emissions using a high-resolution spatiotemporal emission inventory of India, a country chosen for its data availability and level of interest in mitigation. We explore distributional potential using distance from urban areas, technical potential by attributing emissions to energy services, and economic potential with a village- level proxy for likelihood of program success. For distributional potential (spatial accessibility), we find that applying reduction programs within 5 km of urban centers would achieve 36%–78% of the theoretical potential across seven regions in India; extension to 10 km yields reductions of 63%–90%. Technical and economic reduction potentials differ most greatly from theoretical potential in regions that contribute the most to national emissions. Even if some of the relationships underlying emission causes are not completely known, reflecting the factors that affect transitions can inform practitioners and programs seeking to scale and deliver clean energy solutions. We assert that including these important influences should be a goal of emission inventory development, beyond the simple quantification of baseline emissions.
Export citation and abstract BibTeX RIS

Original content from this work may be used under the terms of the Creative Commons Attribution 4.0 license. Any further distribution of this work must maintain attribution to the author(s) and the title of the work, journal citation and DOI.
1. Introduction
Burning solid fuels and kerosene in homes creates exposure to particulate matter and ozone, which are leading risk factors for public health in low and middle income countries, accounting for 4% of the global burden of disease and 1.6 million premature deaths annually [1]. Measures that provide achievable and sustained emission reductions will be critical for reducing national burdens of disease [2] and meeting indoor and outdoor air quality guidelines [2, 3]. They will also assist in realizing commitments to reduce greenhouse emissions [4].
Modeling studies have shown that household technologies that eliminate emissions of aerosols and ozone precursors benefit human health, air quality, and climate [5–8]. These studies have helped establish the principle that household access to clean energy is a priority for public health and the environment by illustrating maximum emission reductions achievable by displacing all polluting technology and fuels with the cleanest alternatives. A typical scenario is switching the wood consumption in all homes to liquefied petroleum gas (LPG). This maximum reduction is commonly called 'theoretical potential' [9].
In practice, measures and programs do not completely displace polluting energy sources and devices for several reasons. Adoption and sustained use of low-emission technologies, and the cessation of polluting devices, are far from predictable [10]. In this work, we explore practical limitations in achieving emission reductions, using a reduction-potential framework analogous to common practice in renewable energy [9]. Achievable displacement of traditional energy sources by renewable ones is described as a series of successively smaller potentials: 'technical potential', which includes land-use and performance limitations, 'economic potential', which includes affordability considerations, and 'market potential', which includes the regulatory and competitive environments. Figure 1 shows an analogous progression for emissions from household energy, with each level discussed below.
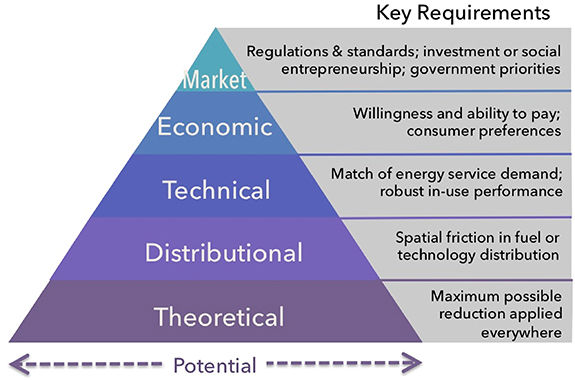
Figure 1. Hierarchy of reduction potentials for emissions from household energy, showing a sequence of limitations in achieving the maximum theoretical potential.
Download figure:
Standard image High-resolution image1.1. Distributional potential
For household energy emissions, users are spatially dispersed, distribution costs can be relatively high, and supply-chain constraints are difficult to separate between technical and economic potentials. We therefore introduce the term 'distribution potential' (figure 1), which incorporates the spatial dimension and its costs (spatial friction) but neglects other factors that affect technology transition. Achievable emission reductions that consider spatial limitations are often much lower than the theoretical potential [11].
1.2. Technical potential
A second type of obstacle to achieving emission reduction potential comes from mismatches between the energy service demand and the offered technology. High emissions from resource-constrained homes are attributable to cooking services, yet technologies developed for these services may not be appropriate for meeting needs such as space heating, water heating, and income-generating activities [12, 13]. Pandey et al leveraged nationally representative household surveys to develop an state-level emission inventory for India that disaggregated residential emissions into cooking, space heating, water heating, and lighting services [14]. They identified non-cooking services as major contributors to emissions in some locations and seasons. Chowdury et al showed that achieving air quality standards in India would require addressing all residential energy services considered in Pandey et al, not just cooking [2]. Yet, most programs focus on cooking devices alone. Because this mismatch between needs and provision might be resolved by providing different technologies, we refer to this limitation as that of 'technical potential', also shown in figure 1. Poor emission performance in real contexts, as compared with that demonstrated in laboratory tests [15, 16] would also yield a decrease in technical potential.
1.3. Economic potential
Associations have been identified between adoption of clean energy (fuels or technologies) and characteristics of adopters at household, regional or national levels; however, complete causal pathways that describe adoption of clean technology in any setting have not been determined. Using longitudinal data from nine countries, Schupler et al found that subnational and community-level factors were positively associated with transitions to clean energy in areas not influenced by interventions but the association of socio-economic factors varied heavily between countries [17]. In India, for example, transition to clean fuels was best predicted by education level, household wealth indicators, changes in the prevalence of polluting fuels in the surrounding community, and the number of rooms in the home. Lewis and Pattanayak found that income, education, and urban location were most consistently associated with adoption of clean fuels and improved stoves [18]. Rehfuess et al reviewed results from 57 clean cooking programs, identifying that satisfaction of energy needs, fuel savings, financial access and support, and institutional program support were critical, but not a guarantee for success [19, 20]. The authors concluded that prioritization of factors leading to uptake of clean technologies or fuels was not possible given the strength of evidence and variability across studies. Many of these findings are based on simple univariate analyses, and wealth indicators are difficult to separate from other factors. Although some of these explanatory variables relate to consumers' preferences rather than their financial limitations, we use the term 'economic potential' for the reductions associated with the reductions associated with preferences and financial limitations.
1.4. Market potential
Following Lopez et al, we include the top of the pyramid, 'market potential', as the group of measures favored by market mechanisms and incentives [9]. However, market potential is not explored in the present work.
1.5. Emission representation
The influence of energy-related activities on health burdens and climate impacts has been estimated using emission inventories, or tabulations of emitted pollution, that can be incorporated in models of atmospheric chemistry and chemical composition [21]. Residential emissions are estimated from energy use characteristics, such as fuel consumption or prevalence of solid fuel use, that are aggregated at national levels, or at state or province levels for larger countries. Total emissions are then distributed among much smaller cells according to proxies, like population. Estimated changes in emissions are based on the performance characteristics of replacement technologies, and then after modeling of atmospheric transport, changes in impact are estimated from the impact-response functions that relate air concentrations to health and climate. However, this procedure does not represent the mechanisms or governing factors needed to evaluate the various constraints on technology penetration. Now that the theoretical benefits of household energy transitions have been firmly established, the factors that limit achievement of the entire theoretical potential should be explored.
This work contributes to assessing the reduction potentials shown in figure 1 for household energy emissions in India, a country chosen for its data availability, ability to demonstrate heterogeneity, and level of interest in mitigation. We develop an emission inventory with high spatial resolution that is suited for this analysis by incorporating village and town demographic characteristics, including energy sources. We explore distributional potential using distance from urban areas, technical potential by attributing emissions to energy services, and economic potential by comparing with a village- or town- level proxy for likelihood of program success. To our knowledge, this is the first identification of different mitigation potentials for household energy emissions, which builds upon a complete redevelopment of inventory procedure to provide an appropriate analysis base.
The novelty of the reduction-potential approach means that definitions of specific potentials are debatable, having not yet received thorough community discussion. We present the framework in figure 1 as a guide to distinguish among potentials because they represent different types of implementation challenges. For example, distribution potential can be addressed by incentivizing supply chains rather than seeking to alter consumer behavior. We recognize that some of the definitions may have uncertainties, and we explore some of those sensitivities. We also acknowledge that some potentials may overlap; a household could overcome distributional limitations with an economic solution—paying more for delivery. Nevertheless, we argue that uncertainties in the effects of these diverse limitations are far greater than the uncertainties in the physical system of emissions and exposure that have received much more scientific attention. A discussion of the most influential barriers is necessary for progress, even if their delineation lacks precision.
2. Methods
2.1. Inventory development
The common approach to emission spatial distribution, allocating by population, does not reflect actual spatial heterogeneity that demonstrates distributional constraints. The application of a single emission factor to an entire category of fuel, without identifying the services provided by that fuel, prevents discussion of technical potential.
We addressed these limitations by developing an inventory of residential energy use, fuel use and emissions that employs reported fuel use characteristics at the village level [22]. Boundaries of villages and towns were from the India Village Level Geospatial Socio-Economic Dataset (IVGD), which was constructed using digitized official cadastral maps published by the Survey of India for 2001 [23]. This dataset more closely reflects official boundaries and locality (i.e. urban/rural) classifications, unlike visual proxies (i.e. nightlights, ground cover), that may not correlate with political boundaries. Information was taken from the 2011 census, and the inventory was developed at monthly resolution using variability in services, described below.
The IVGD dataset contains partial demographic information from the 1991 and 2001 Indian census but does not include information from the 2011 census or fuel use characteristics. Tabular village and town level household characteristics for 2011 were downloaded from the Census of India online database and merged to IVGD. Additional data cleaning steps were taken to correct known issues with the dataset, including duplicate polygons, and to resolve changes in the administrative boundaries that occurred between 2001 and 2011 that affected the merging of census data to the IVGD polygon file. These procedures are described in the supplemental information.
Required energy for cooking, space heating, and water heating services were based on household estimates specific to India reported in Pandey et al [14]. Hours of lighting with kerosene lamps were estimated from in-field device usage measurements from Lam et al [24]. In Pandey et al, energy requirements for cooking were estimated from food consumption surveys, separately for rural and urban homes at the state level. Fuels used to meet various service needs were based on reported cooking and lighting fuels from the 2011 Indian Census at the village and town level. National surveys do not inquire about fuels used for water heating and space heating, so it was assumed that water heating was performed with the same fuel used for cooking, and space heating was performed with wood. This assumption likely results in an underestimate of emissions from water heating and lighting services in rural areas, since many households have been observed to use clean fuels for cooking while continuing to rely on biomass for their most energy intensive tasks [13].
In the inventory, the representation of cooking, space heating, and water heating energy services change monthly in response to ambient temperature. Temperature thresholds on service requirements are based on assumptions in Pandey et al, and are calculated at moderate resolution downscaled using a 0.75 × 0.75 degree, 25 year average temperature grid from the ERA-interim reanalysis dataset [25]. Hours of lighting service are assumed to be constant for the entire year and are not affected by ambient temperature or time of year. Further details on the dynamics of various services with temperature can be found in the supplemental information.
Emissions were calculated using service-based emission factors derived from fuel-based emission factors and device efficiencies (equation (1)). For each administrative unit, total emissions are the sum of emissions from individual services (j), each of which is met with several fuels (k):
where Em is emissions in grams, P is the number of households in a village or town, and fj,k is the fraction of homes in which fuel k is used for end-use j. UEj is the per-household service required for end-use j for the period in question (e.g. MJ delivered or hours of light), ηj,k is the efficiency of the device used to burn the fuel (MJ fuel per service), and LHVk is the lower heating value of fuel k in MJ per kg fuel. EFj,k is the emission factor in grams of pollutant per kilogram of fuel burned.
Emission rates for PM2.5 are reported for exploring reduction potentials and sensitivities in this study, but the full inventory includes emissions for CO2, PM2.5, BC, OC, CO, CH4, NMVOCs, and NOx. Estimated fuel consumption rates were converted to emission rates using fuel-specific emission factors based on a review of field and laboratory studies, which was used to update the Speciated Pollutant Emissions Wizard inventory and to generate summary estimates by fuel type [26]. Priority was given to emission factors measured from field-based studies, because laboratory measurements of stove and lighting emissions tend to be lower than those of devices measured in actual homes [15, 16, 27], perhaps due to higher variation in fuel quality and operator behavior. Fuel-specific emission factors used for this analysis are summarized in the SI. In transition scenarios, areas meeting transition criteria are assumed to transition to technologies with emission characteristics of LPG.
2.2. Economic potential
Baseline prevalence of clean fuels or devices is often a reasonable predictor of clean fuel uptake [17–20]. We use the percent of homes using LPG as a main cooking fuel in each village or town as an economic indicator, assuming that areas with low uptake of LPG have economic limitations to reducing reliance on solid fuels, even when programs to promote clean fuels or devices are available. As a baseline assumption, we assume that economic limitations are in play when a village or town has less than five percent of homes using LPG. We also explore sensitivities to the five-percent assumption.
2.3. Distribution of benefits
We explore how emissions are distributed across wealth categories in the population. To perform these analyses, we constructed a village-composite wealth quintile index based on amenities and assets data from the 2011 Village Level Indian Census [22]. There is no consensus on the variables that best measure wealth at the village level. Eight variables commonly used in macro-level economic development indicators were included: percentage of houses with landline phones only, percentage of houses availing banking services, percentage of houses with treated tap water, percentage of houses with electricity, percentage of houses with concrete roofs, percentage of houses using LPG/pipelined natural gas for cooking, percentage of houses having latrine facilities within premises and percentage of houses with waste water outlet connected to closed drainage. For each variable, a village was assigned a rank of 1–5 based on the percentage quartile (1: <20%, 2: <40%, 3: <60%, 4: <80%, 5: ⩽100%). Finally, an average of the eight scores was calculated for each village and mapped to polygons from the IVGD dataset. Additional background on the constructed wealth index can be found in the supporting information.
3. Results and discussion
3.1. Spatial distribution of household emissions
Energy service requirements and fuel use characteristics that drive high household emissions are not uniformly distributed across the country or region, suggesting that the implementation strategies should adjust to local needs and conditions. Figure 2 shows the spatial distribution of fuel use characteristics and annual primary PM2.5 emissions from various energy services based by village-level energy use characteristics. These figures capture the heterogeneity in energy service characteristics and an indication of their contribution to national emissions. While the prevalence of biomass use for cooking is evenly dispersed across the country, fuel-based lighting is heavily concentrated in the Gangetic Plain, where many households rely on dung in addition to wood for cooking. The prevalence of LPG use for cooking has a strong correlation with urban proximity, although this relationship is variable across regions, being most pronounced in the South.
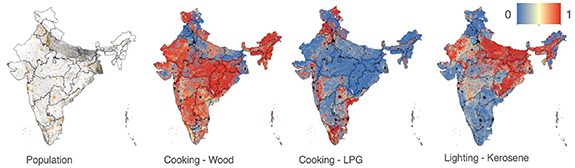
Figure 2. (Top row) Population and proportion of households reporting wood and LPG as a primary cooking fuel, and kerosene as a primary lighting.
Download figure:
Standard image High-resolution imageThirty percent of the towns and villages in India account for three-quarters of the residential PM2.5 emissions in the country; half of these locations are in the Gangetic Plain. Attribution of cooking emissions is similar to that of total emissions in the country, with roughly three-quarters of primary PM2.5 emissions being generated in less than one third of towns and villages. Three-quarters of the PM2.5 from space heating emissions are attributed to 12% of the country's villages, with 80% of these areas located in either the North, Gangetic Plain, or Northwest.
In the population image, darker cells depict rural areas with higher populations and orange areas urban localities, as defined by the Census of India. For the fuel figures, blue cells represent a lower proportion of household reporting use of each fuel, and red a greater proportion of households. Urban areas on fuels figures are shown in black.
Figure 3 shows cumulative population and cumulative emissions as distance increases distance from urban areas. Annual PM2.5 emissions for residential energy services in India is estimated at 2990 Gg, which is within 10% of those by Pandey et al (2803 Gg y−1) and Purohit et al (3003 Gg y−1) [3, 14]. Nearly half of baseline PM2.5 emission is attributable to populations living in urban areas and villages within seven kilometers of urban areas. This feature exists because of high population density, rather than a large dependence on solid fuel. As the distance from urban areas increases, decreasing population density is offset by an increasing proportion of solid-fuel dependent households.

Figure 3. Cumulative population in various areas, and cumulative primary PM2.5 emissions for all areas and all energy services, as a function of distance from urban areas (urban = 0 km). Maps at the top show areal coverage corresponding to different distances from urban areas in pink.
Download figure:
Standard image High-resolution imageIf all households in areas not using clean fuels transition to clean fuels for all their energy service needs, one-fifth (20%) of the residential primary PM2.5 emission reduction would be achieved in urban populations. The distributional potential depends on the distance of effective program reach. Reductions increase to 40% if programs reached 5 km outside of urban centers, and to 70% by 10 km. The 70% reduction at 10 km affects approximately 70% of the total population.
There is regional variation in the distributional potential (figure 4). Across the seven sub-regions of India, areas designated as urban account for 10%–60% of the reduction potential. Among regions that would be least affected by urban transitions is the Gangetic Plain, the single largest regional contributor to residential emissions in India, accounting for over half of all baseline primary PM2.5 emissions. Transitioning urban households in the Gangetic Plain would account for only 9% of the theoretical potential in the region, and 4% of the national potential, so significant overall reductions there require reaching rural homes. In contrast, urban-only transitions in the South would account for 30% of the reduction potential in that region, while contributing a similar amount to the national reduction as urban transitions in the Gangetic Plain (3.9%).
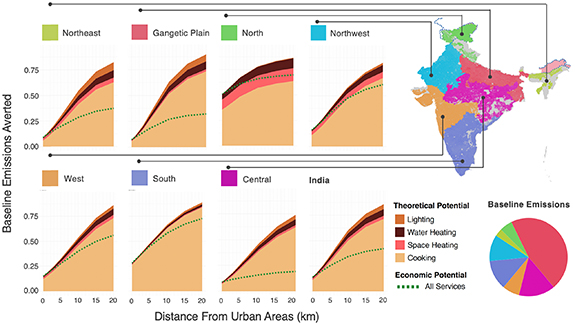
Figure 4. Primary PM2.5 distribution potential for residential emission reductions in India, as a function of distance to urban areas. Area plots reflect a complete transition, with colors differentiating the contribution of each energy service, showing one facet of technical potential. The green dashed line corresponds to the reduction potential when villages and towns with fewer that 5% of households reporting LPG as a main cooking fuel do not to transition to clean fuels or devices. The pie chart shows the fraction of national baseline primary PM2.5 emissions attributable to each region.
Download figure:
Standard image High-resolution imageAs with urban areas, the distributional potential as a function of distance from urban centers varies across regions, as shown in figure 4. Extension of programs to 5 km beyond urban centers would achieve 35%–80% of the theoretical potential, depending on the region, addressing the least in the Gangetic Plain (37%) and Northeast (36%), and the most in the North (78%) and South (54%). By 10 km of program extension, distribution reduction potentials are 63%–90%, being lowest in the West and highest in the North.
3.2. Technical potential and energy services
Displacement of polluting devices depends in part on how well replacement technologies satisfy existing energy needs. Cooking is a major energy requirement, but it is not the only energy service met by biomass-fueled devices. Figure 4 distinguishes the contributions of cooking, water heating, space heating, and fuel-based lighting to total emissions as a function of distance from urban area. Over 70% of the theoretical PM2.5 emission reduction potential at the national level would be realized through complete cooking service transitions; this figure varies by region (60%–85%). Lighting, space heating, and water heating account for the remainder of the theoretical potential—in total, 30% of national emissions, varying from 15% to 40% among regions. Space heating and water heating activities are temperature dependent, and their importance is greater during cooler months; this variation does not appear in annualized values in figure 4. Trends with distance from urban areas do not change substantially within each region. Although non-cooking emissions constitute only 30% of the total, they may have a greater influence on technical potential by affecting household choice; people may not transition their cooking devices if alternatives do not provide all household services.
3.3. Economic reduction potentials
Even if clean fuel-stove combinations can be distributed (distribution potential) and meet household needs satisfactorily (technical potential), they are taken up only when economically accessible. As noted earlier, we use the percentage of homes using LPG as a primary cooking fuel as an indicator of clean fuel-device accessibility. The dashed lines in figure 4 depict economic potential in reductions if less than 5% LPG use within a town or village indicates that reductions are economically unviable there. Under this more conservative scenario, the economic potential is far lower than the theoretical potential in several regions, especially for locations further from urban centers. Within 20 km of urban areas, the economic potential using these assumptions is 40% lower than the national distributional potential within 20 km of urban areas; regionally this limitation ranges from 10% to 65%. Economic potential differs least from theoretical potential in the North and South, and most in the Gangetic Plains and the Northeast.
Acknowledging that the cutoff value of 5% for homes using LPG is an uncertain indicator of economic potential, we also examine the sensitivity of emission reductions to this constraint in figure 5. The x-axis is the percentage of LPG uptake assumed to indicate economic ability to achieve reductions, and theoretical reduction potential is shown by the maximum height at x = 0, corresponding to the assumption that transitions are economically possible even when a town or village has no current LPG uptake. The height of the colored area at each value of LPG indicator shows the fraction of emissions that would be reduced if that value were used as an indicator. Thus, the sensitivity of economic potential to this indicator is shown by the slope of each profile. Wide profiles indicate that economic potential are more robust (less sensitive) to changes in the LPG indicator. The sensitivity to economic constraints varies regionally, and nationally-averaged patterns do not capture this diversity. The Gangetic Plain and Northwest regions, for example, have a similar degree of relative reduction potential (height), but the Gangetic Plain exhibits a narrower profile indicating greater sensitivity to the LPG constraint parameter. Color layers depict the incremental impact of distribution potential surrounding urban areas. Economic potentials in urban areas are relatively robust to the LPG indicator and deviate more from theoretical potentials in rural areas.
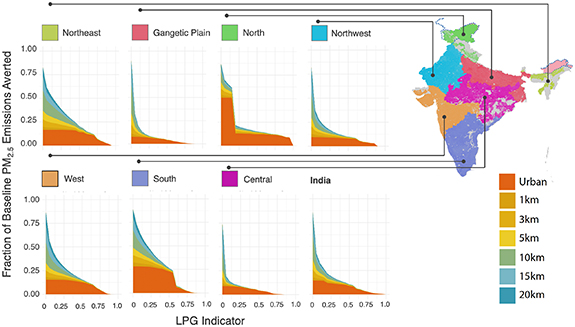
Figure 5. Sensitivity of economic reduction potential to assumptions about access indicators. All energy services except lighting are assumed to transition to clean fuels and devices with LPG-equivalent emission characteristics when a town or village can afford them, and that affordability is approximated by the fraction of households in that town or village using LPG as a primary cooking fuel in 2011 (LPG indicator). The height of each area (y-axis) indicates the fraction of baseline emissions averted for each value of constraint cutoff. Increasing the constraint cutoff means that fewer villages or towns can achieve access. Colors show the contribution of villages or towns at successive distances from urban areas.
Download figure:
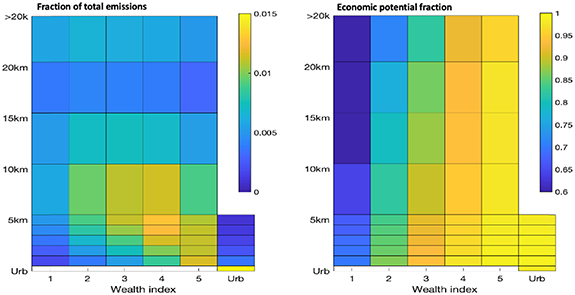
Standard image High-resolution imageFigure 6 is a summary of how towns or villages with different aggregate wealth indices are affected by emissions and reductions. The greatest aggregate emissions occur in the top two wealth quintiles near urban areas (left panel), and there are also substantial emissions between 5 and 10 km distance in the middle quintile. The right panel estimates the economic reduction potential using the 5% LPG indicator as a proxy. Almost all towns or villages in the highest wealth quintile pass the 5% LPG indicator, regardless of distance from urban areas. The economic potential drops from nearly 100% to about 60% for towns or villages in the lowest wealth quintile, and economically-limited programs have the lowest impact in areas farthest from urban areas. As shown in previous sections, economic potential decreases with distance from urban area, but the wealth index has a stronger effect.
Figure 6. Spatial and economic distribution of baseline emissions (left) and economic reduction potential (right). Wealth quintiles range from lowest (1) to highest (5). Units of left graph are fraction of baseline emissions per kilometer distance from urban areas in each wealth quintile, except that emissions beyond 20 km are distributed among 20–25 km. Right graph shows the fraction of baseline emissions that would be reduced under the assumption that economic potential for uptake of clean fuel or technology is indicated by greater than 5% LPG use for cooking. Urban emissions are portrayed separately because census data for urban areas does not include the information that underlies the wealth index.
Download figure:
Standard image High-resolution image
3.4. Study limitations
In this study, we explored characteristics of villages and towns to demonstrate how distributional, technical, and economic reduction potentials might differ from theoretical potentials for programs that provide low-emitting household energy. These proxies were inferred based on associations with uptake of clean fuels and devices. Because factors governing uptake are not fully understood, nor are data available to describe all relevant factors, so, this analysis should not be treated as absolutely predictive. Instead, its purpose is to demonstrate and stimulate discussion on practical bounds to emission reductions, using terminology that is already common among analyses of renewable energy. Our decisions not to include market potentials in this analysis also represents a limitation of our analysis.
4. Conclusion
Projected welfare improvements from measures to reduce high emissions from households often rely on emission inventories that describe current energy use and establish baselines to estimate future transitions. Understanding of how cleaner practices can mitigate high emissions, however, is only partially described by technical performance. Factors such as distribution, service matching, and economic access affect use and adoption of clean fuels and devices, and displacement of polluting practices. In this study, we described limitations to achieving theoretical reduction potentials in terms of spatial accessibility (distribution potential), service matching (technical potential), and access (economic potential). We developed a high-resolution baseline emission inventory of pollutants emitted from household uses by integrating census data. We then explored these emission reduction potentials for the health-damaging pollutant PM2.5 by considering demographics and energy use characteristics of households and villages. Using LPG uptake as a proxy for the likelihood of using clean fuels and devices, we show that distributional and economic reduction potentials are most greatly limiting in areas that contribute the most to national emissions. These areas would experience the largest benefits from shifts to clean fuels and devices, but also require the most attention to overcoming inherent limitations of access. The development of emission representations that account for services and factors affecting program uptake may provide more realistic and detailed estimates of program benefits and risks. Such representations may also provide greater value for informing effective implementation strategies, by allowing for more targeted programs and allocation of resources.
Acknowledgments
This research was supported by a Grant from the U.S. Environmental Protection Agency's Science to Achieve Results (STAR) program through Award Numbers EPA RD-83542301 and RD-835425. T C B acknowledges support from a Leverhulme Visiting Professorship at the University of Leeds. V G was supported by Grants for training support (T32 HD091058) and for general support (P2C HD050924) at the Carolina Population Center. We are appreciative of the feedback of Chandra Venkataraman and Manish Desai on earlier drafts of the manuscript.
Data availability statement
The data that support the findings of this study are openly available at the following URL/DOI: 10.6084/m9.figshare.22191721.
Supplementary data (0.7 MB DOCX)