

Abstract
Understanding contributions of climate and management intensifications to crop yield trends is essential to better adapt to climate changes and gauge future food security. Here we quantified the synergistic contributions of climate and management intensifications to maize yield trends from 1961 to 2017 in Iowa (United States) using a process-based modeling approach with a detailed climatic and agronomic observation database. We found that climate (management intensifications) contributes to approximately 10% (90%), 26% (74%), and 31% (69%) of the yield trends during 1961–2017, 1984–2013, and 1982–1998, respectively. However, the climate contributions show substantial decadal or multi-decadal variations, with the maximum decadal yield trends induced by temperature or radiation changes close to management intensifications induced trends while considerably larger than precipitation induced trends. Management intensifications can produce more yield gains with increased precipitation but greater losses of yields with increased temperature, with extreme drought conditions diminishing the yield gains, while radiation changes have little effect on yield gains from management intensifications. Under the management condition of recent years, the average trend at the higher warming level was about twice lower than that at the lower warming level, and the sensitivity of yield to warming temperature increased with management intensifications from 1961 to 2017. Due to such synergistic effects, management intensifications must account for global warming and incorporate climate adaptation strategies to secure future crop productions. Additional research is needed to understand how plausible adaptation strategies can mitigate synergistic effects from climate and management intensifications.
Export citation and abstract BibTeX RIS
1. Introduction
The growing demand for food, fiber, and biofuels worldwide requires major crop production regions such as the United States to continuously increase crop production as in the last decades. Maize yields in the US have been firmly rising during approximately the previous 80 years (Duvick 2005, Kucharik and Ramankutty 2005, Egli 2008). They have become a determinant factor in the changes in the supply, demand, and prices of different crops worldwide (Roberts and Schlenker 2013). As climate change threatens the continuation of these increasing trends, much attention has been paid to understanding how changing climate influences historical crop yield trends (Doering et al 2002, Lobell et al 2013, Bassu et al 2014, Butler et al 2018).
While several studies (Rizzo et al 2022) indicate that climate is the most critical factor affecting the yield trend, others (Duvick 2005, Lee and Tollenaar 2007) suggest that it has a negligible contribution and that changes in management, including improved genetics and technology, explain most changes. Previous studies also indicated that the climate effects on yield trend differed by temperature, radiation, and precipitation (Lobell and Asner 2003, Lobell et al 2013, 2014, Basso and Ritchie 2014, Tollenaar et al 2017). Lobell and Asner (2003) estimated that approximately 25% of the yield trend between 1982 and 1998 was associated with temperature changes, while precipitation did not have a measurable impact. More recently, Lobell et al (2013, 2014) reported that vapor pressure resulting from higher July temperatures had been the main factor for maize yield reduction in the last decades. However, Basso and Ritchie (2014) consider that the importance of temperature and VPD in yield reduction has been overstated and that soil water deficits mainly driven by the within-season rainfall variability are the main factor. Meanwhile, Tollenaar et al (2017) reported that the contribution of solar radiation has been underestimated and that approximately 27% of the trend between 1984 and 2013 is due to changes in solar radiation. The discrepancy of previous studies can be attributed to differences in the scale and resolution of climate and agronomic observation data (Grassini et al 2015), the model type (Lobell and Asseng 2017), and the methods of quantifying and comparing the impacts (Lu et al 2017), which often neglect interactions between the climate and management (He et al 2015). In addition, most of these studies are based on statistical methods, which performed regressions between climate factors and yields, causing the estimated crop yield trend revealed by these studies only the climate-induced crop yield trend instead of actual crop yield trend, as discussed in recent studies (Xiao et al 2014, Bai et al 2016, Guo et al 2022, Yu et al 2022, Zhu et al 2022). Therefore, the contributions of climate and management to crop yield trends remain unclear.
To resolve the discrepancy, we quantify the synergistic contribution of climate factors (i.e. temperature, precipitation, and solar radiation) and management factors (i.e. genetics and agronomic factors) to the decadal and multidecadal trends of maize yields in the middle of the US corn belt (i.e. Iowa) during 1961–2017 using process-based modeling approach with a detailed climatic and agronomic observation database. We aim to answer the following questions: (a) How much do management intensifications and climate factors contribute to yield trends from 1961 to 2017? (b) How do management intensifications influence climate-driven yield trends, and vice versa, and how does climate influence management intensification-driven yield trends? (c) What would be the synergistic effects of warming and management intensifications on yields? Our approach simulates significant changes in management conditions over 57 years and explicitly accounts for the effects of the interactions between climate factors and management intensifications. The analysis is based on observed climate and agronomic data from 1961 to 2017, with a well-calibrated and validated dynamic crop simulation model incorporating management intensifications into model parameterizations. Iowa's rainfed maize production system provides an ideal context to provide a quantitative understanding of the synergistic contributions of climate and management intensifications to yield trends in the past and different warming levels.
2. Methods
2.1. Study area and model formulation
Iowa is around the middle of the U.S. Corn Belt, which has an area of about 14.5 million ha, of which 86% is cropland. It had commonly ranked first in the US corn productions over the last decades, accounting for above 15% of the annual totals (USDA 2020). As in many other states of the Corn Belt, maize in Iowa is usually planted in April or May and harvested between October and November, mostly under rainfed conditions. We used the decision support system for agrotechnology transfer CERES-Maize model (Jones et al 2003) to simulate annual maize yields for each county of Iowa over six decades, from 1961 to 2017. The model simulations explicitly account for changes in management, cultivars, climate, and CO2 concentration. The climate and agronomic data used in this study are introduced in the supplementary information.
The process-based crop model was calibrated at each cluster including multiple counties (see SI Supporting text), and the simulations were later aggregated to obtain state-level simulations. Specifically, we were interested in the crop model simulated yields  , with the model denoted by
  , based on a vector of inputs
  and a vector of, in principle unknown, parameters
  . The calibration was to find one or multiple sets of unknown genetic and soil model parameters that minimize the differences between the simulated and the observed county yields during some of the years. In addition, we designed a parameterization strategy that accounts for the explicit representation of the changes in management, both in space and time, within a Bayesian framework for parameter optimization. We assume that the genotype parameters vary in time and space, while the soil parameters vary in space but not in time. The generic genotype coefficients for calibration at any county are considered as changing linearly with time t. The calibration used 22 out of the 57 years' data, most of which were randomly chosen, with the other 35 years being used for validation. Details of the model calibration and validation are provided in the supplementary Information. The calibrated and validated model was then used to simulate and compare state-level yield assessments under actual and defined conditions.
2.2. Experimental designs and analysis
Using the calibrated model, we assessed the contributions of the different factors, including climate, temperature, solar radiation, precipitation, and management, to decadal and multi-decadal yield trends at the state level. We assess the trends and contributions during the entire period from 1961 to 2017 as a measure of the long-term impacts, during 1982–1998 and 1984–2013 to compare with the previous studies of Lobell and Asner (2003) and Tollenaar at al. (2017), respectively, and over each decade and multi-decades between 1961 and 2017. We evaluated the contribution of a factor by comparing the actual simulated yields (i.e. the simulated yields using the calibrated model considering the actual climate and management conditions every year) with the alternative simulated yields when the actual values of that factor were replaced with ones from other years. For example, to evaluate the climate contribution, we run the calibrated model for 1961 using the weather dataset from 1962, 1963, ... until 2017 at every county. Then we repeated the same run for 1962 using the weather data from the other years, and so on until the last year. After aggregating the county-level yields to the state level, we obtained a matrix of 57 × 57 yields, with the i, j element of the matrix being the yield under actual conditions in year  , except the climate factor, which is based on the weather records at year
  . The differences between columns of this matrix were induced by the factor of interest, the climate in this case, while the differences between rows were induced by non-climate factors, e.g. management. To evaluate the contribution of the management intensification to the yield trend, we simulated the yield when replacing both the daily records of the weather series and the annual record of CO2 concentration from the current year with the records from the other years and analyzed the differences between the rows of the resulting matrix. The supplementary information provides detailed information for assessing the contribution of the individual climatic variable and contribution of the climate and management factors to yield changes.
To understand the synergistic effects of warming and management intensifications, we assessed the changes in yields under different management conditions considering warming temperature following a systematic increase of 0.0343 and 0.0604 °C per year, which are equivalent to a rise of about 2.8 and 4.8 °C in 80 years, comparable to lower and higher warming levels in the US by the end of the century (Easterling et al
2017). To minimize the influence of historical patterns of inter-decadal variability (Henson et al
2017) and retain important patterns of inter-annual variability, we first permuted continuous decades of weather records randomly, starting from a typical randomly chosen year (say, the third year of every decade), and then imposed the increments in temperature to the rearranged series and simulated the annual yields using the incremented temperature series. We evaluated the changes in yields associated with the systematic increases in temperature considering five of these permutations. To assess the synergistic effects of warming and management, we evaluated the trends induced by temperature or climate change of the yield differences between the imposed warming and the baseline from 1961 to 2017:  for each of the replicas, by fixing the other climate factors or management according to the conditions of each of those year. The accent in
  indicates the value of the factor considering warming levels.
Results
3.1. Model simulations
Figure 1 shows the performance of the county-level and state-level calibrated model for the years included in the calibration and those excluded. The performance was good at both levels, but that at the state level was better than at the county-level for both calibration and validation, with the root mean squared error being about 0.2 Mg ha−1 lower and R2 being about 0.14 larger than the county level. This is likely because the county-level errors tend to be random, canceled out after aggregation to the state-level. The calibrated county-level yields underestimated the largest yields observed in recent years, while slightly overestimated the lowest yields. The estimations were particularly worse in 1993 than in the other years, with the estimated yields at the state-level being more than 2 Mg ha−1 larger than the observed yield (corresponding to the red dot far from the diagonal in figure 1(c)). Yields in 1993 were about 30% lower than in previous years because of the severe floods that occurred in the summer of that year.
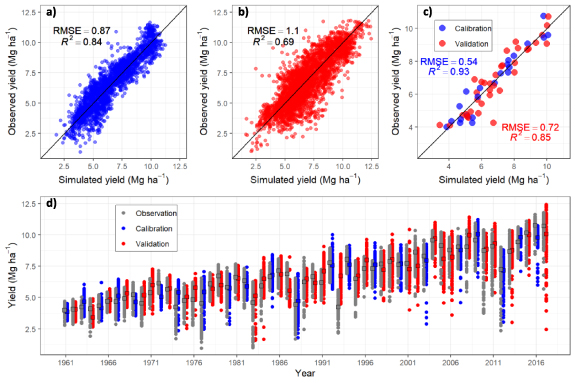
Figure 1. Scatter plot showing the simulated versus observed yields: (a) the county-level yields during the calibration years, (b) the county-level yields during the validation years, (c) the state-level yields during both calibration and validation years, and (d) time series of county (solid dots) and state (solid squares) level yield: observed (gray), simulated during calibration (blue), and simulated during validation (red). The diagonal in panels (a)–(c) represent the 1:1 line. The root mean squared error (RMSE) and the coefficient of determination (R2) are also included in those panels.
Download figure:
Standard image High-resolution image3.2. Contributions of climate and management to long-term yield trends
Figure 2 shows the changes in maize yields induced by climate and management factors as well as the contributions of these factors to yield trends from 1961 to 2017 as well as two subperiods: 1982–1998 and 1984–2013, corresponding with the study period of Lobell and Asner (2003) and Tollenaar et al (2017), respectively. The result shows that management intensification contributes to approximately 90%, 74%, and 69% of the yield trends from 1961 to 2017, 1984–2013, and 1982–1998, respectively, climate combined contributes to approximately 10%, 26%, and 31% during the corresponding periods. The contributions of climate factors to yield trends are significantly varied among the three periods, with the contribution during the entire period (1961–2017) being much smaller compared to the periods selected in previous prominent studies (1984–2013 or 1982–1998), suggesting the importance of decadal climate variability in determining yield trend.
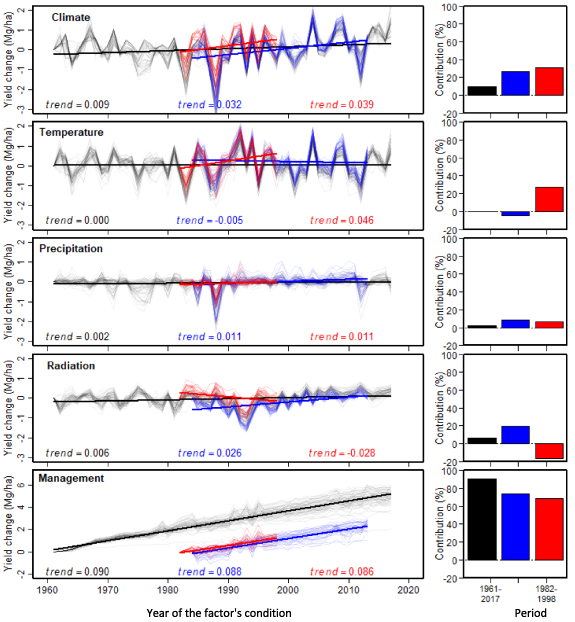
Figure 2. Thin lines in the left panels show the changes in yield (Mg ha−1) induced by the changes in (from top to bottom) climate, temperature, precipitation, radiation, and management over periods 1961–2017 (black), 1984–2013 (blue, as in Tollenar et al 2017) and 1982–1998 (red, as in Lobell and Asner 2003), with respect to the yield at the initial year of each period. Each thin line represents simulated yields along with a changing factor of interest over years assuming other factors constant under a condition of particular year. The thick straight lines are fitted from the thin lines based on a linear model. The trends (i.e. the slope of thick lines, in Mg ha−1 yr−1) for each period is included at the bottom. The panels on the right show the contribution of the different factors over each of the three periods.
Download figure:
Standard image High-resolution imageWe found that temperatures contributed to 27% of the yield trend from 1982 to 1998, coinciding with a period of decreasing temperature. It confirms the study of Lobell and Asner (2003), which suggested climate factors, especially temperature, had a significant contribution (25%) to the yield trend during this period. We also found that radiation contributed to approximately 20% of the yield trend from 1984 to 2013, coinciding with systematic increases in solar brightening. It corroborated the finding of Tollenaar et al (2017) showing that solar radiation has the most significant contribution (approximately 27%) among the climatic factors during this period. The result also showed that precipitation had a minor impact on yield trend compared to temperature and solar radiation, despite the significant increases in rainfall during the last three decades (Pryor et al 2009, Ford 2014, Mueller et al 2016).
3.3. Contributions of climate and management to decadal and multi-decadal yield trends
Figure 3 shows decadal yield trends driven by the climate and management factors over different subperiods from 1961 to 2021. The change in climate conditions during the first half of the study period mostly had negative impacts on yields associated with adverse changes in temperature-driven trend (figure 3(b)). In contrast, the change over the second half generally had positive impacts (figure 3(a)) associated with favorable changes in solar radiation driven trend (figure 3(d)). The opposite impacts of the climate during the first decades and the last decades resulted in only a slight contribution of climate to the long-term yield trend over the entire period (figure 3(a)), suggesting nontrivial effects due to the choices of study periods. It is worth noting that the yield trends induced by temperature and solar radiation changes were, in size, comparable and considerably more significant than those attributable to precipitation (figure 3(c)) and lower than those attributable to management (figure 3(e)). However, they often differed in direction, meaning that they frequently caused counteractive effects on yields. On average, the increase of 1 °C (1 W m2) of the summer temperature (radiation) during the different decadal and multidecadal periods (figure 4) led to a decrease (increase) in yields of 0.35 (0.033) Mg ha−1 (figure 3). Similarly, the increase of 100 mm in the summer precipitations (figure 4) led to an increase in yields of 0.05 Mg ha−1 (figure 3).
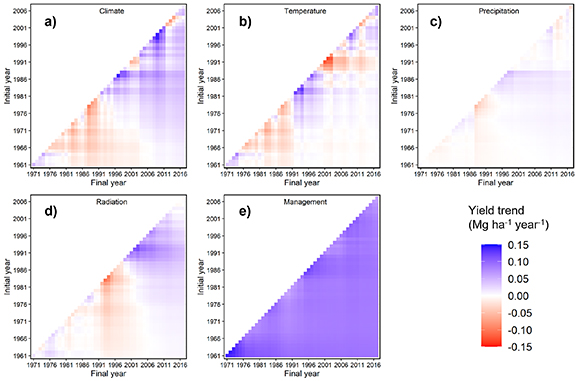
Figure 3. Heat maps showing the yield trend along with a changing factor (with each factor indicated at the top of each panel) between an initial (y-axis) and a final year (x-axis). The trend represents the slope of the fitted linear equation of the changes in yield with time.
Download figure:
Standard image High-resolution image
Figure 4. Top panel shows the changes between 1961 and 2017 of the mean June–August (a) air temperature, (b) incident solar radiation, and (c) total precipitations averaged over the state. The blue line represents the fitted linear equation over the entire period. The heat maps in the bottom panel shows the trend (i.e. the slope of the fitted linear equation) of the mean June–August (d) temperature, (e) solar radiation and (f) precipitation averaged over the state for periods of more than decade from an initial (y-axis) and a final (x-axis) year.
Download figure:
Standard image High-resolution imageThe trends driven by solar radiation showed lower interdecadal variability than those driven by temperature. The radiation contribution includes a prolonged period of large and favorable impacts after the 1980s following the small or negative effects in previous decades due to the multidecadal climate variations (figure 4), consistent with the patterns of global dimming and brightening (Wild 2009). The maximum decadal yield trend (in absolute terms) due to changes in temperature and solar radiation was about ±0.13 and ±0.11 Mg ha−1 yr−1, respectively, comparable to the maximum yield trend associated with management intensifications (approximately +0.14 Mg ha−1 yr−1), while considerably larger than the maximum trend due to changes in precipitation (approximately ±0.05 Mg ha−1 yr−1). This result suggests that temperature and radiation can play at least an equally important role as management in determining yield trends over a short period.
3.4. Synergistic effects of climate and management
Figures 5(a) and (b) show the yield trends driven by combined or individual climate factors from 1961 to 1991 and 1961–2017, respectively, considering constant management and other climate factors in different years. From 1961 to 1991, the temperature had a positive trend while the radiation and the precipitation experienced little change (figure 4). The yield trends driven by different climate factors were always negative and substantially decreased with management intensification throughout the years (figure 5(a)). For example, the reduction in yields considering management conditions in 1991 was about six times greater than those in 1961 for the same increase in temperature. Unlike 1961–1991, during 1961–2017, the temperature showed almost no trend while precipitation and solar radiation increased (figure 4). The climate-driven yield trends were all positive or close to zero. They increased with management intensifications over time, with the precipitation-driven trend showing a strong positive effect from management intensification while the radiation-driven trend showed little effect. These results suggest that management intensifications can induce more yield gains with increased precipitation, but greater losses of yields with increased temperature, and radiation changes have little effect on yield gains from management intensification.
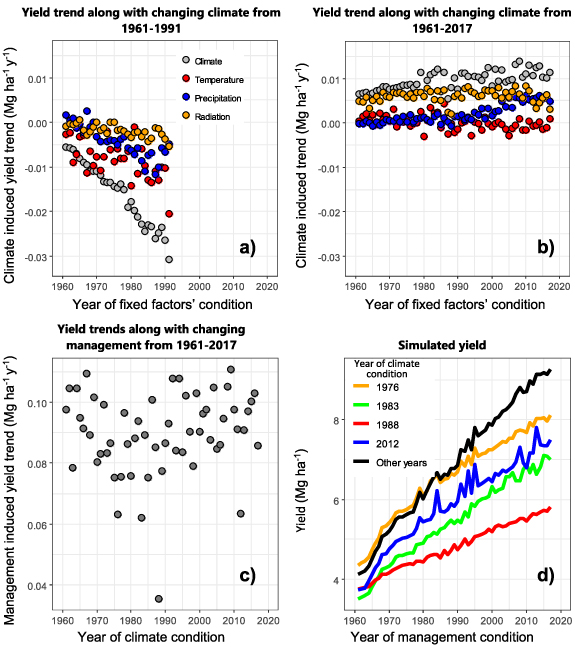
Figure 5. Plots (a)–(c) represent the yield trend induced by the changes in individual or combined climate factors (a), (b) and management (c) from 1961 to 1991 (a), and from 1961 to 2017 (b), (c), assuming other factors constant under the conditions of the year indicated in the x-axis. Plot (d) shows the simulated yields using the changing management conditions from 1961 to 2017 (as indicated in the x-axis) and the climate conditions in 1976, 1983, 1988, and 2012 (the extreme drought years). It also shows the average of the simulated yields using the changing management conditions from 1961 to 2017 and the climate conditions in all the other years.
Download figure:
Standard image High-resolution imageIt is also worth noting that yield gains due to management intensifications were considerably diminished under drought conditions (figure 5(c)). For example, in 1988, a year with severe drought, the management-induced yield gains were the lowest (+0.035 Mg ha−1 yr−1) from 1961 to 2017. The yield under the 1988 extreme drought (the most severe drought) and 1961 management (the lowest intensification) conditions were comparable and even better than the yields under management conditions over other years while increasing management intensification from 1961 to 2017 exacerbated the drought impacts (figure 5(d)). Similarly, under the climate conditions of 1983, 1976, and 2012, the years with severe droughts, the yield gains due to management intensifications were also low (between +0.062 and +0.064 Mg ha−1 yr−1).
3.5. Synergistic effects of warming and management intensifications
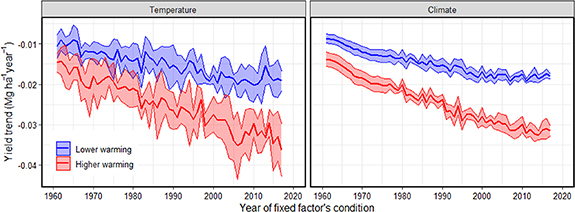
Projections show that the Midwest summer temperatures will increase more than in many other regions of the U.S (US Global Change Research Program 2017). Figure 6 shows the trends of yield differences between baseline and imposed warming at two different levels along with changing temperature or combined climate factors from 1961 to 2017. All the trends are negative while considerably decreased with the intensification of management from 1961 to 2017, with those under the higher warming levels decreasing more than those under the lower warming levels. The between-replication variability of the trends were similar under different scenarios and management intensification levels. However, the variability of the temperature-induced trends was greater than that of the climate-induced trends because temperature-induced trends were calculated using constant precipitation and solar radiation records over years for each replication, while these records showing great variations between replications.
Figure 6. Average (thick lines) and 95% confidence interval (shaded area) of temperature- (left panel) and climate-induced (right panel) trends of the yield difference between the baseline and the imposed lower and higher warming levels, assuming the other factors constant under the conditions of the year indicated in the x-axis. Each realization within the shaded area in the plot is a replication associated with one random permutation of the decadal weather records.
Download figure:
Standard image High-resolution image
Under the management condition of recent years, the average trend at the higher warming level was about twice lower than that at the lower warming level, and the sensitivity of yield to warming temperature increased with management intensifications from 1961 to 2017. It is worth noting that while the yield gains from intensification decreased at imposed warm levels (figure 6), management intensification provided increased yields under any climate conditions (figures 2–5). In other words, yields in warmer conditions increased with management intensification, but to a lesser extent. Under the imposed lower and higher warming levels, the trends along with management intensifications from 1961 to 2017 under the constant 1988 climate condition (the extreme drought year) were +0.034 and +0.032 Mg ha−1 yr−1, respectively, lower than the original condition without warming. The simulated losses from this study due to warming are comparable to previous studies (Brown and Rosenberg 1999, Mearns et al 2001) based on process-based crop simulation models, while lower compared to previous empirical model-based studies (Schlenker and Roberts 2009, Urban et al 2012) regardless of the warming levels.
4. Discussion
Temperature contributions to yield trends were often comparable to radiation and much greater than precipitation. While climate contributions to yield trends are very small because of the contrasting temperature trends over different subperiods (Basso et al 2021), they changed considerably over time, with the increases (decreases) in temperature leading to considerable decreases (increases) in yield. As pointed out in previous studies (Schlenker and Roberts 2009), the high sensitivity of the yields to temperature change makes this factor especially prone to cause future declines in productivity, even if its contribution to the 1961–2017 trend was practically negligible. While the Midwest experienced a slight decrease in the maximum temperatures during the second half of the 20th century and the beginning of the 21st century (Basso et al 2021), studies indicate that summer temperatures will increase in this region more than in many other US regions. Yield trends also show great sensitivity to radiation. The large contributions from radiation demonstrate that they have been overlooked, as also indicated by Tollenaar et al (2017). However, the study shows that radiation has attenuated impacts since the 21st century, coinciding with the relative dimming from the beginning of this century (Hatzianastassiou et al 2020). Since this condition would persist for the next decades (US Global Change Research Program 2017), the long-term contribution from radiation to yield will be likely small.
We found that decadal variations of temperature and radiation can play at least an equally important role as management in determining decadal yield trends, which are likely driven by decadal climate variability, as suggested by previous studies (Tian et al 2015, Schillerberg et al 2019, Schillerberg and Tian 2020). Notice that during the period from the beginning of the 1980s to the end of the 1990s, same as the study period of Lobell and Asner (2003), temperature impacts were more favorable than in any other period. Similarly, from the 1990s to 2010s, same as the study period of Tollenaar et al (2017), the impacts of radiation were more favorable than in any other period. These decadal changes in yield may be manifested as a favorable trend over shorter study periods as in Lobell and Asner (2003) and Tollenaar et al (2017), while the conclusion of how climate affects yield trends is heavily influenced by the choices of the study period.
We also found significant interactions between the management intensifications and climate factors that influence yield trends. The increase in temperatures over subperiods such as between 1961 and 1991 led to decreased yield trend with more intensive management causing greater yield reductions. The decrease is most likely a consequence of a strong linkage between the changes in temperature, management, and water availability in rainfed areas of the Corn Belt. The continued intensification, such as increasing planting density, has increased per se the crop water needs in these areas, in which the changes in temperature largely drive the variability of the water supply and demand (Hobbins 2016). It thus caused crop water deficits due to the temperature increases and thus led to yield reductions (Basso and Ritchie 2014, Schauberger et al 2017). Other management intensification practices, such as earlier planting (US Global Change Research Program 2017), which has been accompanied by a lengthening of the crop season and the increasing of the growing degree days during specific stages (Sacks and Kucharik 2011), may further increase water demand and result in more significant crop water deficits in a warming temperature.
The precipitation-induced yield trends were also sensitive to management intensification. While the trends between 1961 and 2017 were on average low, they increased linearly with the intensification from the end of the 1990s onward. This is likely because cropping intensification increases the water use efficiency (Farahani et al 1998), meaning that more water is used for evapotranspiration rather than being lost in unproductive forms such as evaporation or percolation. Therefore, the effects of precipitation on yields may be augmented under future projected precipitation (Easterling et al 2017, Wuebbles et al 2017) and management (Egli 2015, Licht et al 2019) scenarios. Easterling et al (2017) found that increases in total and extreme spring precipitation over most northern regions of the United States are highly probable. Wuebbles et al (2017) found that reductions in the summer precipitation are moderately probable. Meanwhile, findings from Egli (2015) and Licht et al (2019) suggest that increasing planting density (as a management intensification strategy) are needed to increase yields. Under any of these projected future scenarios, precipitation will most likely have contributions larger in magnitude to future yield trends than during the previous decades from 1961 to 2017.
While management intensifications always lead to yield gains under any climate conditions, drought conditions considerably diminished those gains, with the reductions being exacerbated under the imposed warming levels. This result suggests that the maize yield in this region has become more sensitive to drought because of the intensification, which agrees with the previous empirical studies (Lobell et al 2014, Mueller et al 2016). It is most likely because of warming temperature during drought, combined with more intensive management, increasing water demands and leading to more significant water deficits and greater damages (Mueller et al 2016). There are strong synergistic effects on yield trends from management intensification and changing climate factors, with management conditions considerably affecting the sensitivity of the maize yields to changes of climate factors and drought, particularly under imposed warming levels. At the same time, climate conditions also affect yield gains from management intensifications. To secure future crop production in a warming climate, management intensification practices such as increasing plant population and reducing row spacing (Egli 2015, Licht et al 2019) need to be accompanied by climate adaptation strategies such as cultivating and adopting heat and drought-tolerant crops (Cooper et al 2014, Gaffney et al 2015, Messina et al 2015).
Finally, there may be uncertainties in this study due to the lack of actual management data, which makes the separation of the climate and management contributions to yield trends especially challenging. While we simulated changes in management along with time using the yearly model calibration strategy, the calibrated parameters cannot be verified with actual records. Thus, we only indirectly verified that by comparing our estimations with those from prominent studies relying on different modeling approaches, finding a very good consistency. Uncertainties may also arise from the use of process-based crop models, especially due to their limitation for capturing the yield loss under extremes events, such as excess rainfall (Li et al 2019, Liu et al 2022) and waterlogging (Liu et al 2020).
5. Conclusion
In this study, we assessed the contributions of climate factors (including temperature, precipitation, and solar radiation) and management intensifications to multidecadal or decadal trends in maize yields over six decades (1961–2017) using a process-based crop modeling framework with a database constructed from various climate and agronomic observations. The results show temperature (radiation) contributes to 27% (20%) of crop yield trends during 1982–1998 (1984–2013). Management intensifications contribute to approximately 90%, 74%, and 69% of the yield trends from 1961 to 2017, 1984–2013, and 1982–1998, respectively. Climate contributions to yields are smaller over the subperiods during 1982–1998 or 1984–2013 and even smaller over the entire long-term period from 1961 to 2017, suggesting that the large and consistent increments in yields have been mainly a consequence of management intensifications. However, climate contributions to yield trends have been changing significantly over time, showing strong decadal or multi-decadal variations, with temperature and radiation showing counteractive effects over several decades, while the impacts due to multi-decadal or decadal climate fluctuations were manifested as trends in previous prominent studies that covered a shorter period (Lobell and Asner 2003, Tollenaar et al 2017). Climate and management showed significant synergistic effects, with precipitation increments causing yield gains under more intensive management conditions and warming temperature or extreme drought conditions dramatically decreasing yield gains from management intensifications. Under the management condition of recent years, the average trend at the higher warming level was about twice lower than that at the lower warming level, and the sensitivity of yield to warming temperature increased with management intensifications from 1961 to 2017. Additional research is needed to understand how plausible adaptation strategies can mitigate synergistic effects from climate and management intensifications.
Acknowledgments
This work is supported in part by the National Science Foundation CAREER award (EAR-2144293), the National Institute of Food and Agriculture (NIFA) Foundational and Applied Science program (USDA-2019-67021-29937), and NIFA Hatch program (Accession No. 1012578).
Data availability statement
The data that support the findings of this study are openly available at the address: https://osf.io/wjx8b/.
Supplementary data (3.3 MB DOCX)