

Abstract
Arctic winter daily warming events have sparked growing interest, particularly in recent years, when Arctic daily temperatures have approached melting point several times. This analysis reveals that the impact of the El Niño-Southern Oscillation (ENSO) on the frequency of Arctic daily warming events experienced an obvious change around the late 1970s, which may be attributed to changes in ENSO intensity. Since the late 1970s, due to stronger ENSO intensities, ENSO has induced a stronger Rossby wave; then, El Niño (La Niña) has deepened (weakened) the Aleutian Low and strengthened anomalous northerlies (southerlies) over the North Pacific, thereby decreasing (increasing) the frequency of Arctic daily warming events. In contrast, before the late 1970s, the ENSO did not have an apparent direct impact on the frequency of Arctic daily warming events due to its weaker intensity. Our findings provide a potential relationship between the equator and the Arctic to improve the prediction accuracy of extreme Arctic daily warming events. By analyzing Coupled Model Intercomparison Project phase-6 models, we confirm that the potential relation may be strengthened under the global warming scenario.
Export citation and abstract BibTeX RIS

Original content from this work may be used under the terms of the Creative Commons Attribution 4.0 license. Any further distribution of this work must maintain attribution to the author(s) and the title of the work, journal citation and DOI.
1. Introduction
Arctic warming has always been the focus of attention because of its significant impact beyond local weather and climate (Screen and Simmonds 2010, Francis and Vavrus 2012). In particular, in late December 2015, the near-surface air temperature at the North Pole soared by more than 25 °C in just 24 h, owing to huge warm and humid air masses being transported into the Arctic by an intense storm (Boisvert et al 2016, Moore 2016). Extreme daily warming events have not only attracted the attention of scholars but also that of society. Similar warming events have sometimes been observed by ocean buoys and drifting stations in the Arctic (Graham et al 2017). Against the normal Arctic winter temperature of below −30 °C, daily temperatures above −10 °C in winter, even surprisingly near 0 °C, have occurred many times in the polar region (Moore 2016, Graham et al 2017), meaning that the daily temperature increases considerably over a short period of time. These severe weather events cause great stresses on the sea ice and ecosystems of the Arctic (Hansen et al 2014, Tjernstrom et al 2015). It is widely acknowledged that extratropical cyclones from the Pacific Ocean are a main contributing factor to Arctic daily warming by bringing warm and moist air into the region and subsequently triggering multiple feedback mechanisms (e.g. Graham et al 2017). Furthermore, the motion of cyclones is closely related to the mean flow in the middle troposphere (Murray and Simmonds 1995, Zhu et al 2000, Hoskins and Hodges 2002, Pinto et al 2005). Thus, due to the steering airflow of cyclone movement, the southerly (northerly) anomaly in the middle troposphere could be a critical atmospheric background condition, steering an extratropical cyclone to move northwards into (or southwards without entering) the Arctic. In previous research, we defined a type of Arctic winter daily warming event triggered by a Pacific cyclone as Pacific pattern-Arctic rapid tropospheric daily warming (Pacific-RTDW) events (Wang et al 2019). One of our aims is to explore the necessary climatic conditions that allow such Arctic daily warming events to occur.
The tropical sea surface temperature anomaly (SSTA) may have significant impact on Arctic temperature anomalies by exciting poleward-propagating Rossby waves in the atmosphere (Ding et al 2014, Hu et al 2016). Thus, herein, we continue to explore the relationship between the frequency of Arctic daily warming events and El Niño-Southern Oscillation (ENSO), which plays a significant role in the worldwide weather and climate (e.g. Wang et al 2000). It is well established that the amplitude of ENSO has strengthened since the late 1970s (Lee and McPhaden 2010, McPhaden et al 2011). Arctic warming is particularly sensitive to changes in ENSO activity characteristics, which are attributed to various poleward atmospheric Rossby waves (Hu et al 2016, Li et al 2019).
It is worth noting that most previous studies have focused on the effects of ENSO on the Arctic seasonal average temperature. However, comparatively little attention has been given to the effects of ENSO on Arctic daily warming events. Furthermore, have these effects changed as a result of changes in ENSO activity? In the present study, the relationship between the occurrence frequency of Arctic daily warming events and ENSO will be investigated.
This paper is organized as follows: section 2 introduces the data and methods. Section 3 presents the results, including the characteristics of the Pacific-RTDW event in section 3.1, the interdecadal change in the relationship between ENSO and the occurrence frequency of Arctic daily warming events in section 3.2, as well as the possible mechanisms in section 3.3 and their relationship under historical and future scenarios by using Coupled Model Intercomparison Project phase-6 (CMIP6) models in section 3.4. Finally, section 4 concludes with a summary and discussion.
2. Data and method
2.1. Dataset and CMIP6 models
The National Centers for Environmental Prediction/National Center for Atmospheric Research (NCEP/NCAR) Reanalysis data is used in this study, which includes the daily and monthly air temperatures, horizontal winds, vertical wind velocities, and geopotential height with a spatial resolution of 2.5° latitude-longitude at the tropospheric level. Monthly sea surface temperature (SST) data with a horizontal resolution of 1° latitude-longitude is obtained from the Hadley Center sea ice and sea surface temperature dataset. We also use daily air temperature, horizontal winds, and monthly SST from eight CMIP6 models under historical simulation from 1950 to 2014 and three shared socio-economic pathway (SSP) based scenarios (SSP1-2.6, SSP2-4.5 and SSP5-8.5; Eyring et al 2016) from 2015 to 2100. Here, only one ensemble member ('rli1p1f1') run is used for each model. The basic information for the CMIP6 models is shown in supplementary table S1.
2.2. Definition of a Pacific-RTDW event
To better describe Arctic daily warming, we choose Pacific-RTDW events (Wang et al 2019) that satisfy the following two criteria, as follows: (1) over the Arctic region (66.5°–90° N), the daily increment anomaly of air temperature at 1000 hPa is greater than a standard deviation in the winters of 1950–2018; and (2) the daily warming event is triggered by the 1000 hPa southerly anomaly from the Pacific. In Wang et al's (2019) paper, the criterion of three standard deviations presents 13 °C daily warming and the number of extreme events is very small. In the present paper, using the criterion of one standard deviation, not only can these events catch the characteristics of the rapid warming over the Arctic but also enough events are identified to explore the relationship between the Pacific-RTDW and ENSO.
The daily 'increment anomaly' of air temperature  in the definition is obtained by a two-step calculation. First, the daily air temperature 'increment'
  is calculated as
  , where T is the daily air temperature, the superscript 'i' is the day of interest and 'i-1' is the previous day. Then, the daily air temperature 'increment anomaly'
  is expressed as
  , where the subscript 'mean' is the climatological mean of daily air temperature increments from 1950 to 2018 on that day of the year. For example, in order to calculate the air temperature 'increment anomaly' on 31 December 2000, the daily air temperature 'increment' on 31 December 2000 is obtained first by subtracting the daily air temperature on 30 December 2000 from the daily air temperature on 31 December 2000. Then, the 'increment anomaly' is calculated as the difference between the air temperature increment on 31 December 2000 and the average of the air temperature increments on every 31 December from 1950 to 2018. For convenience, Pacific-RTDW day −3 and day 0 denote 3 and 0 days before the occurrence of the Pacific-RTDW event, respectively.
The Pacific Ocean and the Atlantic Ocean are the two primary energy sources for Arctic warming (Overland and Wang 2016, Graham et al 2017). In addition to Pacific-RTDW events, the other Arctic daily warming events that meet the first criterion above are Atlantic pattern Arctic rapid tropospheric daily warming (Atlantic-RTDW) events. Events are classified as Pacific-RTDW events according to the second criterion by using the fuzzy c-means method (FCM; Fujibe 1989, 1999), which is a classification method and does well in classifying representative patterns. Moreover, the number of clusters is equal to 2 and other parameters are defaulted when the FCM is used. Given that the Atlantic Ocean is the other primary energy source for Arctic warming (Graham et al 2017, Wang et al 2019), the Atlantic-RTDW event is also important for Arctic daily warming events and will be examined in future work. In the present paper, we focus on Pacific-RTDW events.
2.3. Definition of the Pacific-RTDW index
There were 437 Pacific-RTDW events identified in the winters from 1950 to 2018, with an average of 6.3 events each winter. However, the frequency of Pacific-RTDW events varies greatly between winters, with the Arctic experiencing 16 such daily warming events in the winter of 1988 but only one in 2009. The Pacific-RTDW index is defined as the number of Pacific-RTDW events that occur each winter (December–February; also called the occurrence frequency of Pacific-RTDW events). The successive warming days are counted separately; that is, each event is weighted by its duration time. There was almost no significant linear trend of the Pacific-RTDW index during 1950–2018. One possible explanation is as follows: the Pacific-RTDW event is based on the temperature difference between the day of interest and the prior day. As a result, the trend impact contained in these 2 days is greatly offset.
2.4. El Niño event
The Niño3.4 index is defined as the winter (December–February) SST anomalies averaged over 5° S–5° N, 170° W–120° W. The El Niño event is identified by the 3-month sliding mean of the Niño 3.4 index above 0.5 and persisting for at least 5 months (https://origin.cpc.ncep.noaa.gov/products/analysis_monitoring/ensostuff/ONI_v5.php). The El Niño years (supplementary table S2) selected for composite analysis are 1950–1977 and 1978–2018.
2.5. Wave flux analysis and composite analysis
Wave flux analysis (Takaya and Nakamura 2001) can reveal quasi-stationary Rossby wave energy propagations. It is also a suitable diagnostic tool for detecting propagating quasi-stationary planetary waves.
The composite anomalies for the Pacific-RTDW event are calculated by averaging the geophysical field anomalies over Pacific-RTDW day −3 and day 0. For the P1 and P2 periods, the composite anomalies for the ENSO events are calculated as the winter geophysical field of the El Niño years minus the average of the corresponding period, and the differences between the two periods are calculated as the winter geophysical field of the El Niño years in the P2 period minus those in the P1 period. The two-tailed Student's t-test is used to test the significance of the composite anomalies.
3. Results
3.1. Characteristics of the Pacific-RTDW event
3.1.1. Synoptic atmospheric conditions for the Pacific-RTDW event
Supplementary figure S1 describes the synoptic-scale lifecycle of the Pacific-RTDW event. Three days before the Pacific-RTDW event, a significant cyclonic anomaly center can be seen to the west of the Aleutian Islands (supplementary figure S1(a)). It is located between a strong trough over east Asia and a ridge along the west coast of North America in the mid-troposphere, which is a favorable condition for cyclogenesis. As widely reported in research, cyclones move into the polar region following the southwest flow between the trough and ridge (e.g. Murray and Simmonds 1995, Qiangen et al 2000). At the time of Pacific-RTDW events, the most noticeable feature is maximum warming above 5 °C within 24 h caused by the obvious humid and warm southerly anomalies associated with a cyclone from the Pacific Ocean (supplementary figure S1(b)).
3.1.2. Large-scale atmospheric conditions associated with the frequency of Pacific-RTDW events
To explore the winter large-scale atmospheric conditions associated with the frequency of Pacific-RTDW events, anomalies of winter geopotential height and horizonal wind speeds are regressed on the Pacific-RTDW index. In the positive phase of the Pacific-RTDW index, there is a meridional tripolar system from the tropics to the Arctic in the mid–high troposphere (figures 1(a) and (b)). Two cyclonic anomalies appear over the Arctic and south of Hawaii, and the anti-cyclonic anomaly is over the Aleutian region. We refer to this pattern as the typical Pacific-RTDW pattern (figures 1(a) and (b)). For the typical Pacific-RTDW pattern, there are notable southerly anomalies between the trough (cyclone) and ridge (anticyclone) in the middle troposphere from mid latitudes to the Arctic, which is a necessary condition to produce a guiding flow that permits the cyclones with warm and humid air masses to enter the polar region (figure 1; e.g. Murray and Simmonds 1995, Qiangen et al 2000).
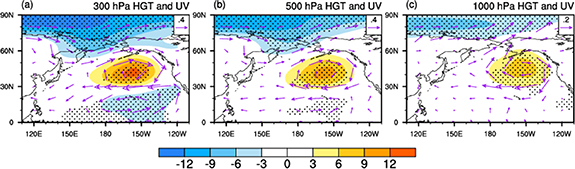
Figure 1. Anomalies of winter geopotential height (contour, interval: 3.0; units: m) and horizontal wind speeds (purple vector; units: m s−1) regressed on the Pacific-RTDW index at 300 (a), 500 (b) and 1000 hPa (c) during 1950–2018. The dots represent the significance level of p < 0.05.
Download figure:
Standard image High-resolution imageAt the near-surface, the Pacific-RTDW related cyclone and anti-cyclone are, respectively, located over the Arctic and the Aleutian (figure 1(c)), consistent with mid–high latitude anomaly centers in the mid–upper troposphere, which show equivalent barotropic structures. However, there is no significant anomaly center over the south of Hawaii, which displays a baroclinic property. These findings suggest that local convective heating may be responsible for the baroclinic anomaly centered over low latitudes and the barotropic anomalies centered over the mid–high latitudes may result from teleconnection in the middle troposphere.
Furthermore, the meridional tripolar system originates from the East Central Tropical Pacific and may be induced by ENSO. This motivates us to address the question whether the occurrence frequency of Pacific-RTDW events is affected by ENSO. Next, their relationships will be investigated in greater detail.
3.2. Stronger ENSO affects the occurrence frequency of Pacific-RTDW events
Prior to the late 1970s, the Pacific-RTDW index and the Niño3.4 index showed an uncertain phase relationship; however, after the late 1970s, the two indices were frequently out of phase (figure 2(a)). Specifically, the 31-year moving correlation shifts from insignificant to significant in 1993 and maintains a relatively stable significance level of p < 0.05 over 1993–2003 (the central years of 1978–2018). These results suggest that ENSO has had an influence on the frequency of Pacific-RTDW events since the late 1970s. As a result, the entire study period is divided into two subperiods: the P1 period (1950–1977) and the P2 period (1978–2018). Note that there is a lack of independence of the time periods in the blue line in figure 2(a) and CMIP6 models will be investigated in section 3.4 to add more samples.
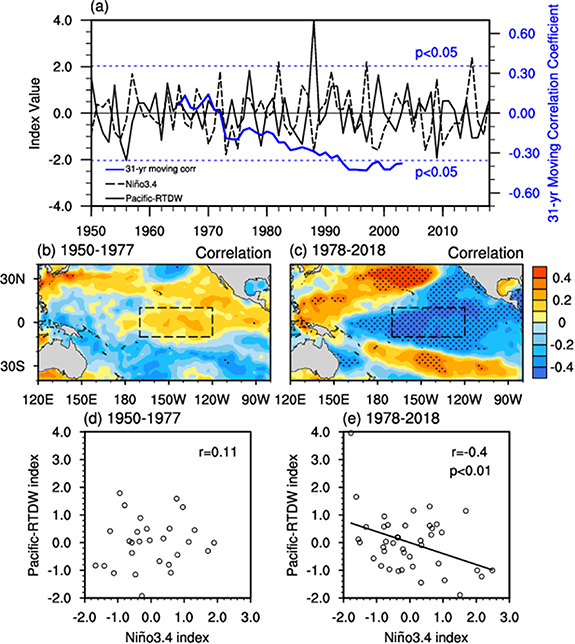
Figure 2. (a) Time series of the normalized Pacific-RTDW index (solid black line) and the winter Niño3.4 index (dotted black line) during 1950–2018, as well as their moving correlations of a 31-year window (solid blue line; shortened as '31 yr moving corr'). The correlation coefficient between SSTA and the Pacific-RTDW index in (b) 1950–1977 and (c) 1978–2018 (contour interval: 0.1). Scatter plots (black circle) between the Pacific-RTDW index and Niño3.4 index in (d) 1950–1977 and (e) 1978–2018. The short dotted blue lines in (a) and dots in (b) and (c) represent the significance level of p < 0.05. The dashed black boxes in (b) and (c) mark the region (10° S–10° N, 170° W–120° W). The r in (d) and (e), as well as the black line in (e), represent the correlation coefficient and the linear fit between the Pacific-RTDW index and Niño3.4 index, respectively, and the p in (e) denotes the significance level. The linear trends of the Pacific-RTDW index, the winter Niño3.4 index and SSTA have been removed.
Download figure:
Standard image High-resolution imageTo further demonstrate the strengthened effect of ENSO on the frequency of Pacific-RTDW events, figures 2(b) and (c) show the correlation distributions of SSTA with the Pacific-RTDW index over two periods. There is no significant correlation region of the Pacific-RTDW index with the SSTA in the East Central Tropical Pacific in the P1 period, while statistically significant negative correlations occupy the East Central Tropical Pacific in the P2 period (figure 2(b) and (c)). During the P1 period, the correlation coefficient between the Pacific-RTDW index and the winter Niño3.4 index is only 0.11 (insignificant), while it achieves a statistically significant level (p < 0.02) in the P2 period, which is −0.39 (figures 2(d) and (e)). This finding reminds us that ENSO may have an enhanced effect on the frequency of Pacific-RTDW events after the late 1970s and motivates us to explore the possible mechanism.
In addition, there was an interdecadal change in ENSO intensity in the late 1970s (Lee and McPhaden 2010, McPhaden et al 2011). Therefore, we hypothesize that the change in the relationship between the frequency of Pacific-RTDW events and ENSO is attributed to the ENSO intensity change. This will be confirmed in the following subsection.
3.3. Changes in ENSO and Pacific-RTDW before and after the late 1970s
The ENSO-related SSTA, which could determine the remote impacts on the global atmosphere (e.g. Li et al 2021), is examined. In the warm phase of ENSO, the ENSO-related spatial manifestation of SSTA is characterized by warm anomalies ranging from the dateline to South America in both periods. The spatial distributions of SSTA are similar, whereas the intensity of SSTA in the P2 period is greater than that in the P1 period (figures 3(a)–(c)). Therefore, more details about the atmospheric response to the enhanced SSTA are needed.
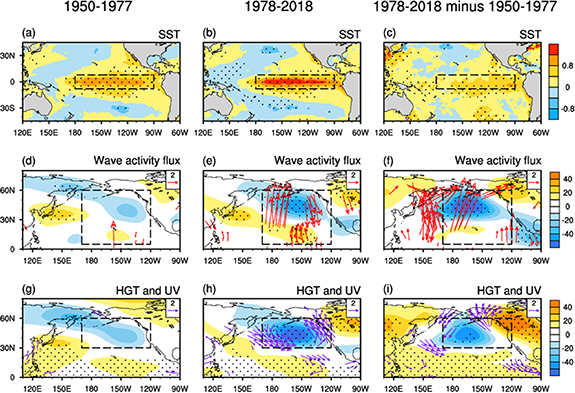
Figure 3. The composite of winter sea surface temperature ((a)–(c), colored; contour interval: 0.4; unit: °C), 500 hPa quasi-geostrophic stream function ((d)–(f), colored; contours interval: 10; unit: 105m2 s−1) and wave activity flux ((d)–(f), arrows, unit: m2 s−2), 500 hPa geopotential height ((g)–(i), colored; contours interval: 10; unit: m) and horizontal wind speed ((g)–(i), arrows; unit: m s−1) for the Niño 3.4 events. The first column represents the P1 period (1950–1977; (a), (d), (g)), the second column represents the P2 period (1978–2018; (b), (e), (h)) and the third column represents the difference between the P2 and P1 periods ((c), (f), (i)). The dots represent the significance level of p < 0.05. The arrows depict the wave activity flux and horizontal wind with meridional component anomalies at the 5% significance level. The dashed black boxes in (a)–(c) mark the region (8° S–8° N, 180° W–90° W), in (d)–(f) mark the region (5° N–60° N, 170° E–120° W), and in (g)–(i) mark the region (30° N–60° N, 170° E–120° W). The linear trends of these winter geophysical fields have been removed. The composite anomalies for the ENSO events in P1 and P2 periods are calculated as the El Niño years minus the average of the corresponding period, and the differences between the two periods are calculated as the El Niño years in the P2 period minus those in the P1 period.
Download figure:
Standard image High-resolution imageA stronger significantly anomalous ascending motion centered over the equatorial region is seen in the P2 period (supplementary figure S2(b)), corresponding to stronger diabatic forcing. In contrast, the magnitude of such ascending motion is much smaller in the P1 period (supplementary figure S2(a)). These configurations reflect the tropical local atmospheric circulation's response to changes in ENSO-related SSTA intensity between the P1 and P2 periods. We will now gain further insight into the role of different diabatic forcings between the two periods in impacting the mid–high latitudes of the Northern Hemisphere (NH).
The influence of tropical variability could be brought into mid–high latitudes by poleward propagating Rossby waves triggered by ENSO (e.g. Hu et al 2016). The ENSO-related Rossby wave activity fluxes and quasi-geostrophic stream functions for the two periods are compared in figures 3(d)–(e). During the P2 period, the Rossby wave exhibits an obvious northwards propagation trajectory in the warm phase of ENSO, which emanates from the East Central Tropical Pacific toward the Arctic (figure 3(e)). The corresponding quasi-geostrophic stream function shows a strong low over the Aleutian region. The Aleutian Low is characterized by the North Pacific (NP) index, which is defined as the area-weighted sea level pressure over the region (30° N–65° N, 160° E–140° W; Trenberth and Hurrell 1994). The correlation between the NP index and the Niño3.4 index is −0.61 in the P2 period at the significance level of 0.01. However, in the P1 period, the Rossby wave propagating northwards hardly exists, and the quasi-geostrophic stream function anomalies over the eastern part of the NP are also much weaker (figures 3(d)–(f)); the correlation between the NP index and the Niño3.4 index is −0.25, which is not statistically significant.
In the warm phase of ENSO, the intensities of cyclonic anomalies over the NP in the two periods are obviously different (figures 3(g)–(i)). In the P1 period, the cyclonic anomaly center over the NP is weak, while it becomes much stronger in the P2 period (figures 3(g)–(i)), indicating a greater deepening of the Aleutian Low in El Niño in the second period. Correspondingly, in the warm phase of ENSO, the resulting consistent northerly anomalies to the west of the Aleutian Low dominate over the NP in the P2 period, which could inhibit typical Pacific-RTDW event occurrences (figures 1(a) and 3(h)). Similarly, in the cold phase of ENSO, there are obvious southerlies over the NP in the P2 period, which could increase the Pacific-RTDW event occurrences. Thus, in the P2 period, ENSO could influence the occurrence frequency of Arctic daily warming events. However, no obvious meridional wind anomalies can be observed over the same region for the P1 period (figure 3(g)), implying that ENSO did not impact the occurrence frequency of Pacific-RTDW events.
In the following, the Rossby wave activity fluxes and quasi-geostrophic stream functions associated with the Pacific-RTDW index for the two periods are examined in figure 4. During the P1 period, there is almost no significant wave flux activity associated with the Pacific-RTDW propagating northwards from the East Central Tropical Pacific (figure 4(a)). The corresponding cyclonic and anticyclonic anomaly centers are only seen over the NP and the west of the Bering Strait (figures 4(a) and (c)), respectively, which is different from the ENSO-related circulation anomalies. These phenomena mean that the connection between the Pacific-RTDW and ENSO is weak in the P1 period. The Pacific-RTDW may be influenced by other factors, which will be studied in the future.
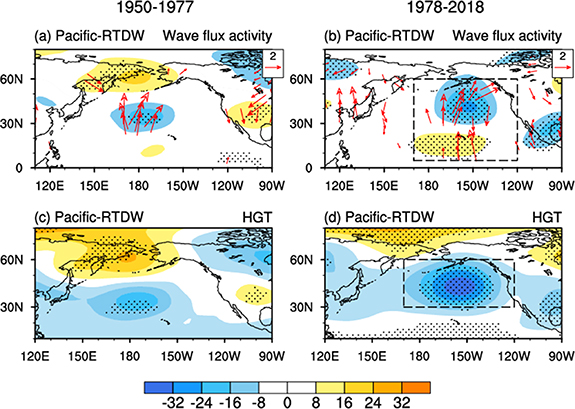
Figure 4. Anomalies of the winter 500 hPa quasi-geostrophic stream function ((a), (b), colored; contours interval: 8; unit: 105 m2 s−1), wave activity flux ((a), (b), arrows; unit: m2 s−2) and geopotential height ((c), (d), colored; contours interval: 8; unit: m) regressed on the Pacific-RTDW index. The first column represents the P1 period (1950–1977; (a), (c)), and the second column represents the P2 period (1978–2018; (b), (d)). The dots represent the significance level of p < 0.05. The arrows depict the wave activity flux with meridional component anomalies at the 5% significance level. The dashed black boxes in (b) marks the region (5° N–60° N, 170° E–120° W) and in (d) marks the region (30° N–60° N, 170° E–120° W). The Pacific-RTDW index was multiplied by −1 for display purposes.
Download figure:
Standard image High-resolution imageIn contrast, in the P2 period, the wave activity flux associated with the Pacific-RTDW exhibits an obvious northwards propagation trajectory (figure 4(b)); the resulting stream function shows that anticyclonic and cyclonic anomaly centers appear over the East Central Tropical Pacific and the NP (figures 4(b) and (d)), respectively. These results are consistent with the ENSO-related wave flux activity and circulation anomalies (figures 3(e) and (h)), implying that ENSO could have an impact on the Pacific-RTDW during the P2 period.
Since the late 1970s, the potential physical mechanism of the ENSO's strengthening effect on the occurrence frequency of Pacific-RTDW events could be interpreted as follows. During the P2 period (1978–2018), enhanced ENSO excites and reinforces a Rossby wave propagating toward the pole by stronger diabatic heating, which causes a deepened Aleutian Low accompanied by northerly anomalies over the NP to decrease the occurrence frequency of Pacific-RTDW events in the warm phase of ENSO. In the cold phase of ENSO, it increases the occurrence frequency of Pacific-RTDW events. Therefore, in the P2 period, ENSO could directly affect the occurrence frequency of Pacific-RTDW events. However, due to the weak ENSO intensity, there are no such impacts in the P1 period. Under a global warming scenario, ENSO intensity will most likely determine the connection between the tropics and the Arctic.
3.4. The relationship between ENSO and Pacific-RTDW events under historical and future scenarios
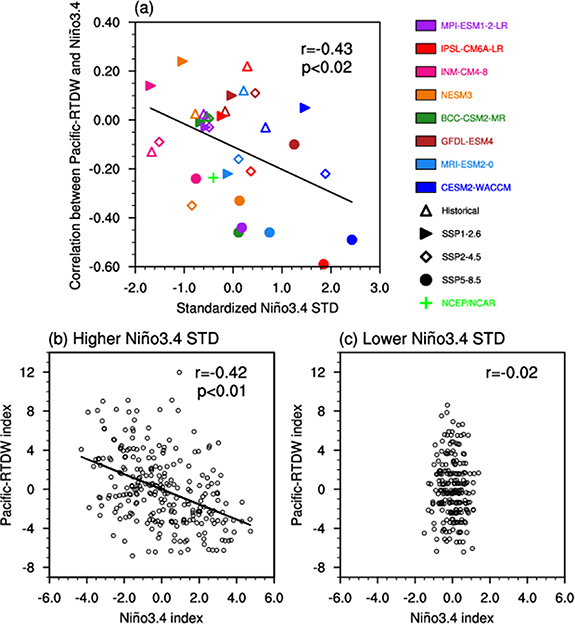
By using a set of eight CMIP6 models under historical simulation and three future scenarios, the correlation coefficient of the Pacific-RTDW index with the Niño3.4 index (shortened as 'Corr') and the standard deviation of the Niño3.4 index (shortened as 'STD') are calculated. 'Corr' denotes the relationship between the frequency of Pacific-RTDW events and ENSO, and the 'STD' denotes ENSO intensity. Furthermore, figure 5(a) depicts the relationship between 'Corr' and 'STD'. The inter-model correlation coefficient is −0.43 (p < 0.02), indicating that 'Corr' is clearly related to 'STD'. This is consistent with the above findings that ENSO intensity could affect the relationship between ENSO and the frequency of Pacific-RTDW events. Moreover, we divided the models into high Niño3.4 STD models with the standardized 'STD' greater than 'X' and low Niño3.4 STD models with the standardized 'STD' less than 'X' multiplied by −1 (table S3). We set 'X' to 1.5 to obtain the extreme Niño3.4 STD models. Figures 5(b) and (c) show that there are more extreme ENSO events in the high Niño3.4 STD models than those in the low Niño3.4 STD models. Furthermore, in the high Niño3.4 STD models, the correlation coefficient between the Pacific-RTDW index and the Niño3.4 index is −0.42 (significant; figure 5(b)); however, it is insignificant in low Niño3.4 STD models (figure 5(c)). We also set 'X' to 0.5 and 1.0 to define the high and low Niño3.4 STD models, and the results support the above findings (figure S3). These results further confirm that the ENSO intensity could influence the relationship between ENSO and the frequency of Pacific-RTDW events.
Figure 5. (a) CMIP6 inter-model relationships between the correlation coefficient of the Pacific-RTDW index with the Niño3.4 index (shortened as 'Corr') and the standard deviation of the Niño3.4 index (shortened as 'STD'). In (a), the r and black line are the inter-model correlation coefficient and the linear fit between 'Corr' and 'STD' (excluding the values of 'Corr' and 'STD' derived from NCEP/NCAR), respectively. The 'STD' in (a) is standardized by subtracting the average value and then dividing the result by the standard deviation; this is denoted as 'Standardized Niño3.4 STD'. For the sake of a clearer comparison, the values of 'Corr' and 'STD' derived from NCEP/NCAR are also plotted in (a; green cross). (b) and (c) Scatter plots (black circle) between the Pacific-RTDW index and Niño3.4 index in all the historical and future scenarios of CMIP6 models with the standardized 'STD' > 1.5 ((b); higher Niño3.4 STD) and < −1.5 ((c); lower Niño3.4 STD). In (b) and (c), the r and black line are the correlation coefficient and the linear fit between the two indices, respectively. The p denotes the significance level. The black circles represent the samples in the CMIP6 models.
Download figure:
Standard image High-resolution image
Furthermore, for the same model, as the radiative forcing increases from SSP1-2.6 to SSP5-8.5, so does the ENSO intensity (figure 5(a)). As a result, ENSO will continue to affect the Arctic with global warming in the future. Previous studies have found a wide range of historical simulated ENSO intensities among the CMIP5 and CMIP6 models (Wengel et al 2018, Brown et al 2020, Planton et al 2020). In terms of ENSO intensity under future scenarios, different CMIP5 models behave very differently, with some increasing and others decreasing or remaining unchanged (Guilyardi et al 2012, Stevenson 2012). Most CMIP6 models show an increase in future ENSO intensity (Fredriksen et al 2020). In the present study, we simply diagnose the impact of ENSO intensity on the relationship between ENSO and Arctic daily warming events by using CMIP6 models. The evaluation of the CMIP6 model, e.g. whether the models reproduce the ENSO statistical data reasonably, the relationship between the ENSO and Pacific-RTDW, and many aspects of ENSO in the future merit further investigation.
4. Conclusions
The present study investigates potential factors that influence the occurrence frequency of Arctic winter daily warming events. We find that due to amplified ENSO intensity, ENSO could have directly affected the frequency of Arctic daily warming events after the late 1970s. Although the teleconnection associated with the stronger ENSO after the late 1970s is only seen in the low–mid latitude part of the typical Pacific-RTDW pattern, it provides a potential relation between the low and high latitudes and increases the possibility of ENSO affecting the Arctic.
Additionally, as shown in figure S4(a), the barotropic structure is truly influenced by mid-latitude and polar systems such as Arctic Oscillation (AO; Thompson and Wallace 1998). To further confirm the relationship between Arctic warming and ENSO, the geopotential anomalies are regressed onto the Pacific-RTDW index by first removing the AO signal. Figure S4(b) shows that after removing the AO signal, the mid-latitude and polar signals are weakened; however, the relation between the Arctic and tropics still exists. The results support that the Pacific-RTDW pattern is consistent with ENSO-related teleconnection after the late 1970s.
The European Centre for Medium-Range Weather Forecasts Reanalysis v5 (ERA5) dataset was used to reproduce the results. To some extent, the results using ERA5 data confirm that there is an interdecadal change in the relationship between ENSO and Arctic daily warming around the late 1970s (not shown). Given that there are some differences between the daily data of NCEP and ERA5, a threshold of 1.2 standard deviations is defined in the Pacific-RTDW index in ERA5. In the next study, we will evaluate the difference and quality of NCEP and ERA5 daily reanalysis data. Previous studies have found that re-analysis datasets in the NH were unaffected by satellite products (Mo et al 1995, Kalnay et al 1996), meaning that satellite products have little impact on the statistics of our results.
The present findings have the potential to make the frequency of Arctic daily warming events more predictable. Furthermore, our results suggest that under the global warming scenario, the variability in Arctic warm events would increase due to the increased ENSO intensity.
Acknowledgments
This work was supported by the National Natural Science Foundation of China (41675066) and Anhui Provincial Natural Science Foundation (1908085MD108).
Data availability statement
The NCEP–NCAR reanalysis dataset and HadISST dataset can be obtained online at www.esrl.noaa.gov/psd/data/gridded/reanalysis/ and www.metoffice.gov.uk/hadobs/hadisst/. The CMIP6 dataset is provided at https://esgf-node.llnl.gov/projects/cmip6/. Auxiliary data supporting the results of this study are available from the corresponding author upon reasonable request.
Supplementary data (0.5 MB DOCX)