


Abstract
River flow in cold climates is known to be one of the hydrological systems most affected by climate change, playing a central role in the sustainability of downstream socio-ecological systems. Numerous studies on the temporal and spatial variations of streamflow characteristics have been done, and a comprehensive study on the variation of hydrologic extremes is becoming increasingly important. This study evaluated the long-running changes in the magnitude, time, and inter-annual variability of hydrologic extremes, including high and low flow in 16 major Finnish rivers. We applied four new hydrologic extreme indices for summer–winter low flow ratio, spring-absolute high flow ratio, time-to-peak index, and increasing rate index during the snowmelt period to analyze the spatiotemporal variations of extreme streamflow from 1911 to 2020. The most detected trends in flow regimes have started in the last six decades and become more severe from 1991 to 2020, which is likely to be dominated by anthropogenic global warming. The results also indicated that alteration of low pulses in most rivers was associated with an increase (decrease) in winter (summer) flows, suggesting the annual minimum flow in summer frequently contradicts natural hydrologic regimes in Arctic rivers. Southern Finland has experienced higher variations in extreme hydrology over the last century. A new low flow regime was detected for southern rivers, characterized by frequent annual minimum flow in summer instead of winter. Moreover, the annual maximum flow before/after spring dictated a new high-flow regime characterized by frequent double peak flows in this region.
Export citation and abstract BibTeX RIS

Original content from this work may be used under the terms of the Creative Commons Attribution 4.0 license. Any further distribution of this work must maintain attribution to the author(s) and the title of the work, journal citation and DOI.
1. Introduction
River flow plays a substantial role in oceanic processes, nutrients, freshwater export, marine ecosystems, and hydropower generation in cold climate environments (Lewis et al 2012). In a cold climate, the natural river's regime has a lower winter flow (snow accumulation phase) and higher flow rates (driven by snowmelt) during spring and rain-induced summer floods. However, this typical flow pattern is being altered, leading to serious consequences in hydro-ecological systems (Prowse and Brown 2010, Huser et al 2020).
Alteration of the river's regime is recognized as a key threat to many marine ecosystems and freshwater flux to the Arctic Ocean (White et al 2007, Rawlins et al 2010, Haine et al 2015, Tonkin et al 2018). Due to the central role of hydropower in the Arctic community, flow regime changes may have additional negative impacts on energy production and socio-economic activities in such regions (Hauer et al 2014, Schmutz et al 2015, Ashraf et al 2018, Torabi Haghighi et al 2019).
Arctic regions have experienced a remarkable warming rate in recent decades, more than double the global average (Ballinger et al 2020, Witze 2020). As Arctic and sub-Arctic environments are generally dominated by cryospheric phenomena (including snow cover, glaciers, ice caps, river and lake ices, and permafrost), these regions are substantially vulnerable to climate change and climate variability (Woo et al 2008, Ford and Furgal 2009, Soldatenko and Alekseev 2020, Vincent 2020). There is a growing body of literature that predicts how climate warming, according to several global change scenarios, has the potential to alter the water cycle across northern latitudes significantly (i.e. Gelfan et al 2017, Shevnina et al 2018, Mohanty and Simonovic 2021, Stadnyk et al 2021).
Due to widespread changes in cold climates, it is crucial to quantify the associated alterations in natural flow regimes. Numerous studies have attributed the changes in Arctic streams and rivers to higher precipitation and permafrost melting rates under global warming (i.e. Holmes et al 2015, Bring et al 2016, Ahmed et al 2020, Chupakov et al 2020, Rasouli et al 2020, Xu et al 2020). However, much of the research has shown regional variations in river regime changes from North America to Eurasian Basins (Déry and Wood 2005, Wagner et al 2011, Suzuki et al 2018). Regional scale spatial analysis is hence needed to provide insight for hydrologists and scientists from other disciplines to ensure the sustainability of the nexus between water, energy, and cold climate ecosystems.
Due to the complexity of climate systems, short to mid-term fluctuations in river flow may be influenced by various regional periodic phenomena. River regime changes should be quantified based on long data records to ensure the long-term trend detection and a greater understanding of the influence of large-scale atmospheric patterns in cold climate environments. Most of the earlier studies have been focused on short-term river regimes (i.e. Overeem and Syvitski 2010, Suzuki et al 2018, Durocher et al 2019, Ahmed et al 2020), while investigations of long-term Arctic River flow are generally lacking.
Despite the diverse and extensive application of flow regime metrics (i.e. magnitude, frequency, duration, timing and rate of change) to describe variations in flow regime, there have been surprisingly few comprehensive metric estimations of the interannual variabilities and temporal shifts. Most previous assessments have mainly focused on the annual variations of flow regimes, while their interannual variabilities and temporal shifts are still poorly understood. Knowledge about the underlying mechanism and interannual variabilities are important both from a hydrological perspective and for water-energy-food nexus of different regions. We have experienced drought events affecting the timing of extreme hydrology (i.e. low flow), leading to substantial impacts on energy and water supply in the agricultural sector. This is especially relevant for ecohydrological studies, where an inability to accurately capture hydrological alterations and associated ecological responses can have significant socio-economic and ecological consequences.
This study elaborates on the annual shifts of flow regime alteration by presenting a comprehensive overview of long-term changes in hydrologic extremes (the timing and magnitude of inter-annual variability in low/high flow) in Finnish rivers, contrasting the current literature to detect the mean and extreme streamflow (Do et al 2017, Xue et al 2017, Myronidis et al 2018, Gudmundsson et al 2019, Al-Hasani 2020, Ashraf et al 2021, Das et al 2021). A statistical analysis approach was applied to quantify the changes in the selected Finnish rivers with a 110 year length available daily record, looking at the period 1911–2020. This study aimed to: (a) investigate the spatiotemporal changes in timing and magnitude of extreme hydrological events; (b) detect the inter-annual variability of cold climate hydrology; and (c) identify the evolution of snowmelt runoff pulse in Finnish rivers over the past century.
2. Material and methods
2.1. Overview of study area and data
Most Finnish rivers flow to the Baltic Sea through the Gulf of Bothnia, the Gulf of Finland, and the Archipelago Sea. However, some rivers flow to Russia and Norway, ending their path in the Arctic Ocean. We studied 16 headwater stations on Finnish rivers: regulated, pristine, flowing down to lakes, or beginning from lakes. These stations were well distributed across the country's geographic locations (figure 1(B)). The selected regulated river stations are located upstream of hydropower stations and dams. Therefore, no selected station was significantly influenced by anthropogenic drivers. Some selected rivers are known as Arctic rivers, including the Tana, Torniojoki, Paatsajoki, and Kemijoki rivers. The daily flows from 1911 to 2020 were obtained to quantify the long-term changes in extreme flow in the selected stations. Due to world economic growth in the 1960s, extreme flows during 1911–1960 and 1961–2020 were also evaluated to monitor the flow variation in the selected rivers before and after the industrial revolution.
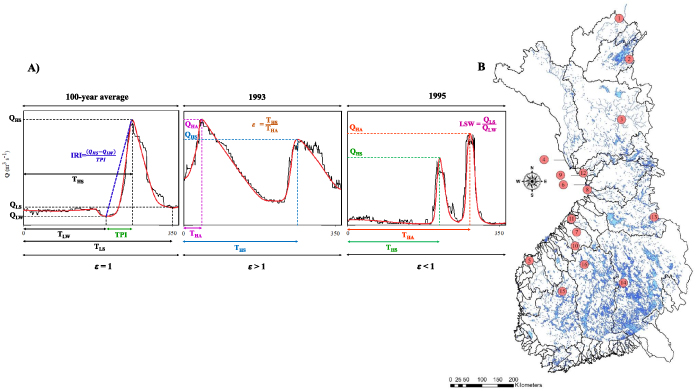
Figure 1. (A) The applied extreme streamflow indices; (B) location of the selected headwater across Finland between spring peak flow time (THS) and 30 September, and between 1 October and THS, respectively (figure (A)). LSW > 1 is an expected value in the Nordic rivers (the occurrence of annual low flow during fall–winter), while LSW < 1 indicates the unusual condition on the minimum flow occurrence (the occurrence of summer).
Download figure:
Standard image High-resolution imageMoreover, four additional 30 year periods, including 1911–1930, 1931–1960, 1961–1990, and 1991–2020 were selected to quantify the hydrologic changes. The lowest and highest mean discharge values were at the Lestijoki @ Lestijärvi-luusua (7.3 m3 s−1) and Kemijoki @ Kemihaara (556 m3 s−1) rivers.
2.2. Novel extreme streamflow indices
To address the current gap in existing metrics for flow regime (interannual variabilities and temporal shifts) assessment, this study introduced four novel indices, including a summer–winter low flow ratio, spring-absolute high flow ratio, time-to-peak (TPI) index, and increasing rate (IRI) index during the snowmelt period, to assess the interannual variabilities and temporal shifts in extreme hydrology regimes (figure 1(A)).
The summer–winter low flow ratio (LSW) was applied to assess the spatiotemporal changes in the low flow regime (especially the shift in the timing of low flow):

where QLS and QLW are the summer and winter low flows. QLS and QLW were extracted as the recorded minimum flow.
The spring-absolute high flow time ratio,  , was defined as a new ratio to quantify the high flow regime alteration over time:

where THS and THA are the associated time (number of days after 1 October according to hydrological year) to spring peak flow (QHS, due to snowmelt occurring between 1 February and 1 June) and the absolute high flow (QHA), respectively. The expected value of for typical Nordic rivers is '1', which reveals that annual maximum flow is caused by snowmelt in spring, while the unequal value of 1 means that peak flow occurred between 1 June and 1 December, due to intensive rainfall. The > 1 (and < 1) means the second peak flow occurred before (and after) the first of October, as THS and THA count from the first of October. This index can assess possible changes in Nordic rivers with a dual peak flow regime. The number of events and their return periods were calculated over the studied periods. In this study, the return period was defined as the number of > 1 (or < 1) events divided by the number of years in the corresponding period.
The TPI and IRI indices were designed to estimate temporal changes in the snowmelt rate
where THS and TLW are the corresponding times of QHS and QLW. In addition, the date of summer daily low flow (TLS) was defined to assess possible changes in the timing of low flow. Moreover, the mean flows during fall–winter (1 October–31 March), and spring–summer (1 April–3 September ) were considered to analyze seasonal flow trends in selected gauges (figure 1(A)). Generally, the low/peak flows and their associated times were directly extracted from the observed daily flow over the study period. The MATLAB code was used to calculate the mentioned extreme flow indices.
2.3. Trend analysis
The nonparametric Mann–Kendall (MK) test (Mann 1945, Kendall 1975) was applied to assess the trend of introduced indices. In addition, The pre-whitening procedure was used when a significant serial correlation was detected through a Durbin–Watson test (Durbin and Watson 1950, 1971) at the 5% level. This statistical test uses the residuals from regression analysis to detect the temporal relationship between values (autocorrelation). The Durbin–Watson test was applied to the original time series when the autocorrelation was significant at the 5% level; the data must then be pre-whitened before the MK test. Finally, trend magnitude (change per unit of time) was calculated using a non-parametric linear Sen's slope estimator (1968). A Sen's slope estimator was applied here if a time series presented a significant (P < 0.05) linear trend.
3. Results
3.1. Temporal analysis of low flow
Despite Tana, Kymijoki, Kokemäenjoki, Oulujoki, and Iijoki, QLW experienced an upward trend during 1911–2020. Out of this, 43.75% of stations indicated a significant (P < 0.05) positive trend (figure S2). This tendency for QLW intensified between 1991 and 2020. Additionally, winter low flow occurred earlier (0.04–0.67 d yr−1) in all rivers except Arctic rivers. Due to the important implications of climatic conditions in headwaters' hydrology (Peterson et al 2002, Ashraf et al 2016, Vihma et al 2016), these increasing and earlier tendencies can be attributable to accelerated warming in higher latitudes over recent decades. Increasing permafrost thawing accelerates infiltration and enhances deeper flow paths, resulting in broad-scale mobilization of subsurface water into rivers (St. Jacques and Sauchyn 2009, Evans et al 2020). Moreover, an increased rainfall over snow during the fall and winter seasons may significantly increase the fall–winter stream flows (Reihan et al 2007, Adam and Lettenmaier 2008, Klavins and Rodinov 2008, Rawlins et al 2009).
3.2. Temporal analysis of high flow
The QHA followed a negative trend in the Kalajoki river, increased in the Kymijoki River and showed no significant trend in 87.5% of reference stations (figure S3) from 1911 to 2020. About 62.5% of stations (Kyrönjoki, Iijoki, Kalajoki, Kiiminginjoki, Kuivajoki, Pyhäjoki, Simojoki, Oulujoki, Kokemäenjoki, and Kymijoki) indicated decreasing tendencies in QHA during 1961–2020 which is likely to be dominated by climate change, while during 1911–1960 and 1911–2020 showed weak negative or even positive trends. The results also showed that in 1911–1960, 43.75% of stations experienced increasing tendencies in QHA, while only 12.5% and 18.75% of stations showed similar trends during 1961–1990 and 1981–2010, respectively.
The THA showed a negative trend in 68.75% of stations during 1961–2020, while it significantly decreased in 50% of stations (i.e. Paatsjoki, Kyrönjoki, Iijoki, Pyhäjoki, Simiojoki, Oulujoki, Vuoksi, and Kymijoki) (figure S2). The selected gauges in Arctic rivers experienced a shifting back in the THA between 1911–1960 (−0.04 to −0.37 d yr−1), 1911–2020 (−0.03 to −0.11 d yr−1), and 1961–2020 (−0.11 to −0.20 d yr−1) periods (figure S2). Likewise, other studies confirmed similar tendencies in QHA and THA for Arctic rivers across the permafrost regions of Canada, Russia, Sweden, and Finland (Matti et al 2016, Ahmed et al 2020, Ploeg et al 2021, Shrestha et al 2021).
The QHS indicated a significant decreasing tendency (P < 0.05) in the Kalajoki (−0.78 m3 s yr−1) river, with significant increasing tendencies (P < 0.05) in the Tornionjoki (5.66 m3 s yr−1), Vouksi (0.23 m3 s yr−1), and Kymijoki (0.08 m3 s yr−1) rivers, and an insignificant (P > 0.05) trend in the other rivers during the 1911–2020 period (figure S3). In all stations, THS occurred around 0.05–0.17 d yr−1 earlier from 1911 to 2020. This backward shift in THS was significant (P < 0.05) in the Tornionjoki (−0.05 d yr−1), Lestijoki (−0.12 d yr−1), Tana (−0.04 d yr−1), Oulujoki (−0.08 d yr−1), Vouksi (−0.04 d yr−1), Kokemäenjoki (−0.06 d yr−1), Kymijoki (−0.17 d yr−1), and Kyrönjoki (−0.12 d yr−1) rivers (figure S2). The QHS indicated decreasing tendencies in Kemijoki, Kyrönjoki, Iijoki, Kuivajoki, Kiiminginjoki, Simojoki, Kalajoki, and Oulujoki during 1961–2020, while it increased in 1911–1960. In contrast, negative tendencies in Tana, Tornionjoki, and Lestijokirivers during 1911–1960 followed by positive trends in 1961–2020.
In Kalajoki, Kyrönjoki, Kokemäenjoki, and Kymijoki, the results indicated the occurrence of QHA during the summer and fall due to extensive rainfall in this period or increasing temperature and reduced snow cover in spring. The increasing trends of fall–winter average flow in Kyrönjoki and Kymijoki, as well as the positive tendency in fall–winter base flow, confirm this high flow pattern. Given no significant changes in QHS values for 75% of the studied stations, temperature rise due to global warming can be introduced as the primary factor in the acceleration of snowmelt (Makarieva et al 2019, Suzuki et al 2020), leading to an earlier spring peak of the selected rivers.
During 1991–2020, 75% of stations showed negative trends in THS, with the largest decreasing rates in Kymijoki (−0.56 d yr−1), Kokemäenjoki (−0.40 d yr−1), Kyrönjoki (−1.1 d yr−1), Vouksi (−0.30 d yr−1), Kiiminginjoki (−0.27 d yr−1), and Pyhajoki (−0.46 d yr−1). Several previous studies confirmed this tendency towards earlier snowmelt runoff in Arctic rivers and attributed it to climate change (Semmens and Ramage 2013, Shen et al 2018).
3.3. Spatiotemporal analysis of time to peak
The TPI showed no trend in the Oulujoki Kymijoki, and Paatsjoki rivers, while it was shortened in the Tornionjoki (−0.13 d yr−1), Kemijoki (−0.08 d yr−1), and Tana (−0.18 d yr−1) rivers and lengthened (0.04–0.71 d yr−1) at the rest of the stations in the 1911–2020 period (figure 2). The increasing (1911–1960) trends in TPI reversed in the Tana, Paatsjoki, Kemijoki, Simojoki, Kokemäenjoki, and Kymijoki during 1961–2020 which is likely to be dominated by global warming. In the 1991–2020 period, the declining tendencies in TPI weakened for the Tana and Paatsjoki rivers and reversed in the Tornionjoki, Oulujoki, Kiiminginjoki, and Kemijoki rivers (figure S4). The earlier winter and spring warming trends lead to slower snowmelt rates (Musselman et al 2017, Alonso-González et al 2020), which induce snow melting extension (0.11–0.89 d yr−1) in the reference stations located in sub-Arctic regions and southern Finland. As snowmelt shifts earlier in a warmer climate, the snowmelt rate is significantly reduced through the contraction of the snowmelt to a time of lower available energy. The Sun could not provide enough energy under the lower sun angles of late winter and early spring to drive high snowmelt rates (Musselman et al 2017). Therefore, earlier snowmelt occurs at slower rates, leading to relatively lower spring peak flow, consistent with the observed changes in the 1991–2020 period in 68.75% of the studied rivers. However, fast warming can accelerate snowpack ablation during spring and summer in very cold climates (Wu et al 2018), which is in accordance with our results (−0.08 to −0.18 d yr−1) in Arctic rivers, such as the Tana, Paatsjoki, and Kemijoki (except the last period) rivers, located in higher latitudes.
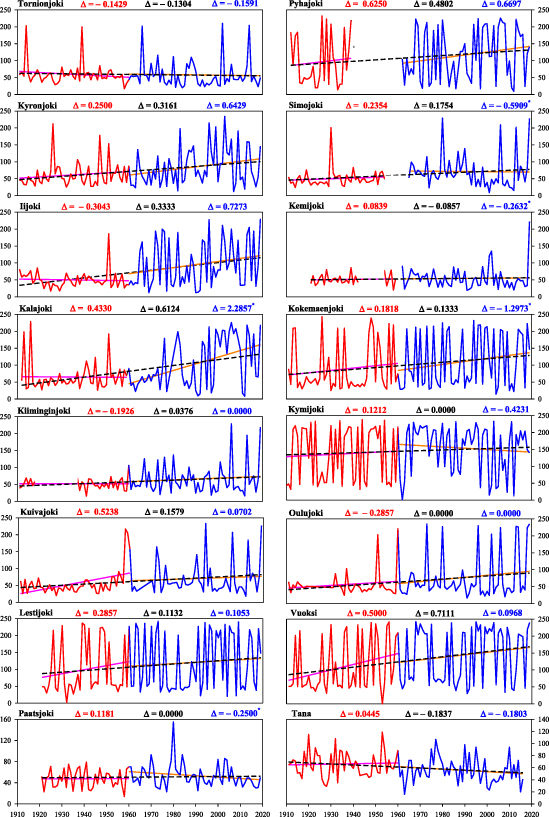
Figure 2. Monotonic trends in TPI over 1911–1960 (purple), 1911–2020 (black), and 1961–2020 (orange) across Finnish rivers. Δ is the Sen's slope and * denotes statistically significant trends at a 5% critical level.
Download figure:
Standard image High-resolution imageAccording to figure 3, the IRI showed a positive trend in Arctic rivers, while it significantly (P < 0.05) increased in the Tornionjoki (0.21 m3 s−1 d−1 yr−1) Tana (0.10 m3 s−1 d−1 yr−1), and Kymijoki (0.001 m3 s−1 d−1 yr−1) and reduced at the rest of the stations (except the Oulujoki) over the 1911–2020 period. These declining tendencies in IRI are significant (P < 0.05) in the Kyrönjoki (−0.03 m3 s−1 d−1 yr−1), Kalajoki (−0.03 m3 s−1 d−1 yr−1), Kuivajoki (−0.02 m3 s−1 d−1 yr−1), Iijoki (−0.06 m3 s−1 d−1 yr−1), Simiojoki (−0.04 m3 s−1 d−1 yr−1), and Kokemäenjoki (−0.001 m3 s−1 d−1 yr−1) rivers.

Figure 3. Monotonic trends in IRI over 1911–1960 (purple), 1911–2020 (black), and 1961–2020 (orange) across Finnish rivers. Δ is the Sen's slope and * denotes statistically significant trends at a 5% critical level.
Download figure:
Standard image High-resolution imageThe negative (1911–1960) trends in IRI reversed in the Kemijoki, and Simiojoki during 1961–2020, which is likely to be dominated by global warming. However, the increasing trends in Iijoki and Oulujoki were followed by negative trends after 1961. In Arctic rivers, except for Paatsjoki and Tana, the positive trends in IRI reversed to significant (P < 0.05) negative tendencies during 1991–2020 (figure S7). The significant reduction in QHS and time to peak extension due to slower snowmelt rates is the dominant factor in decreasing IRI tendencies over the recent decades.
3.4. Spatiotemporal analysis of low flow
The LSW index exhibited decreasing tendencies in 1911–2020 in low-latitude rivers (i.e. Tornionjoki (−0.01 year−1), Kyrönjoki (−0.01 yr−1), Kalajoki (−0.03 yr−1), Kuivajoki (−0.01 yr−1), Simiojoki (−0.006 yr−1), Kymijoki (−0.005 yr−1), Vouksi (−0.002 yr−1), Oulujoki (−0.004 yr−1), Iijoki (−0.004 yr−1), Lestijoki (−0.002 yr−1), Kiiminginjoki (−0.001 yr−1), and Paatsjoki (−0.0004 yr−1) rivers), and increased in the Pyhajoki (0.02 yr−1), Tana (0.01 yr−1), Kemijoki (0.002 yr−1), and Kokemäenjoki (0.0005 yr−1) rivers (figure 4). The increasing tendencies in QLS can be understood to be the leading cause of the positive trends in LSW, reinforcing the main hydrologic feature of the Arctic flow regime in Northern Finland, except for in the Tornionjoki. In contrast, from 1991 to 2020, the Arctic rivers (Tana, and Kemijoki) indicated negative trends of LSW due to significant reductions in QLW compared with earlier study periods (figure S8).

Figure 4. Monotonic trends in LSW over 1911–1960 (purple), 1911–2020 (black), and 1961–2020 (orange) across Finnish rivers. Δ is the Sen's slope and * denotes statistically significant trends at a 5% critical level.
Download figure:
Standard image High-resolution image
The increasing (1911–1960) trends in LSW reversed in Iijoki, Kalajoki, Kiiminginjoki, Lestijoki, and Oulujoki during 1961–2020, which is likely to be dominated by global warming (figure 4). In contrast, the negative tendencies in Kymijoki Pyhäjoki and Vuoksi were followed by positive trends from 1961 to 2020.
This is a clear signal of change in the timing and magnitude of the absolute low flow regime in the studied rivers. The detected decreasing tendencies of LSW in the Tornionjoki, Kemijoki, and Kymijoki rivers are directly tied to an increase in QLW, while the Lestijoki and Vouksi rivers showed a significant positive trend in mean fall–winter flow only.
The natural flow regime (LSW > 1) in Finnish rivers is characterized by low winter flows during extensive permafrost coverage (Arheimer et al 2017). However, the detected decreasing trend in the LSW index confirms the significant alteration of low flow pulses in Finnish rivers (except for Tana, Paatsjoki, and Pyhajoki), suggesting the frequent occurrence of an absolute low flow in summer instead of winter (LSW < 1), which is likely to be dominated by climate change (table 1). The results showed that the absolute low flow in Tornionjoki and Iijoki would usually occur more in late summer than winter in the 1991–2020 period. The number of experienced flow regimes with LSW < 1 decreased in the Oulujoki, Lestijoki, Kiiminginjoki, Kalajoki, and Kymijoki rivers for the last period (1991–2020) and remained relatively constant in the other rivers (table 1).
Table 1. The occurrence of absolute minimum flow in summer (LSW < 1) in the selected rivers.
| River | 1911–1960 | 1961–1990 | 1971–2000 | 1981–2010 | 1991–2020 |
|---|---|---|---|---|---|
| Tana | 0 | 0 | 0 | 0 | 0 |
| Kemijiko | 2 | 1 | 1 | 0 | 1 |
| Kokemäenjoki | 28 | 11 | 12 | 13 | 12 |
| Kymijoki | 19 | 20 | 20 | 24 | 13 |
| Tornionjoki | 0 | 0 | 0 | 0 | 16 |
| Kyrönjoki | 20 | 20 | 19 | 16 | 16 |
| Iijoki | 8 | 9 | 11 | 12 | 20 |
| Kalajoki | 9 | 16 | 19 | 19 | 15 |
| Kiiminginjoki | 11 | 5 | 7 | 5 | 3 |
| Kuivajoki | 6 | 10 | 8 | 11 | 10 |
| Lestijoki | 13 | 11 | 12 | 12 | 7 |
| Paatsjoki | 0 | 0 | 0 | 0 | 0 |
| Pyhajoki | 0 | 0 | 0 | 0 | 0 |
| Simijoki | 10 | 5 | 3 | 3 | 2 |
| Vouksi | 13 | 10 | 9 | 10 | 10 |
| Oulujoki | 11 | 11 | 11 | 12 | 6 |
3.5. Spatiotemporal analysis of high flow
The indicated that QHS (caused by snowmelt) did not necessarily match the maximum absolute flow for southern rivers (i.e. the Lestijoki, Vouksi, Kalajoki, Kokemäenjoki, Kymijoki, and Kyrönjoki) from 1911 to 2020 (figure S10). The number of years with = 1 (normal flow regime) in the Lestijoki, Vouksi, and Kokemäenjoki rivers exhibited a significant (P < 0.05) decline from 1911 to 2020. Among southern rivers, the most extreme flow (greater return period) happened in the Kymijoki, Kalajoki, and Kokemäenjoki, with 3.3, 3.7, and 5 year return periods, respectively. However, the Lestijoki, Vouksi, and Kyrönjoki experienced the lowest return periods of = 1 events, ranging from 2.3 (Vouksi) to 3 (Lestijoki) years.
During 1911–2020, the number of > 1 events (occurrence of absolute high flow during fall) showed a declining trend in the Kokemäenjoki, Vouksi, and Kymijoki rivers located in southeastern Finland (table 2). However, this pattern reversed after that, and this number exhibited a positive trend in the Vouksi and Kymijoki rivers during the 1991–2020 period. Additionally, the Lestijoki, Kyrönjoki, and Kalajoki rivers experienced a positive trend in the number of > 1 events from 1911 to 2020. According to table 2, the Vouksi, Lestijoki, Kymijoki and Kyrönjoki rivers exhibited the lowest return periods of > 1 events, ranging from 3 to 6 year during 1991–2020 period. In contrast, the Kyrönjoki and Kalajoki had the highest return periods, ranging from 25 to 50 years during the 1911–2020 period.
Table 2. The number/return period of the flow regime with double peaks ( > 1) in southern Finland.
| River | 1911–1960 | 1961–1990 | 1971–2000 | 1981–2010 | 1991–2020 |
|---|---|---|---|---|---|
| Kymijoki | 7/7.1 | 5/16 | 6/5 | 5/6 | 8/3.75 |
| Kyrönjoki | 2/25 | 4/7.5 | 6/5 | 7/4.3 | 8/3.75 |
| Kalajoki | 1/50 | 1/30 | 1/30 | — | 3/10 |
| Kokemäenjoki | 6/8.73 | 4/7.5 | 4/7.5 | 4/7.5 | 3/10 |
| Vouksi | 6/8.73 | 2/15 | 3/10 | 4/7.5 | 5/6 |
| Lestijoki | 3/16.6 | 3/10 | 3/10 | 4/7.5 | 5/6 |
Increasing base flow and/or average flow has contributed significantly to annual maximum flow in southeastern Finland during the fall and winter.
The number of < 1 events (occurrences of absolute high flow in summer) showed a positive trend in the Kokemäenjoki and Kalajoki rivers during 1911–2020. Moreover, the Kyrönjoki river experienced a decreasing trend in the number of this event, while this pattern reversed to an increasing trend during 1991–2020. The Kalajoki and Kyrönjoki rivers showed positive tendencies in the occurrence of annual maximum flow in the mid-summer ( < 0.9) throughout the 1911–2020 period. For the Lestijoki, Vouksi, and Kymijoki rivers, this pattern reversed to a negative trend during the recent decades (1991–2020). Given that increasing summer flow caused by higher rainfall can cause a major delay in QHA, the observed variation in flow regimes can be attributed to a changing climate.
4. Discussion and conclusions
Due to a lack of confidence regarding the sign and magnitude of spatiotemporal trends in Finnish flow regimes, this study advances previous studies (i.e. Hyvärinen 2003, Korhonen and Kuusisto 2010, Ahmed et al 2020) by presenting a comprehensive insight into the long-term changes in cold hydrologic extremes (i.e. the timing and magnitude of inter-annual variability in low/high flows). To date, a wide range of hydrological indices (variables) have been identified to quantify the spatial and temporal variations in flow regime. Such indices, however, have failed to capture the interannual variabilities and temporal shifts in river flow regimes. This study hence offered some important insights into long-term assessment of inter-annual variability and temporal shifts in hydrologic extremes.
One of the most significant findings to emerge from this study is that in the most rivers there is a good consistency between trends across the studied indices. This implies that changing trends in the river flow regimes generally indicate wetter or drier conditions. The declining tendencies in the magnitude and timing of annual maximum flow were prominent for Arctic hydrologic changes under global warming.
Our results indicate a complexity in spring peak flow (QHS) due to spatiotemporal variability in snowpack melting rate under faster warming mediated by climate over the last century. Earlier and slower snowmelt caused by faster warming is known to be one of the most critical changes in studied rivers located in the sub-Arctic regions. However, a warming world may result in earlier and faster snowpack ablation in freezing climates like Northern Finnish Rivers.
Another feature of the results is that the alteration of low pulses in most rivers is associated with an increase (decrease) in winter (summer) flows, suggesting the annual minimum flow in summer frequently contradicts natural hydrologic regimes in Finnish Rivers. However, an increasing tendency in summer low flows (QLS) is the main reason for maintaining natural low pulses with no significant change in Northern rivers. The study has also shown that extreme hydrology did not changing uniformly which means that the detected trends in TPI, IRI, and LSW during 1911–1960 have reversed, suggesting high‐frequency interannual variability in high/low flows during 1961–2020 as the most pronounced period. The associated changes confirm the flow regime features in Finnish rivers due to global warming.
This study has also shown that the seasonal occurrence of maximum annual flows in sub-Arctic regions (southern Finland) has varied over the study period, leading to a new flow regime characterized by dual peak flows. The positive trend in the return periods of this altered flow regime, implies that rivers regime located in Southern Finland has primarily been affected by climate change and variabilities.
The findings reported here shed new light on hydrological change in rivers, including snow-melt regimes and associated streamflow hydrology, which is so crucial for effective water resource management under climate change. Moreover, the alteration of Finnish rivers' regimes significantly affects the socio-economic and bio-physical sub-systems within the river basin. This is the first study of a substantial duration which quantifies the associations between extreme (high/low) flows in different seasons, emphasizing the importance of site-specific strategies based on a holistic spatiotemporal analysis of hydrological extremes across Finnish catchments.
Acknowledgments
The research presented in this paper received funding from Maa- ja vesitekniikan tuki ry (MVTT, Grant No. 43588). The first Author also acknowledge the Arctic Interactions research profile action of the University of Oulu for supporting his stay and granting this research grant at the University of Oulu.
Data availability statement
The data analysed during the current study are not publicly available but are available from the corresponding author on reasonable request.
Supplementary data (6.5 MB DOCX)