

Abstract
Rural–urban migration and the growing carbon footprints (CFs) will challenge the world in keeping the global average-temperature increment below 1.5 °C compared to preindustrial levels. We first quantified the CFs of migrant consumption in 30 Chinese provinces in 2013 and 2015. An integrated approach was developed to match the Chinese multiregional input–output table with household survey data covering 200 000 migrant survey samples. Furthermore, we adopted the three shared socioeconomic pathways (SSPs) to explore the carbon budgets and trajectories of the migrants and permanent residents to align with the 1.5 °C climate target. The results suggest that the average migrant CFs ranged from 2.3 to 2.6 tCO2e per capita in 2015. To align with 1.5 °C pathways, the emissions of migrants should be held below 3.4 tCO2e per capita under the 12 SSPs–1.9 scenarios from 2020 and keep decreasing to net-zero before 2050. To ensure citizenry progress in improving well-being without overshooting dual carbon targets, high-emitting migrants need to reduce their emissions substantially.
Export citation and abstract BibTeX RIS

Original content from this work may be used under the terms of the Creative Commons Attribution 4.0 license. Any further distribution of this work must maintain attribution to the author(s) and the title of the work, journal citation and DOI.
1. Introduction
China has pledged to achieve carbon peaking before 2030 and carbon neutrality by 2060, and the detailed plan has been incorporated in the 14th five-year plan (2020–2025) (Renmin News 2021). One of the challenges in achieving these targets is to mitigate the increasing emissions associated with domestic migration (Sadorsky 2014, Zhang et al 2015, Franco et al 2017). Domestic migration promotes the growth of the urban population for developing countries (Tiwari 2008, Komatsu et al 2013), and therefore increases the energy demand in urban areas (Zhang et al 2016, Kanemoto et al 2020). The impact on the size and structure of the population among regions caused by migration will lead to changes in future carbon emissions (Qi and Li 2020). However, China has no mitigation policy or official accounting system to monitor the increasing emissions associated with domestic migration, which may threaten the climate targets.
Domestic migration has triggered changes in household emission patterns at the sectoral and spatial levels. Consumption habits (Shi et al 2020), income level (Chen et al 2015), and consumption-based energy use (Herrerias et al 2017) of migrants may change during the migration process. The effects of migration make it more challenging to achieve the mitigation target. Thus, changes in household emissions due to migration needs to be investigated at regional and sectoral levels.
The scale and trend of emission impacts from migrants in China remain largely unknown. The added migrants will become the local residents in inflowing regions with an accelerating 'citizenry of rural migrants' 4 in China (NDRC 2019). The emissions from migrant 5 consumption will put tremendous pressure on China to meet its climate targets (Luo et al 2016). However, the change in the population structure has not been well integrated into long-term scenario analysis (Liu et al 2020). Climate change studies require consistent sets of Chinese population structure projections in the urbanization progress to support emission analysis and mitigation options (Liu et al 2020). Thus, the migrant emissions should be integrated into the scenario framework (Neill et al 2014) to evaluate the possibility of allowing the Chinese urbanization process at a level consistent with the global-mean temperature below 1.5 °C.
We provide more details on expenditure-based carbon footprints (CFs) of migrants than existing cross-province measurements (Qi and Li 2020, Shi et al 2020, Gao et al 2021), with the highly detailed household surveys, and enable an in-depth analysis of discrepancies between socioeconomic groups and their emission patterns. Furthermore, while there has been considerable work on spatial details of migrant energy use (Luo et al 2016) and carbon emissions (Qi and Li 2020, Gao et al 2021), conclusions have generally been drawn from aggregate-level assessments under a macro scope. Previous findings uncover the emission transfer characteristics by considering urbanization (Liu et al 2020), geographic location (Shi et al 2020, Gao et al 2021) and energy structure (Qi and Li 2020). We aim to provide more detailed emission patterns of the migrants from a socioeconomic perspective that has never been analyzed before and estimate emission budgets of each pattern under 1.5 °C mitigation pathways.
2. Literature review
There is little study investigating the indirect emissions embodied in migrant consumption and the emissions disparity among regions (Ru et al 2015, Qi and Li 2020). Only a few studies have associated migrant consumption with single-region input–output (SRIO) or national IO method to evaluate indirect emissions (Fan et al 2016, Chen et al 2019a). Examining the emissions embodied in imports via the SRIO approach generates an error due to the strict assumption of technical consistency among regions (Wiedmann 2009, Chen et al 2019b). By contrast, the environmental extended multiregional input–output (EE-MRIO) method has been widely applied in household emissions (Steen-Olsen et al 2016, Ivanova and Wood 2020), since it can portray the entire economic system that provides goods to satisfy the final demand (Wiedmann 2009). Thus, EE-MRIO is also highly appropriate for analyzing the migrant CFs (MCFs).
More accurate and objective studies about the migrant-environment relationship are required since they involve policy implications of emission reduction and migrant development. Despite the high level of detail of the EE-MIRO, using it to estimate the complete MCFs is still problematic due to the lack of research on many migrant consumption activities. Meanwhile, pure EE-MRIO can neither address the effects of specific lifestyle choices nor evaluate the effectiveness of certain emission reduction proposals (Steen-Olsen et al 2016). However, the household survey provides richer data on consumer expenditure, popularly investigated by social scientists to understand household consumption behaviors (Ivanova et al 2016, Li et al 2019). Thus, by extending the MRIO with microsurvey data (MSD), more detailed patterns of migrant consumption can be analyzed to determine strategies for achieving a sustainable society. However, a detailed analysis of migrant emissions is lacking in most MSD/IO studies.
The latest COP26 (the 26th UN Climate Change Conference of the Parties) states that the globe would still keep the 1.5 °C target alive if nations could translate their commitments into rapid action (UN 2021). However, there is no 1.5 °C carbon budget and trajectory for migration in the context of China's urbanization. Intergovernmental Panel on Climate Change (IPCC) proposed the shared socioeconomic pathways (SSPs) in 2010 to shape different development paths of the future socioeconomic system (Moss et al 2010), including five pathways: sustainable development (SSP1), business as usual (SSP2), regional rivalry (SSP3), inequality (SSP4), and fossil-fueled development (SSP5) (Moss et al 2010). This framework has been widely applied, and significant progress has been made (Jiang and O Neill 2017, Li et al 2021) because it can reflect the association between socioeconomic development modes and climate change risks (Rothman et al 2014). The SSP-1.9 scenarios have provided 1.5 °C carbon budgets and trajectories globally (Rogelj et al 2018), focusing on the design of global storylines (Riahi et al 2017, Kok et al 2019), quantitative simulation of SSP elements (Fricko et al 2017, Marangoni et al 2017), and assessment of climate change impact (Hewitt et al 2020, Tong et al 2020). However, little attention has been paid to extending the global storyline to migration-related studies (Gibb and Ford 2012) and quantifying the related elements (Yuwei et al 2020).
To understand the main emission patterns of migrant consumption and explore future mitigation strategies, we first developed an integrated approach combining the EE-MRIO model with MSD (including China Migrants Dynamic Survey (CMDS) and China Household Finance Survey (CHFS)) to examine MCFs based on their consumption data. Based on samples covering 30 provinces in 2013 and 2015, we analyzed the emission characteristics of migrants at different income levels for eight consumption types. Then we compared the discrepancy in emission between them and permanent residents (with Hukou). Furthermore, we explored the urbanization pathways limiting the 1.5 °C goal for Chinese households (including migrants and permanent residents). The SSP-1.9 scenarios were downscaled to a household level to benchmark the CF trajectories in China with data from the SSPs and Integrated Assessment Modeling (IAM) Database (IIASA 2021).
3. Material and method
The increase in the migrant citizenry and the changes in CFs need to be assessed using the characteristics of MCFs in various dimensions. While the impact of demographic changes on future emission reductions is little known. To shed light on issues (figure 1), this paper illustrates the construction process of EE-MRIO models and three different SSPs to measure the mitigation potential of migrant emissions and the possibility of achieving carbon targets. An analytical framework is recommended to conduct similar studies in developing countries to obtain more evidence on the impact of population transition on carbon emissions during urbanization.
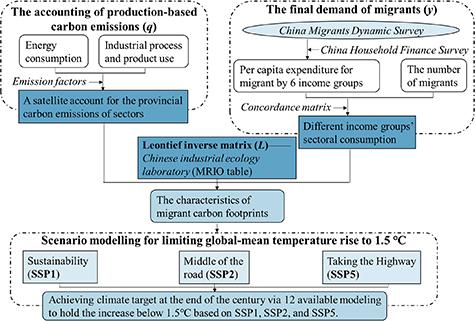
Figure 1. Analytical framework estimating MCFs and exploring pathway to keep the global-mean increase below 1.5 ℃.
Download figure:
Standard image High-resolution image3.1. EE-MRIO model
The MRIO model is considered the most effective method to explain environment-related impacts from a consumption perspective and to quantify the interdependencies between pollution intensities and various sectors with different production technologies (Wiedmann 2009). In this framework, the carbon emissions Q emitted by migrants or permanent residents (including rural and urban residents) consumption are calculated by EE-MRIO (Miller and Blair 2009):

where q is a diagonal matrix of carbon intensity (A.2.1); L is the Leontief inverse matrix, which reveals the comprehensive economic links between regions and sectors (Leontief 1936); y is the matrix of the final demand, which includes the consumption level for migrants or permanent residents (A.2.3) of each province.
We adopted the concept of the CFs (Wiedmann and Minx 2008) to represent a holistic accounting of the carbon emissions of migrants. The MCFs driven by migrant consumption are quantified, and the CFs of rural residents (RCFs) and urban residents (UCFs) are treated similarly. The MRIO tables for 2013 and 2015 were obtained from the Chinese Industrial Ecology Laboratory (IELab) (Wang 2017). We only use intraregional and interregional economic transactions within China's economic boundary to estimate the MCFs, RCFs and UCFs.
3.2. Scenario design
SSPs have become a widely accepted framework for understanding and discussing climate change outcomes (Kamei et al 2021). The SSP-1.9 pathways that can reach the goal of keeping 1.5 °C at the end of this century include SSP1, SSP2, and SSP5 (IIASA 2021). These SSPs offer the potential to continue the current trend and to implement great sustainability. We decomposed the carbon budget from global modeling scenarios to Chinese households considering the population and urbanization rate change from the IPCC/IAM database (IIASA 2021).
The key parameters to quantify future trends of each SSP pathway were designed by referring to official institutions and previous studies (A.2.5). In the SSPs, the parameters for urbanization rate and demographic change in the SSPs were set according to the development described in the SSPs key elements (Liu et al 2020), as shown in table A.10. The emission trajectory data during 2020–2100 were selected from the IPCC/IAM database (IIASA 2021), and downscaled to Chinese households. The related split ratio for China is based on China's emission portion of the total global emissions obtained from the Emissions Database for Global Atmospheric Research (EDGAR 2021). The parameter choices are consistent with the narratives of the SSP-1.9 scenarios.
4. Results
4.1. Spatial and sectoral MCF accounting
4.1.1. Role of migrants in emission reduction
MCFs have become a non-negligible barrier for China to achieve carbon targets. Migrants accounted for only 18.0% of the total population but drove 22.4% of household CFs in 2015. This number is equal to 634.6 Mt CO2 equivalent (MtCO2e), or 6.5% of the total carbon emissions of China (Shan et al 2018). Thus, due to the accelerated urbanization in China, migrant consumption should be substantially decarbonized to contribute to mitigation targets (Qi and Li 2020). The Chinese government is vigorously promoting urban-rural integration to boost domestic demand, and 100 million migrants are expected to settle in cities in the future (NDRC 2019). As a result, appropriate urban planning and climate policies must be formulated to mitigate emissions and other environmental issues. In particular, low-carbon urban planning (such as spatial layout, green buildings, and low-carbon transportation facilities) has become essential means to cope with global climate change (Khan et al 2020).
Under the current urbanization policies of China, the reduction in MCFs becomes more challenging with the expectation that more rural residents will join the migration. The average CFs of migrants in 2013 (figure 2(a)) and 2015 (figure 2(b)) were 2.3 tCO2e per capita and 2.6 tCO2e/cap, respectively, with an average annual growth rate of 6.3%. During the research period, the per capita MCFs were much higher than those of rural residents (average RCFs are 0.9 tCO2e/cap and 1.0 tCO2e/cap, respectively), but significantly lower than urban residents (average UCFs are 2.8 tCO2e/cap and 3.0 tCO2e/cap, respectively) in most areas. In 2021, about 35.3% of the population continued living in rural areas, and the migration of the rural population will significantly increase the household CFs with the projection of a nearly 80% urbanization rate in 2060.
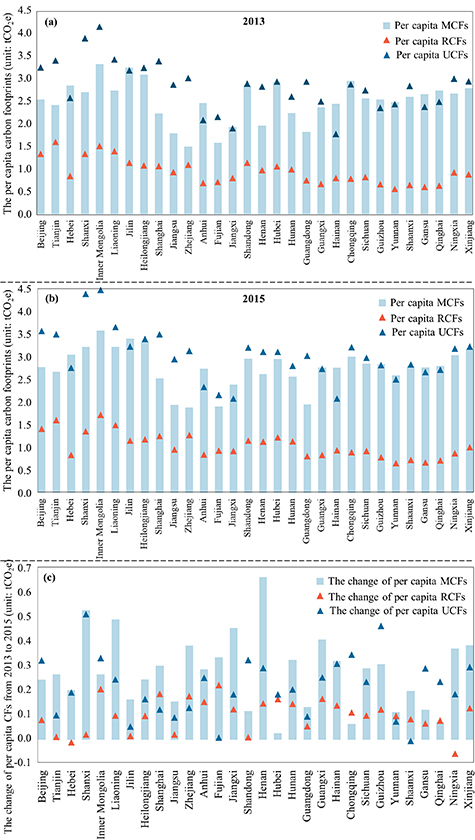
Figure 2. Comparison of the per capita MCFs, UCFs and RCFs in 2013 (a) and 2015 (b), and the changes in the per capita footprints from 2013 to 2015 (c).
Download figure:
Standard image High-resolution imageThe rapid growth in MCFs is another challenge. 21 energy-intensive or heavy industrial provinces have much higher per capita MCFs growth than the RCFs and rural UCFs (figure 2(c)). From 2013 to 2015, the per capita MCFs of all provinces increased, especially in Henan Province, a major railroad junction and industrial center, which experienced considerable growth (0.7 tCO2e/cap) compared to the change in per capita RCFs (0.1 tCO2e/cap) and UCFs (0.3 tCO2e/cap). Shanxi (0.5 tCO2e/cap) and Liaoning (0.5 tCO2e/cap) follow closely behind in terms of MCFs growth. More remarkably, the changes in per capita UCFs in Beijing (0.3 tCO2e/cap), Inner Mongolia (0.3 tCO2e/cap), Shandong (0.3 tCO2e/cap) and Guizhou (0.5 tCO2e/cap) exceeded those MCFs and RCFs, indicating that the migrants in these areas have not yet become the primary driver of emission increases.
4.1.2. Regional mitigation potentials for MCFs
The east coast has the most considerable mitigation potential, as it accounts for most of the total MCF (figure 3(a)). Guangdong Province, with a large number of migrants (11.3%), contributed 54.6 MtCO2e (8.6%) to the MCFs in 2015. Guangdong attracts migrants due to its highly developed manufacturing industries providing plenty of jobs (Wang 2019), followed by Shandong (38.5 MtCO2e), Zhejiang (36.2 MtCO2e), and Jiangsu (33.8 MtCO2e) provinces. Henan and Anhui provinces, inland provinces with relatively large migrants, contributed large amounts to the MCFs, at 44.8 MtCO2e and 38.1 MtCO2e, respectively.

Figure 3. MCFs in 2013 and 2015. The blue map shows the total MCFs in each region, while the red map shows the per capita MCFs. Darker colors in the map indicate higher MCFs.
Download figure:
Standard image High-resolution imageThe per capita MCFs greatly varied among regions, and the less-developed inland provinces usually attained a higher value than the well-developed coastal provinces (figure 3(b)). In 2015, some of the poorer provinces in northern China exhibited more than 3.0 tCO2e/cap. For example, Inner Mongolia, a poor energy-intensive inland province, reached the highest value at 3.6 tCO2e/cap, almost twice as much as Zhejiang (1.9 tCO2e/cap), highlighting the service-oriented nature of the economies in eastern China, followed by Jilin (3.4 tCO2e/cap) and Heilongjiang (3.3 tCO2e/cap). Jiangsu, Fujian, and Guangdong provinces, which are on the eastern coast and economically well-developed, attained per capita MCFs of 1.9–2.0 tCO2e/cap. The differences in carbon intensity across Chinese provinces (Zhang et al 2020) induce a substantial variation in migrant consumption. Therefore, at the current rate, the government should focus on coastal areas with high total emissions and inland regions with relatively high per capita emissions.
The eastern provinces provide employment opportunities and high wages due to the highly developed economies and perfect industry supply chains, attracting large numbers of interprovincial migrants from inland provinces (Qi and Li 2020). The migrants in northern China, with a higher per capita MCFs and growth, mainly rely on fossil fuels as the basic energy source. Nevertheless, in the south, electricity plays a key role (Herrerias et al 2017) in the lives of migrants with low per capita MCFs. A two-pronged policy should focus on controlling the total MCFs in the east and reducing the high per capita MCFs in the inland areas.
The average emission values of migrants (2.3 tCO2e/cap and 2.6 tCO2e/cap in the study years) in this study are similar to the results of Golley and Meng (2012) (2.3 tCO2e/cap) and Cao et al (2020) (2.0 tCO2e/cap). Per capita MCFs values at the regional level are similar to those reported in previous studies (Song et al 2014, Wu et al 2019, Mi et al 2020) (table A.8). The results are slightly higher than those reported by Fan et al (2016) (0.8 tCO2e/cap) and some other studies (Wiedenhofer et al 2017, Xia et al 2019, Wang and Chen 2020) on rural and urban residents in China. The increase can be explained from two perspectives. First, this study is based on more recent data in which the consumption expenditure of migrants in recent years is higher than in previous years. Second, the satellite accounts in this study include the carbon emissions from energy consumption (often the only data set in most of the existing research) and industrial process and product use. Moreover, per capita MCFs calculated in this study is lower than that of Zhang et al 2016 (4.0 tCO2e/cap and 5.6 tCO2e/cap for rural and urban migrants, respectively), which is probably because they employed the 2007 emission factor when calculating the MCFs in 2010. In contrast, the factors in the early years are relatively large (Mi et al 2020). In general, this study is consistent with prior findings.
4.1.3. Sectoral mitigation potentials of MCFs
This section analyzes the sectoral emissions separately from production to final consumption. In 2015, the per capita expenditures of migrants on housing (1.2 tCO2e/cap) and food (0.8 tCO2e/cap) contributed over 75% to the per capita MCFs (figure A.7), indicating a lower living standard of migrants. Housing consumption drove emissions in energy-intensive sectors such as energy (0.7 tCO2e/cap), smelting (0.3 tCO2e/cap), and mining (0.1 tCO2e/cap). Real estate is a capital-intensive sector requiring a considerable amount of construction and building materials, which can result in high levels of emissions (Feng and Hubacek 2016). Food, accounts for a large proportion of the overall MCFs due to the emissions of food-related industries, such as food (0.3 tCO2e/cap), agriculture (0.2 tCO2e/cap) and wholesale (0.2 tCO2e/cap). However, in 2013 and 2015, the contribution of the non-necessary (table A.2) consumption of migrants was not high (only 19.2% and 20.9%), respectively.
Migrants consume a large portion of their total expenditures on necessities (Chen et al 2015), implying less spending on low-carbon non-necessities. In particular, migrants hold a higher-level emission in housing when migrating from developing to developed provinces (Qi and Li 2020). Thus, the government must develop new building complexes for future migration by implementing low-carbon technologies and considering affordability and quality (Chen 2018). The other key mitigation strategy should focus on the food sectors by adopting decarbonization technologies in food processing and its supply chain.
4.1.4. MCFs at different income levels
The migrants in the upper-poor group had the most significant emissions, while the MCFs gap varied considerably between rich and poor groups (figure 4(a)). The upper-poor group, accounting for 37.8% of Chinese migrants, contributed 32.6% to total MCFs in 2015, while their per capita MCFs only amounted to 2.3 tCO2e/cap. The lower-rich migrants (3.1 tCO2e/cap), accounted for 29.1% of the MCFs. Above two groups had much lower per capita MCFs than the rich and very rich groups. Due to the significant levels of income inequality in China, the richest migrants, i.e. the top 1.0%, contributed 7.3 tCO2e/cap to the per capita MCFs. The MCFs proportion of the very rich group was approximately three times that of their population proportion. In contrast, the very poor group (1.0 tCO2e/cap), contributed only 0.8% to the total MCFs. Both the total and per capita MCFs of the very poor declined from 2013 to 2015 due to the decrease in the number of migrants and the use of low-carbon technology.

Figure 4. Disaggregated the total MCFs and per capita MCFs by the consumption category at different income levels for the migrants. The top graphs depict the total MCFs, and the bottom graphs show the per capita MCFs in 2013 and 2015.
Download figure:
Standard image High-resolution imageEliminating poverty among migrants to ensure their essential well-being is as important as emission reduction. Therefore, the primary task of citizenization is to improve the well-being of migrants, and the resulting environmental impact can be offset by enhancing low-carbon technologies. For high-income migrants, however, policies should help to significantly cut carbon emissions (e.g. imposing a carbon tax). Also, we should especially pay attention to intermediate-income groups with massive emissions as as their higher living standards and related welfare policies will significantly increase emissions.
The emissions driven by the necessity goods consumption of migrants accounted for a large proportion of the total MCFs (figure 4(b)). In 2015, necessities such as food and housing, accounted for more than 76% of the total MCFs for all groups except the very rich group. Clothing played a minor role (2.3%) in the total MCFs of all groups. However, the MCFs were relatively low in non-necessity consumption. The MCFs shares of the three rich groups (36.8% of the migrants) driven by non-necessity consumption are as follows: appliances (56.5%), transport (58.9%), healthcare (57.9%), education (58.8%) and others (58.8%). Furthermore, the very poor and poor groups (25.4%) together contributed less than 14% of emissions in each unnecessary consumption. Overall, these patterns have been validated across various regions.
Average MCFs in eight consumption categories vary significantly between income groups. Migrants with lower incomes spend more on food and housing, and consume fewer low-carbon goods and services. For rich migrants, more carbon emissions embodied non-necessities are associated with their spending, such as transportation communication. Therefore, policies enabling migrants to enjoy education and health with low embodied emission share are an important contribution to climate change mitigation.
Currently, most migrants are not eligible for the same healthcare insurance as local residents, resulting in restrictions on healthcare spending. As a result of these restrictions, migrants have a stronger motivation to save as a contingency measure, i.e. consuming fewer unnecessary goods and services (Chen 2018). However, under the condition of the fixedness of low-carbon technologies for consumer goods, the implementation of rural–urban citizenry that promotes the migrants to live and work permanently in urban areas will release their consumption potential (i.e. stimulating migrants to consume more non-necessities) and increase carbon emissions (Kanemoto et al 2020, Liu et al 2020). Such policies will encourage migrants to improve their well-being, but at the same time should also promote education programs on low-carbon consumption.
4.2. 1.5 °C carbon footprint targets
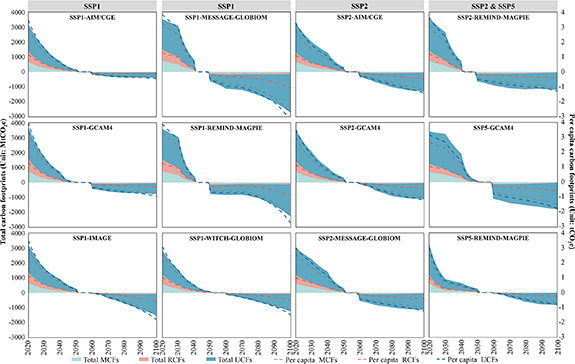
While CFs of migration have great mitigation potential at the sectoral and spatial levels, the SSP analysis can still provide emissions reduction insights from a temporal perspective. In 1.5 °C pathways, the CF budgets of urbanized populations are downscaled from 12 SSP-1.9 models (figure 5). Before reaching net negative emissions in 2050, starting from 2020, the upper limits of per capita carbon budget for migrants (2.5–3.4 tCO2e), urban residents (3.0–4.0 tCO2e) and rural residents (1.0–1.3 tCO2e) across the 12 models are maintained in a wide range. For example, in the most optimal scenario SSP5-REMIND-MAGPIE, the budget of per capita UCFs (3.0 tCO2e) also exceeds that of RCFs (1.0 tCO2e) and MCFs in 2020 (2.5 tCO2e). Similar rankings appear in other scenarios with various model parameters and extreme values.
Figure 5. The household (including migrants, rural residents and urban residents) carbon pathways under 12 SSP-1.9 scenarios. Shaded areas show the total CF pathways of the three groups while dashed lines represent their per capita CF pathways from 2020 to 2100.
Download figure:
Standard image High-resolution image
In all SSP-1.9 scenarios, the household CFs should achieve the net-zero target before 2060 and compensate for temporary temperature exceedance by negative emission technologies over the next decades. For SSP1-MESSAGE-GLOBIOM, SSP1-REMIND-MAGPIE and SSP2-REMIND-MAGPIE, these 1.5 °C pathways could reach carbon offset in 2040, decades ahead of other paths, which is decades earlier than the carbon-neutrality time China promised. This means that meeting the 1.5 °C goal requires a stringent mitigation trajectory towards near-term transformation to net-zeros, which can be achieved through more investments in low-carbon technologies, and carbon capture and storage (CCS) (Riahi et al 2021) to reach negative emissions in the second half of this century.
The cumulative CFs should remain within the budget in all scenarios over 2020–2100, consistent with the given 1.5 °C target. The emission pathways produce an extensive remaining carbon budget before achieving net-zero emission across the scenarios, from 31.9 GtCO2e to 66.5 GtCO2e, to systematically explore the emission budget of climate targets for Chinese households. This carbon budget would be finished between 11.2 and 23.4 years if the annual CFs for Chinese households remained at the same level as in 2015. Thus, the only way for Chinese households to fulfill the 1.5 °C target in 2100 is to achieve carbon neutrality between 2027 and 2038.
Moreover, all 1.5 °C pathways of SSP-1.9 models require achieving net-zero emissions by 2050, implying that 'dual carbon target' of China may need to include specific mitigation targets for households to limit the global mean-temperature increase below 1.5 °C. Currently, in the energy sector, many regulations and development plans (MEE 2020) have been implemented to cut down carbon emissions, which will indirectly influence household CFs. The relative technologies and apparatus in storing pumping and new energy are being vigorously exploited (NEA 2021). For the industry sector, MIIT (2021) has set specific targets for low-carbon development in the 14th period to comprehensively promote carbon peak, such as reducing CO2 emissions per unit of industrial added-value by 18%, and promoting thousands of green products, etc. In addition, increasing investment in technological innovation such as CCS and carbo-dioxide removal (CDR) technologies also help achieve ambitious emission goals (Rogelj et al 2018).
5. Conclusions
An integrated approach with emission inventory and MSD from multiple data resources was constructed by EE-MRIO to better estimate the nature and differences of migrant emissions in different dimensions and to more accurately reflect their income level and consumption behavior. Further, we explored the current challenges associated with a change in population structure and urbanization in China to seek a low-carbon transformation roadmap for the 1.5 °C goal. The results indicate that the emission growth of migrants in most provinces is faster than that of permanent residents, and the per capita MCFs are higher than that of rural residents. We also underpinned that there are disparities in aggregate and per capita levels of migrant emissions across provinces, with differences in per capita MCFs of up to 7 times across the different income groups. In addition, 1.5 °C pathways require carbon emission to be peaked and decreased from 2020 to achieve dual-carbon goals. The analytical framework proposed in this study can serve as an empirical example to evaluate the effect of migration on carbon emissions and to limit the global average temperature increase below 1.5 °C during the urbanization of other developing countries.
In the context of urbanization, sustainable and green consumption patterns should be put on the agenda along with improving the well-being of the migrants. Citizenization policies, while dedicated to prompting migrants access to education, health insurance and other public services, should also restrict the increase in emissions generated by their consumption, especially for high-income groups. The government should encourage the poor to spend reasonably on daily necessities by granting subsidies, and imposing low tax rates on necessities while imposing high taxes on luxury products to limit the excessive consumption of the high-income groups. The migrants should also be inspired to use durable products, recycled goods, and low-carbon alternatives. In addition, for populous and high-emitting provinces, emissions are likely to increase further due to the migration of urban social security systems, requiring significant emission reductions. The carbon budget allocation results indicate a negative future budget for households, urgent action in the decarbonization race should be implemented through an accelerated net-zero pathway.
In addition, there are still some limitations of this study, such as the uncertainty in the matching between CMDS and CHFS databases (A.4.1), as well as the MRIO table (A.4.2).
Acknowledgments
This work was supported by the Youth Program of National Philosophy and Social Science Foundation of China (Grant No. 21CTJ017) and Major Program of National Philosophy and Social Science Foundation of China (Grant No. 16ZDA051). We thank Dr Yuhan Zhu and Dr Qiao Huang for valuable advice on manuscript revisions.
Data availability statement
All data that support the findings of this study are included within the article (and any supplementary files).
Footnotes
- 4
'Citizenry of rural migrants' aims to help more rural-migrants who currently live in cities but lack an urban household registration (Hukou) to transform into urban residents (NDRC 2019).
- 5
Massive migration living in cities without local Hukou has occurred in the urbanization progress of China, and the majority involves migrant workers moving from rural to urban areas (Fan et al 2016, NHC 2018). Only a small fraction of the migrants flowed from developing cities to developed counterparts (Qi and Li 2020).
Supplementary data (2.0 MB PDF)
Supplementary data (0.3 MB XLSX)