

Abstract
The Amazon biome is being pushed by unsustainable economic drivers towards an ecological tipping point where restoration to its previous state may no longer be possible. This degradation is the result of self-reinforcing interactions between deforestation, climate change and fire. We assess the economic, natural capital and ecosystem services impacts and trade-offs of scenarios representing movement towards an Amazon tipping point and strategies to avert one using the Integrated Economic-Environmental Modeling (IEEM) Platform linked with spatial land use-land cover change and ecosystem services modeling (IEEM + ESM). Our approach provides the first approximation of the economic, natural capital and ecosystem services impacts of a tipping point, and evidence to build the economic case for strategies to avert it. For the five Amazon focal countries, namely, Brazil, Peru, Colombia, Bolivia and Ecuador, we find that a tipping point would create economic losses of US$256.6 billion in cumulative gross domestic product by 2050. Policies that would contribute to averting a tipping point, including strongly reducing deforestation, investing in intensifying agriculture in cleared lands, climate-adapted agriculture and improving fire management, would generate approximately US$339.3 billion in additional wealth and a return on investment of US$29.5 billion. Quantifying the costs, benefits and trade-offs of policies to avert a tipping point in a transparent and replicable manner can support the design of regional development strategies for the Amazon biome, build the business case for action and catalyze global cooperation and financing to enable policy implementation.
Export citation and abstract BibTeX RIS

Original content from this work may be used under the terms of the Creative Commons Attribution 4.0 license. Any further distribution of this work must maintain attribution to the author(s) and the title of the work, journal citation and DOI.
1. Introduction
In the last seven decades, both human occupation and deforestation in Brazil have been advancing from the southern extent of the Amazon biome towards its center [1, 2]. Over this period, close to 20% of the Amazon biome has been converted from forests to other land uses [3] and at least 17% of the remaining forest has been disturbed since 1995 [4]. The hydrological cycle of the Amazon depends on the internal cycling of water where as much as 75% of precipitation is recycled back to the air through evapotranspiration. Deforestation and fire disrupt this cycle by reducing net surface radiation and evapotranspiration [5], increasing rainfall runoff and land surface temperature, and ultimately reducing rainfall [5–10].
Together, the feedbacks between climate and continued deforestation could lead to an irreversible situation that is the focus of this paper: a tipping point beyond which large areas of the Amazon no longer have sufficient rainfall to support broadleaf evergreen forests [11–16]. As the disruption of the hydrological cycle reduces moisture availability for both native and cultivated plants, the region's ecosystems could shift towards lower biomass communities characteristic of drier climates or more disturbed environments. This tendency towards degradation of forest ecosystems and favoring of derived svanna has already been observed in some regions of the eastern and southwestern Amazon. [17, 18]
The shift to degraded, grass-dominated systems [19, 20] is accelerated by existing trends—reduced rainfall, increasing temperatures, increasing drought frequency and intensity, and increasing forest fires [5, 21–23]. With more frequent anthropogenic fires, the likelihood of forest dieback increases considerably [24]. Several studies have investigated the deforestation threshold that would cause a tipping point in the Amazon biome and, while some authors view the tipping point as imminent [22], others have estimated that it would take deforestation of 40% or more of the Amazon Basin to push the system over the threshold [23, 25–27].
A tipping point for the Amazon would result in losses of biodiversity and critical material and non-material ecosystem services, which are the benefits people derive from nature [28]. Material ecosystem services include agricultural and forest product output and water supply while non-material ecosystem services include carbon storage, nutrient retention in biomass and soils [29], water regulation and soil retention. With a reduction in natural capital stocks (the physical stock of forest and soil, for example) and ecosystem service flows, inter-generational wealth (the current and future stock of natural, human and physical capital) and well-being would be affected dramatically as we will show here.
Measures to avert a tipping point include strongly reducing deforestation, the sustainable intensification of agricultural systems on already cleared land [30], expanding silvopastoral and agroforestry systems [31], extensive reforestation of low productivity land [22], improved fire management [21] and strengthening forest-based livelihoods [32, 33]. If adopted at scale, these nature-based solutions are capable of reconciling inclusive socioeconomic growth with the stabilization of the regional hydrological system and mitigating global climate change [34].
In the literature, there is a gap in understanding of the potential costs of approaching a tipping point and the benefits of policies to avert one. We fill this gap by quantifying the economic, natural capital and ecosystem service impacts of approaching an Amazon tipping point through a set of concepts and macroeconomic indicators commonly used by Ministries of Finance and Planning as well as multi-lateral lending institutions—institutions whose support would be critical in designing and financing policies to avert a tipping point. We quantify the macroeconomic costs and benefits derived from the implementation of strategies to avert a tipping point at a multi-national scale. Our assessment goes beyond a conventional benefit-cost approach by applying the Integrated Economic-Environmental Modeling (IEEM) Platform to five countries in the region. We translate demand for land as a factor of production from IEEM's environmental-economic modeling into spatially explicit land cover changes through land use-land cover (LULC) change modeling and, using spatial Ecosystem Services Modeling (ESM), evaluate changes to natural capital stocks and ecosystem service flows that drive broader social and economic impacts [35, 36].
We focus on the Amazon biome countries with the largest economies for which reliable economic and environmental data exist—namely Brazil, Peru, Colombia, Bolivia and Ecuador—to estimate the effect of different scenarios on standard economic indicators such as gross domestic product (GDP), trade, income and employment, as well as other robust indicators of economic development including well-being and wealth metrics [37–42]. Our measure of wealth is based on genuine savings [43, 44] and accounts for scenario-driven changes in natural capital and damages from greenhouse gas emissions. In addition, we estimate effects on natural capital stocks and ecosystem service supply, specifically: carbon storage, nutrient and sediment retention, and water supply. Estimates of the effects of our policy scenarios on economic indicators, natural capital stocks and ecosystem service supply are compared with the tipping point scenario to determine the net effect of a more sustainable vision for the Amazon.
2. Methods
2.1. IEEM for Brazil, Bolivia, Colombia, Ecuador, and Peru
The IEEM Platform [45, 46] is an economy-wide decision-making framework for evidence-based public policy and investment design based on a recursive dynamic computable general equilibrium (CGE) model [47–49]. In this study, we linked IEEM with spatial LULC and ESM, IEEM + ESM [35, 36], to understand the regional economic repercussions of moving toward an environmental tipping point in which the Amazon experiences irreversible changes to its ecosystems. IEEM models, databases and instructional materials are openly available on the OPEN IEEM Platform website11.
Among CGE models, the value-added of IEEM is: (a) its integration of detailed environmental information through the United Nations System of Environmental-Economic Accounting [50] to represent the economy and the environment in a comprehensive and inter-connected way, all consistent with the System of National Accounts [51]; (b) the indicators IEEM generates are those demanded by policy makers including GDP, employment and poverty, but also metrics of wealth, sustainability, natural capital stocks and ecosystem services supply; and (c) IEEM's environmental modeling modules capture the specific dynamics of natural capital-based sectors while IEEM's linkage with spatial ESM enables estimation of impacts on the future flow of market and non-market ecosystem services.
The core IEEM database is an environmentally extended Social Accounting Matrix constructed for each of our five Amazon focal countries [52] based on each country's System of National Accounts, supply and use tables and integrated economic accounts. Crops, livestock, forestry and employment data for each country are disaggregated by first level administrative divisions using a combination of agricultural census data, LULC maps, and national household and continuous employment surveys. This is an important step for enabling LULC and ESM that accurately reflects subnational (state and department-level in this case) demand for land and the application of spatially targeted policies. IEEM outputs and subsequent LULC and ESM include 21 states and departments in the five countries found within the Amazon biome, plus the aggregated non-Amazonian parts of each country, for a total of 26 regions (see supplementary information (SI) section 1 for detailed data sources for each country).
We develop a baseline projection for each of the focal countries for the period 2020–2050. The economies are projected for this period based on the International Monetary Fund's World Economic Outlook GDP growth rates [53] and the United Nations Department of Economic and Social Affairs population projections [54]. Deforestation is projected to 2050 based on historical trends [55]. Deforestation increases the availability of cleared land for crop and livestock activities with endogenous allocation of land between these two uses. The extraction of natural assets such as petroleum and minerals occurs at the same rate as GDP growth for each country. Equilibrating mechanisms or model closures for government, savings-investment, and balance of payments are detailed in SI section 1.
2.2. Scenario overview
We first develop a reference business-as-usual (BASE) scenario for the region from 2020 to 2050 from a projection of economic development and land use that follows current trends. We then introduce the tipping point scenario (COMBI) which simulates the impacts of approaching an Amazon tipping point and is comprised of three main dimensions: (a) climate change impacts from increased water and temperature stress; (b) increasing frequency and intensity of drought, and; (c) increasing frequency and intensity of fire. The difference between the COMBI and BASE scenario reveals the economic, natural capital and ecosystem service impacts of approaching a tipping point.
Upon this future trajectory for the region (COMBI), we implement policy actions aimed at averting a tipping point. This policy intervention scenario (POLICY) begins with concerted regional efforts to strongly reduce deforestation over the next 10 years. There are various strategies for achieving this, including command and control mechanisms such as improved monitoring and enforcement of existing laws, market-based incentives such as the G4 Cattle Agreement (suppliers that have deforested since 2010 are excluded from selling to signatory slaughterhouses) [56] and the Soy Moratorium (soybean trader signatories agreed to not purchase soybean on lands deforested after 2006), as well as policies and incentives for introducing more sustainable productive practices (e.g. intensive cattle production systems based on mixed grass-legume pastures [57], integrated crop-livestock systems [58], establishing silvopastoral and agroforestry systems in already degraded areas [30, 31] and sustainable forest management systems) and payment for ecosystem services [1]. Experience in Brazil over the last 15 years has generated numerous lessons that can be applied in the region to reduce deforestation [59–61]. In addition to reducing deforestation, the policy intervention scenario includes investment in agricultural intensification, climate-adapted agricultural systems and improved fire management.
To facilitate presentation and discussion of results, we treat the tipping point scenario and the policy intervention scenario as two single scenarios. In reality, they are comprised of a number of sub-scenario components, each introducing different dimensions that drive towards an environmental fallout in the tipping point case, and different positive policy outcomes in the policy intervention case. Specifically, the tipping point scenario (COMBI) is comprised of continued high rates of deforestation, the ongoing average climate change effect on agricultural yields (YIELD component) and increasing frequency and intensity of drought (DRGHT component) and fire (FIR component).
Underpinning the YIELD component of COMBI, evidence shows that tropical South America has become warmer and drier, and these trends are expected to continue. To model the relationship between climate change and crop productivity, we use historical crop yield data combined with observed climate data on monthly temperature and precipitation from the 30 year period from 1981 to 2010, and future climate projections from 2020 to 2050. The DRGHT component simulates the expectation that extreme drought events will become more frequent and intense with climate change. To quantify the increasing likelihood of extreme droughts and their potential effect on agricultural output in a drought year, we use the Standardized Precipitation-Evapotranspiration Index from 1981 to 2050 for each state/department of our focal countries. The FIR component captures how climate change is expected to result in increased frequency and intensity of fire. Combined with climate change, fire will be a key factor determining what kind of forests exist in the future and whether those forests can sustain critical ecosystem services over the long term [23]. We describe the literature and assumptions underpinning each of these sub-scenario components in the accompanying SI section 2.
We then introduce a set of sub-scenario components that jointly describe a policy intervention scenario (POLICY) designed to avert an Amazon tipping point, comprised of net zero deforestation (NDEFOR), intensified agricultural systems on cleared lands and climate-adapted agriculture (YIELD50), and improved fire management (NFIR). We simulate net zero deforestation as being achieved through intense efforts to improve monitoring and enforcement of deforestation across the region and provide alternative opportunities to support forest-based livelihoods. The annual cost of reaching net zero deforestation is estimated at US$5.5 billion [62, 63]. We distribute this cost across countries based on their individual share of the Amazon biome (67% in Brazil, 15% in Peru, 9% in Bolivia, 8% in Colombia and 1% in Ecuador).
To mitigate the climate change impact on agricultural yields and reduced land supply arising from net zero deforestation, the policy intervention scenario includes investment in agricultural intensification, targeted irrigation and expansion of climate-adapted crop varieties. These measures could mitigate up to 50% of projected productivity losses relative to the yield component of the tipping point scenario in average years, though crops remain vulnerable to the extreme droughts simulated in the drought component of that same scenario. The fire management component of the policy intervention scenario represents comprehensive efforts to control and prevent fires in the face of drier, more fire-prone climatic and biophysical conditions. We assume that effective implementation of fire management could prevent 50%–75% of the projected burned area from burning[21].
2.3. Scientific underpinnings of scenario design
To calibrate scenarios in IEEM, beginning with the yield shock, we develop statistical models to relate historic variability in crop productivity to existing spatial gradients in climate and periodic shocks arising from droughts. To quantify regional changes in temperature and dryness, we apply the climate space concept, which uses rainfall and the Maximum Cumulative Water Deficit, an index of dryness, to delineate the climate envelope, which in this case is the range of precipitation and temperature that is most suitable for agricultural production [12, 64]. We use a generalized linear model to relate historic yields to the Maximum Cumulative Water Deficit. Based on these results, we make hypothetical yield projections under mean future climate conditions. This allows us to quantify the upper and lower bounds of expected crop losses as a percentage of baseline yield for each administrative unit, without explicitly modeling the sensitivity of specific crops.
Using a similar approach to that described above, we calculate the Standardized Precipitation Evapotranspiration Index, a standard metric used to monitor droughts [65]. We estimate the historic and future frequency of extreme events based on a threshold of one standard deviation of the Index. We use results as the basis of our YIELD scenario shocks implemented in IEEM. To simulate drought impacts on agriculture in the DRGHT scenario, and in addition to yield losses due to changes in the average climatic conditions and the Maximum Cumulative Water Deficit, we assume a 15% loss in yield during extreme drought events, which are expected to become more frequent in the future [66].
Underpinning the FIR scenario, we use model outputs to quantify the interactions between deforestation, climate change and fire in the driest region of the southern Amazon, which is comprised of about 192 million hectares and is where most fires occur [21]. To account for the effect of climate change on dry season length, we use data from the Amazon Climate Source, a data platform that synthesizes information on observed historical climate [67] and model future climate [68] in the Amazon [69]. We use dry-season length as a spatial mask in a Geographic Information System to distinguish between flammable and non-flammable forests, making the assumption that Amazon forest areas with a dry season length of greater than or equal to 3 months are eligible to burn.
For all scenarios, we assume that future climate will follow the high-emissions scenario outlined by the Intergovernmental Panel on Climate Change [70] which most closely matches current emissions pathways and thus the status quo which is consistent with the tipping point scenario. The high-emissions scenario, referred to as a Representative Concentration Pathway, assumes that atmospheric greenhouse gases will accumulate at the current rate of emissions, causing a climate forcing of 8.5 Watts per square meter.
2.4. LULC change modeling
Annual demands for forest, forest plantation, cropland and grazing areas are generated by IEEM. IEEM demand for land is spatially allocated across a 1 km grid with the LULC change model, which is used to generate baseline and scenario-based projected LULC maps. These maps and future precipitation, temperature, and potential evapotranspiration projections are the main inputs used to model changes in ecosystem services, with most other inputs to those models held constant. We use the Dyna-CLUE [71–74] LULC change modeling framework to spatially allocate LULC change using empirically quantified relationships between land use and location factors, in combination with the dynamic modeling of competition between land use types. Dyna-CLUE calculates suitability maps for each land use type that reflect the probability of each land use class occurring for each grid cell and assigns demands accordingly (see SI section 3 for additional details).
2.5. ESM
We use four of the Integrated Valuation of Ecosystem Services and Tradeoffs (InVEST) models [75] to calculate scenario-based, spatially explicit changes in ecosystem services supply, namely: the sediment delivery ratio model to calculate soil erosion mitigation services; the carbon storage model to calculate carbon storage and carbon sequestration potential; the annual water yield model to calculate water regulating services, and; the nutrient delivery ratio model, which is used as a proxy for the water purification potential of landscapes in absorbing nitrogen and phosphorus (see SI section 4 for additional details). We parametrize these four InVEST models with the IEEM + ESM datapackets[76] which render them virtually "plug and play".
3. Results
3.1. LULC and ecosystem service impacts
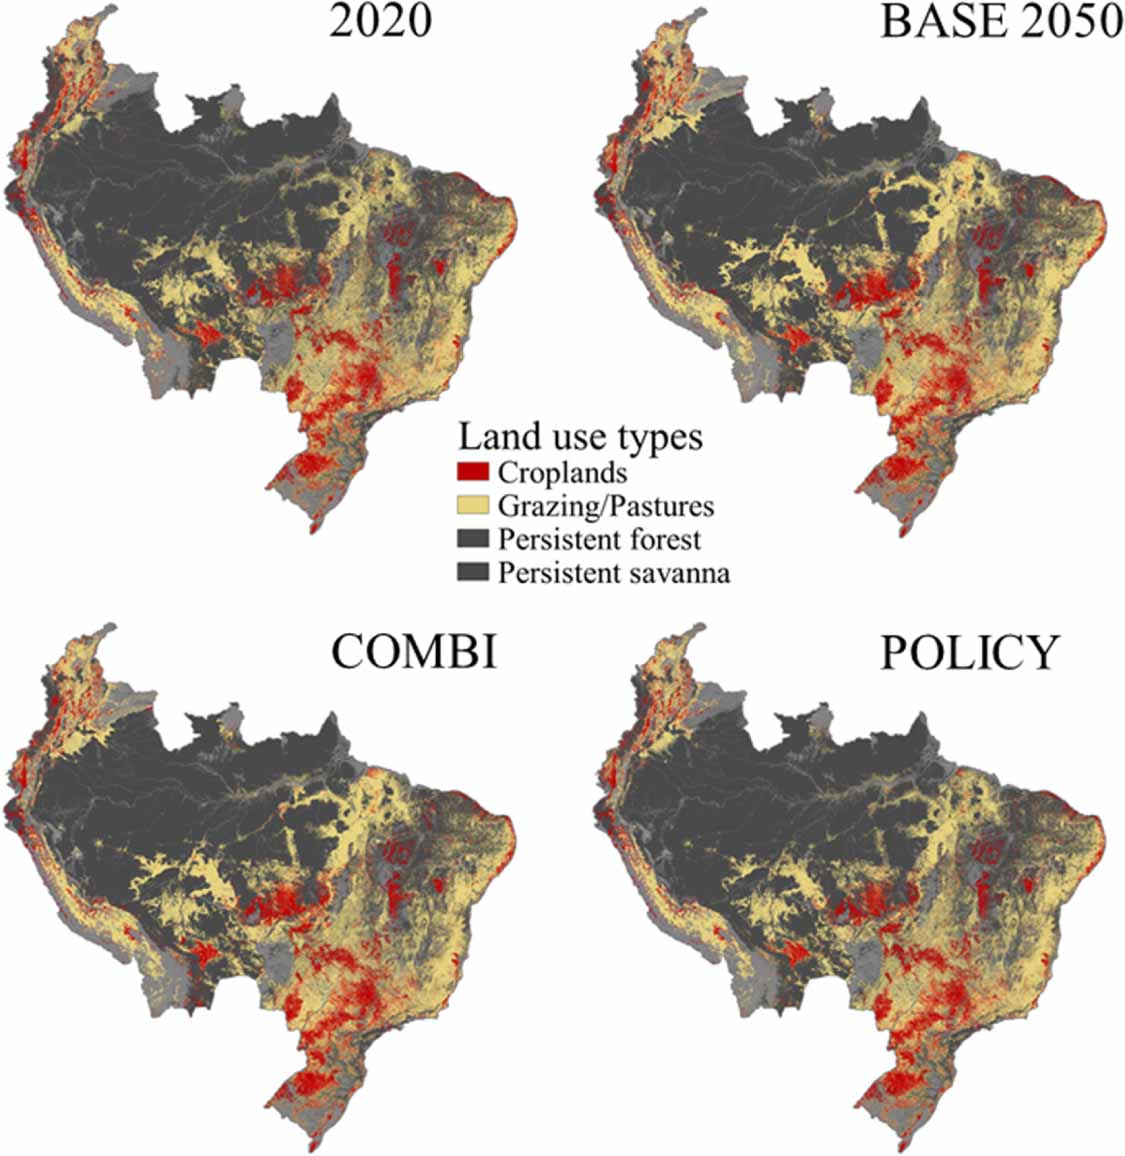
Land use and land cover classes subject to change in our modeling are forests, forest plantations, shrubs and other vegetation, cropland, and grazing and pasture areas. LULC change was modeled individually for the Amazon region's 26 different states or departments, depending on the administrative division of each of the countries included (figure 1). Throughout the entire Amazon region, we identified areas subject to change using a 1 km grid.

Figure 1. Modeled dominant biomes by administrative unit.
Download figure:
Standard image High-resolution imageWith a detailed understanding of LULC change in the landscape, we assess changes in ecosystem services first as the tipping point impact with respect to a hypothetical future without a tipping point (COMBI vs. hypothetical BASE) and then the policy impact with respect to the tipping point (POLICY vs. COMBI; figure 2). Moving toward a tipping point would result in large losses (>25%) of carbon storage (COMBI, figure 3) in some of Brazil's northeastern states including Alagoas, Pernambuco, Paraíba, Rio Grande do Norte, and Ceará, while Piauí would experience a reduction of 5%–25% in carbon storage. Rio Grande do Sul, Santa Catarina and Paraná would experience a loss of more than 25%. The Colombian and Ecuadorian Amazon would experience a loss of up to 5% along with the Bolivian Amazon, and the Brazilian states of Amazonas, Acre and Roraima. In contrast, policy interventions to avert a tipping point would increase carbon storage (POLICY, figure 3) by more than 25% across most of the region.
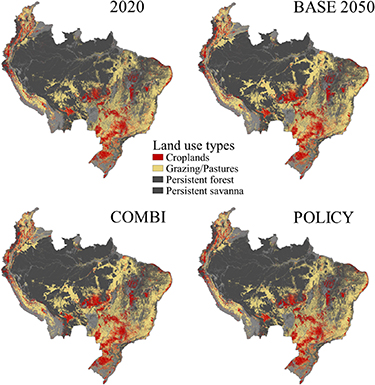
Figure 2. Land use-land cover change results for the baseline (BASE), Amazon tipping point (COMBI) and policy intervention (POLICY) scenarios.
Download figure:
Standard image High-resolution image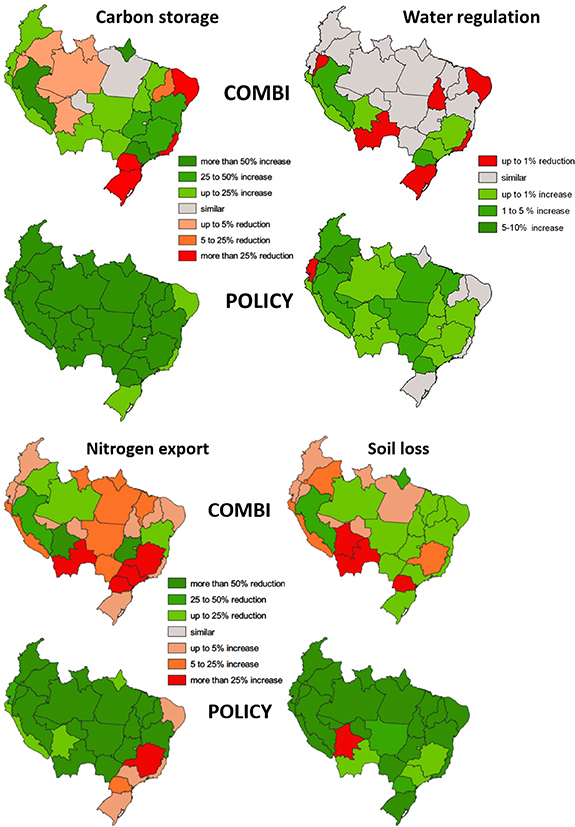
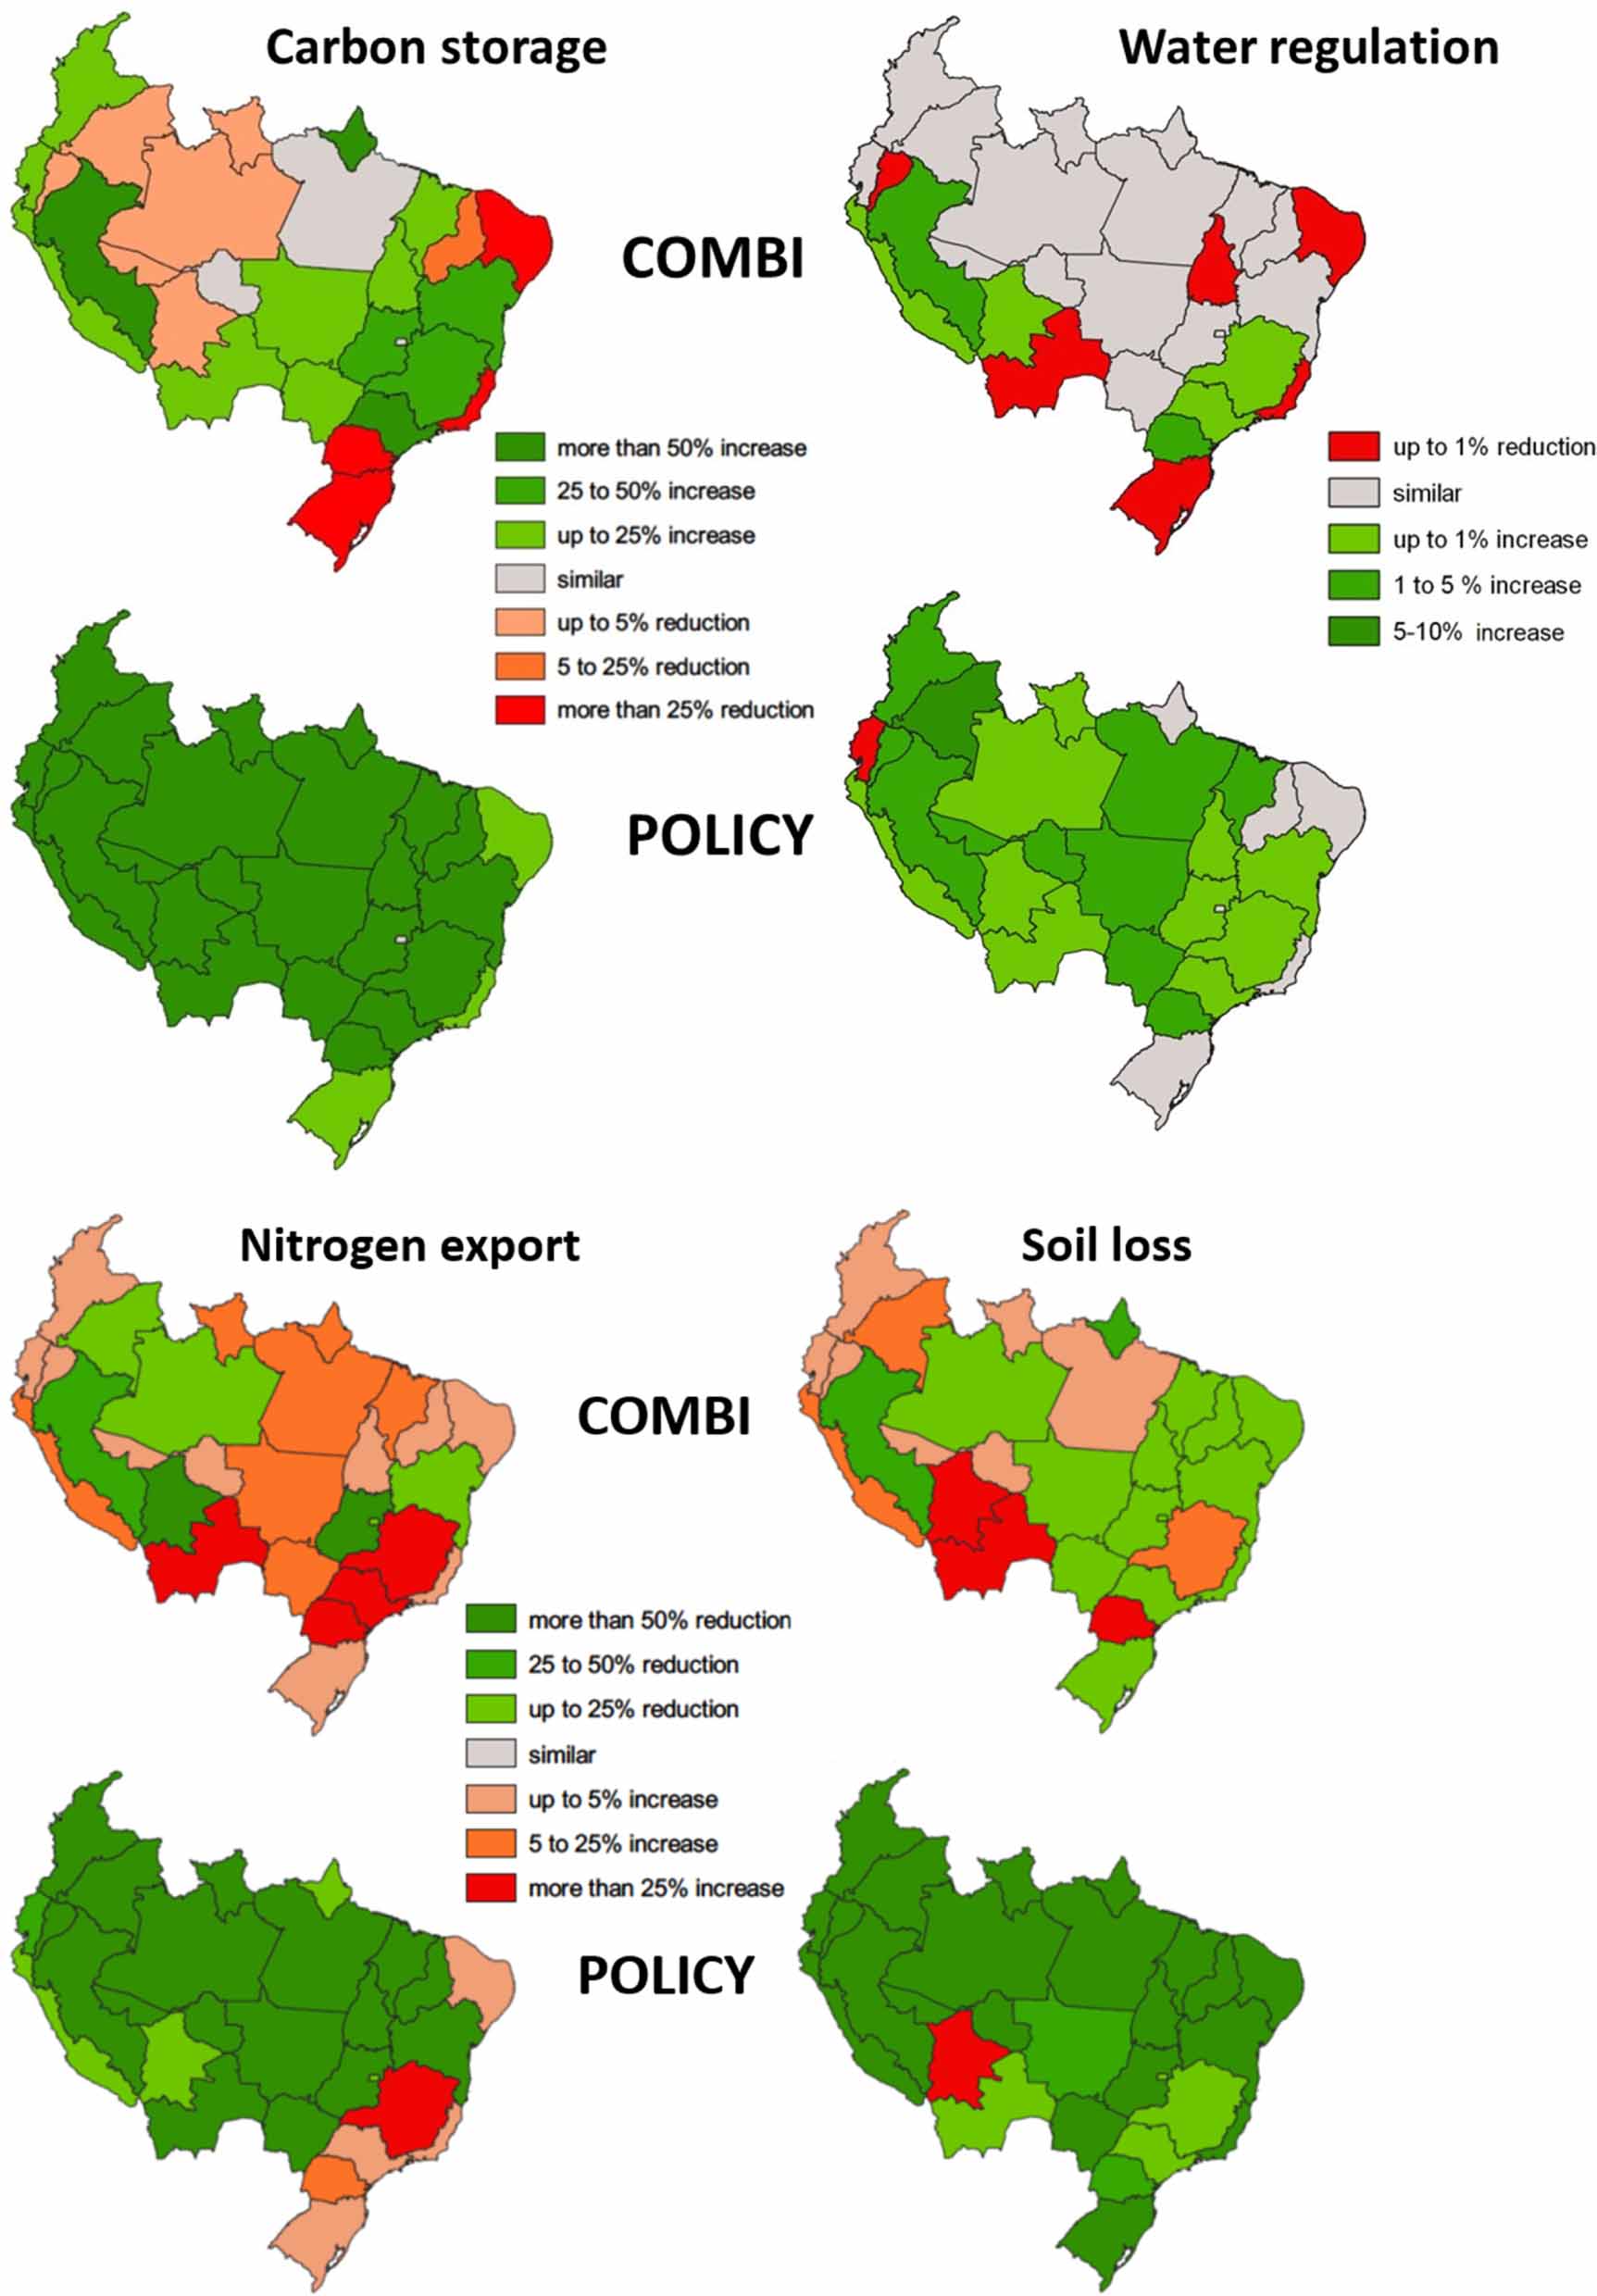
Figure 3. Policy impacts on ecosystem services as a percentage difference between the policy intervention (POLICY) in 2050 and the Amazon tipping point (COMBI) scenarios. In the keys, green indicates a positive outcome, red indicates a negative outcome.
Download figure:
Standard image High-resolution imageWith regard to water regulating services, the tipping point impact (COMBI, figure 3) on these services would be largely muted across the region. In the case of policy intervention (POLICY, figure 3), water regulating services would improve with more water used for ecological functions such as evapotranspiration. This improvement would result in less runoff, thus reducing the impacts of floods, while maintaining better water quality and more water for dry season flows and other important biological and ecosystem functions. Compared to the tipping point, improvements to water regulation through policy intervention would be between 1% and 5% across much of the region.
A tipping point would result in reductions in water quality (COMBI, figure 3), proxied for by nitrogen exports to streams, and would be most acute in Bolivia's south and in Brazil's southeastern states of Minas Gerais, São Paulo and Paraná with a reduction of more than 25% driven by an increase in nitrogen exported to water bodies. A 5%–25% reduction in water quality would be found in the case of Peru's Andes and coast and the Brazilian states of Roraima, Amapá, Pará, Maranhão, Pará, Mato Grosso and Mato Grosso do Sul. Policy intervention would have a strong impact on improving water quality (POLICY, figure 3), equal to or greater than 50% for much of the region. In the case of Minas Gerais, there would be an increase of over 25% and in Paraná, there would be a reduction in water quality of 5%–25% due to increases in nitrogen exported to water bodies.
A tipping point scenario would have spatially diverse impacts on erosion mitigation services (COMBI, figure 3) across the region, with a particularly acute loss across Bolivia (more than 25% loss), along the western slope of the Andes in Peru, and in the Colombian Amazon (5%–25% loss). Paraná in Brazil would experience a more than 25% loss of erosion mitigation services, followed by Minas Gerais (5%–25%), Pará, Roraima, Rondônia, and Acre (up to 5% loss of services). Colombia's non-Amazon region would experience a loss of up to 5%. Policies to avert a tipping point would have a dramatic impact on improving erosion mitigation services (POLICY, figure 3) by more than 50% across much of the region. Bolivia's Amazon region is an exception where a 25% loss would be experienced.
3.2. Economic impacts
The cumulative regional GDP impact of approaching an Amazon tipping point would be an economic loss of over US$256.6 billion (2019 base year; table 1). In Brazil, the loss would be on the order of US$184.1 billion, followed by US$35.3 billion, US$17.6 billion, US$11.4 billion, and US$8.2 billion in Colombia, Bolivia, Ecuador, and Peru, respectively. In terms of wealth, the cumulative regional impact would be a loss of US$81.55 billion; on a national basis, wealth forgone in Brazil would be US$55.2 billion, followed by US$16.9 billion, US$5.4 billion, US$3.98 billion, US$2.3 billion and US$1.7 billion in Colombia, Bolivia, Ecuador, and Peru, respectively.
Table 1. Regional economic effects of reaching an ecological tipping point in the Amazon. YIELD: crop yield reductions from climate change; DRGHT: increased severe drought; FIR: increased fire frequency and intensity, and; COMBI: combined effects of tipping point scenario, all as cumulative impacts on gross domestic product (GDP) and Wealth as difference from the BASE scenario in millions of US Dollars (2019 base year). NDEFOR: net zero deforestation; YIELD50: climate-adapted agriculture; NFIR: fire management, and; POLICY: combined effects of policy intervention, all as cumulative impacts on GDP and Wealth as difference from COMBI.
| Indicator | Country | YIELD | DRGHT | FIR | COMBI | NDEFOR | YIELD50 | NFIR | POLICY |
|---|---|---|---|---|---|---|---|---|---|
| GDP | |||||||||
| Brazil | −146 800 | −33 515 | 30 | −184 121 | −191 209 | −73 928 | −129 | −81 245 | |
| Peru | −7,107 | −1064 | 4 | −8200 | −9168 | −4104 | −35 | −5117 | |
| Colombia | −26 656 | −8430 | 13 | −35 266 | −47 158 | −19 096 | −142 | −31 177 | |
| Bolivia | −16 271 | −1678 | −49 | −17 610 | −20 238 | −10 421 | −254 | −14 555 | |
| Ecuador | −11 408 | −30 | 18 | −11 420 | −19 746 | −8410 | −17 | −16 775 | |
| Regional | −208 242 | −44 717 | 16 | −256 618 | −287 519 | −115 958 | −577 | −148 869 | |
| Wealth | |||||||||
| Brazil | −42 922 | −9880 | −743 | −55 207 | 123 561 | −15 886 | 113 | 162 804 | |
| Peru | −1218 | −184 | −318 | −1729 | 19 233 | 252 | 1 | 20 952 | |
| Colombia | −12 040 | −3773 | −809 | −16 868 | 87 660 | −5893 | −166 | 98 165 | |
| Bolivia | −4685 | −441 | −36 | −5413 | 6769 | −2042 | 6 | 10 062 | |
| Ecuador | −2044 | −5 | −291 | −2337 | 45 515 | −463 | −52 | 47 311 | |
| Regional | −62 908 | −14 282 | −2197 | −81 554 | 282 738 | −24 032 | −98 | 339 294 |
Through the lens of GDP, policies to avert a tipping point, including net zero deforestation, would mitigate some but not all of these economic impacts. For the entire region, the net effect would be a US$148.9 billion reduction in GDP. Economic losses would be reduced by more than half in the case of Brazil with a US$81.2 billion loss to GDP, a US$31.2 billion loss in Colombia, a US$16.8 billion loss in Ecuador, US$14.6 billion in Bolivia, and US$5.1 billion in Peru.
Strategies to avert a tipping point, including net zero deforestation, would not only mitigate negative economic impacts, but would generate positive gains for inter-generational wealth; the impact of a net zero deforestation policy would be particularly strong. For the region, policy intervention would generate an additional US$339.3 billion in cumulative wealth. For Brazil, this would add US$162.8 billion in wealth, followed by Colombia, Ecuador, Peru, and Bolivia, with additional wealth of US$98.2 billion, US$47.3 billion, US$20.95 billion, and US$10.1 billion, respectively.
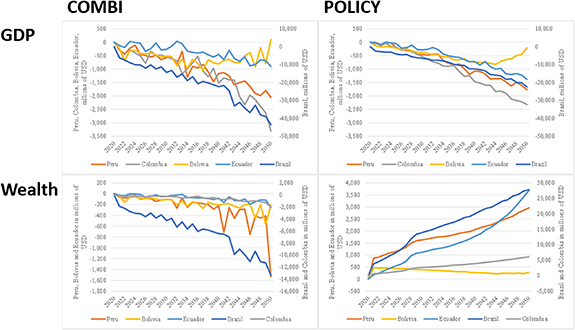
The GDP trajectory by country, as a difference from business-as-usual (BASE), is strongly influenced by the climate change projections and derived indicators used to estimate agricultural productivity and drought and fire-related shocks throughout the analytical period (figure 4). The variability of these factors resulted in irregular impacts through time where some years would register markedly worse impacts than others due to year-to-year variation in the severity of drought and fire. For example, in the case of Bolivia, policies to avert a tipping point, when considered from the perspective of GDP, would appear to generate economic benefits as measured by GDP in the long-term near the final years of the analytical period.
Figure 4. Gross domestic product (GDP) trajectory as difference from baseline (BASE) for an ecological tipping point in the Amazon (COMBI) and policy intervention (POLICY) scenarios (top left and right); Note Brazil is shown on secondary y-axis. Wealth trajectory as difference from BASE for tipping point and policy intervention scenarios (bottom left and right); Note Brazil and Colombia are shown on secondary y-axis. In millions of US dollars (2019 base year).
Download figure:
Standard image High-resolution image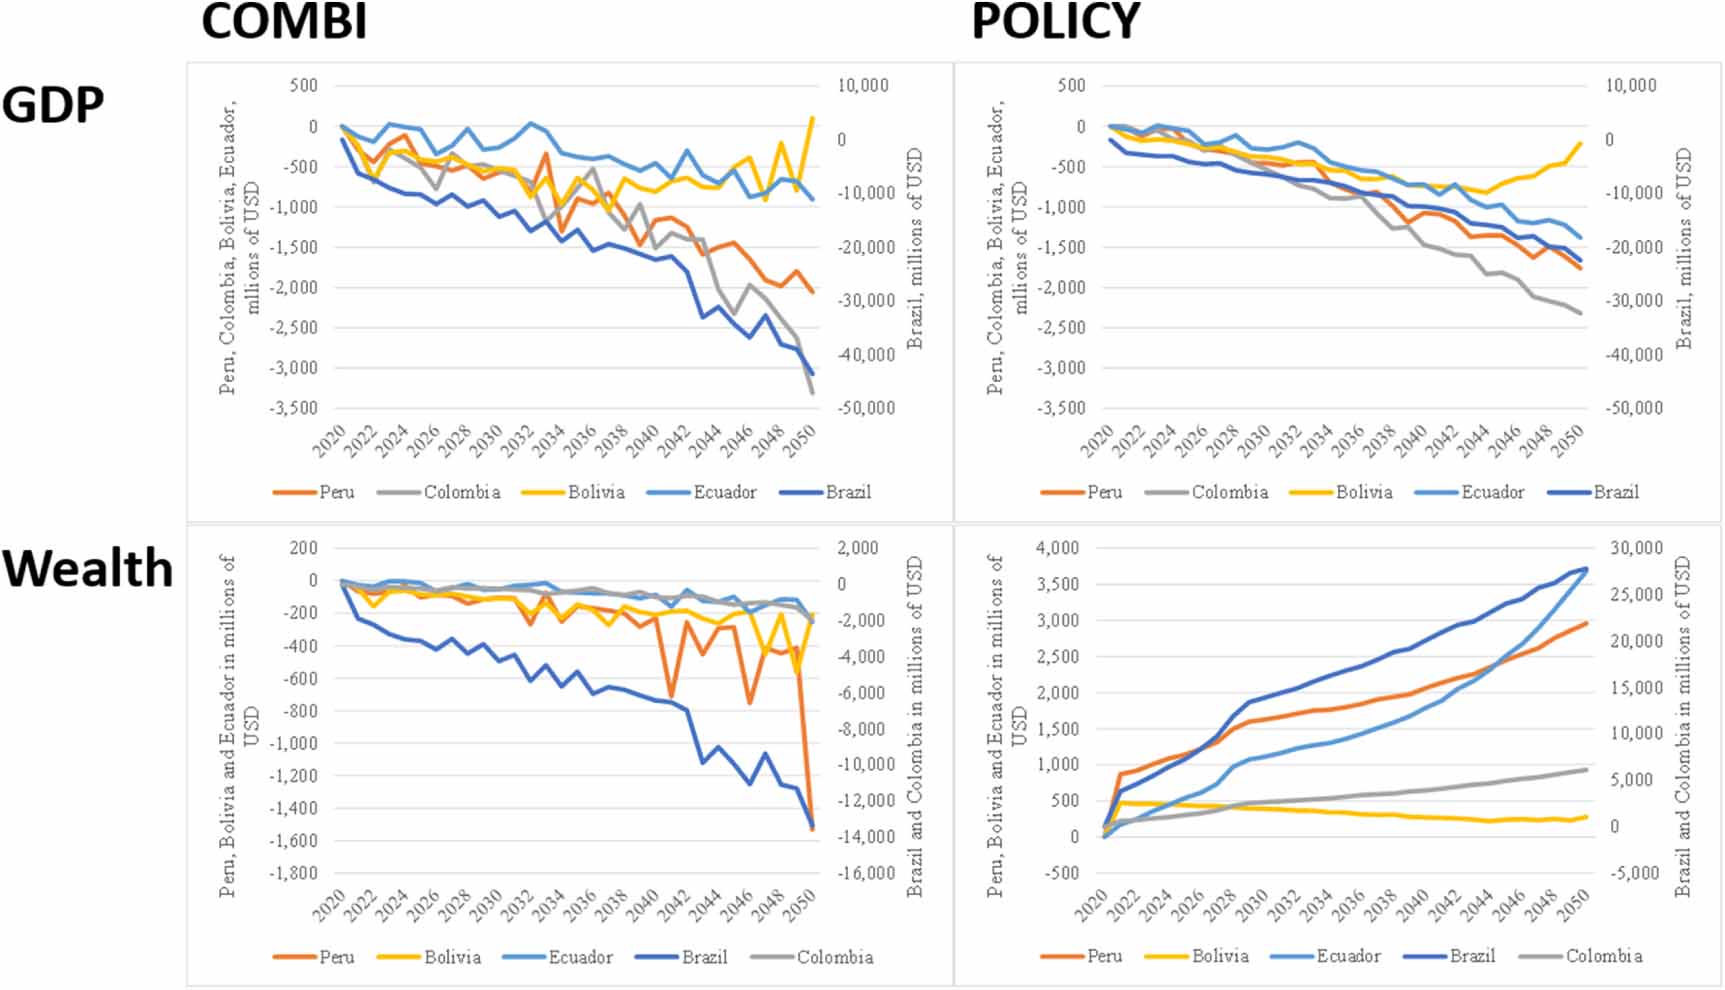
In terms of the tipping point scenario's effects on GDP, Brazil, Colombia and Peru's economic trajectory would follow a relatively steep decline throughout the analytical period (figure 4). With regard to the tipping point impact on wealth, Peru would suffer a rather precipitous drop in wealth at the end of the period due to a fire that destroys a large tract of forest; this occurs due to the probabilistic nature of how we model fire (see SI 2). This important loss of natural capital stocks would go undetected from the perspective of GDP.
In contrast, in the policy intervention scenario, wealth would trend upward for most countries (figure 4). Bolivia, however, would experience a boost to wealth in the initial years with a tendency toward the baseline scenario levels of wealth in later years. The smoother trend in the wealth impacts of the policy scenario compared with the tipping point scenario is explained by the gradual implementation of investments to improve agricultural yields.
A tipping point would push at least 171 000 more people into poverty across the region. While the policy intervention scenario would mitigate some of the increase in poverty, it would still result in 159 600 more poor people; this number of poor represents approximately 0.05% of the current combined population of the five focal countries.
4. Discussion and conclusions
This is the first high resolution study, both in economic and land use terms, that considers the interrelationship and feedbacks between the three dimensions of sustainable development- economy, environment, and society- in a comprehensive way. Previous studies have tended to focus on one of these dimensions and specific components of a tipping point, for example deforestation [8, 77, 78], fire [24, 79] or savannization [12, 20]. Literature that assesses the economic impacts of a tipping point and policy interventions to avert one is scarce [10, 80, 81] and indeed non-existent from a whole-of-economy, CGE perspective.
The Amazon is approaching a tipping point due to the self-reinforcing interactions between climate change, deforestation and fire [5–9]. We operationalize the drivers of the tipping point concept as being comprised of continued high levels of deforestation, mean climate change effects, and increasing frequency and intensity of both drought and fire. These components of a tipping point interact with regional economies primarily through direct impacts on agricultural productivity and land markets, both of which have implications for economic activity and welfare.
No economic sectors are spared the effect of a tipping point; the cumulative regional GDP impact would be an economic loss of over US$256.6 billion and a deterioration of regional wealth on the order of US$81.55 billion. The regional GDP impact in 2050 would be 3% and the wealth impact would be 1%. Impacts by country would vary according to the importance of agriculture to each country's economy and its share of the Amazon biome.
Coordinated action and investment by Amazon countries to achieve net zero deforestation, improve fire management, intensify agriculture on already cleared land and implement climate-adapted agriculture [23, 31–34] are critical to averting a tipping point. With environmental damage having occurred unchecked for decades [55, 60, 62, 78], implementing the necessary measures would involve some short-run adjustment costs as regional economies allocate resources and adjust to new land supply dynamics, though increasing land scarcity accompanied by measures to enhance productivity on already cleared lands would mitigate some of these costs.
Considering that GDP does not reflect changes in natural capital stocks nor its capacity for generating ecosystem service flows, the portfolio of policies that we consider to avert a tipping point would result in a US$148.9 billion reduction in GDP equivalent to 2% of regional GDP in 2050. This, however, would be a marked improvement when compared to the tipping point scenario. On the other hand, through the lens of wealth and sustainable economic development, coordinated policy action would generate an additional US$339.3 billion in cumulative wealth, equivalent to a 4% increase in regional GDP in 2050.
Achieving net zero deforestation across the Amazon would have a profound effect on natural capital and future ecosystem service flows, sustaining both local livelihoods and regional climatic, hydrological and nutrient cycles. Maintaining standing forests affects the supply of many ecosystem services; this study considers only a subset of these services and thus provides a conservative estimate of the impacts. With coordinated policy action, soil erosion mitigation services would improve by more than 50% in most regions. Carbon storage would increase across almost all countries by more than 25%. Water quality also generally would improve across the region with 50% less nutrient exports and water regulation services would be enhanced by between 1% and 5%.
While in this study we focused on how a tipping point would interact with the economy through agricultural productivity, land markets and returns to forestland, there are additional interactions that could be considered, such as health impacts related to forest cover and disease transmission [82], health impacts of reduced emissions from forest fires and localized forest cover and climate interactions. Furthermore, these estimates are conservative in that impacts of an Amazon tipping point would be felt beyond our focal countries in at least four ways: (a) global economic impacts through changes in international commerce affecting, for example global food security and migration patterns; (b) economic impacts felt by nearby nations not included in the modeling exercise due to data limitations (specifically, Venezuela, Guyana, Suriname and French Guiana); (c) climate impacts felt elsewhere that result from additional atmospheric carbon released through deforestation and fire, and; (d) tipping point-caused changes to precipitation patterns affecting nations beyond the Amazon region [83, 84].
Our results present a positive outlook should coordinated policy action be taken now. While there may be some short run costs, policy action would build intergenerational wealth and enhance natural capital stocks and their ability to increase the future flow of ecosystem services. Complementary policies and incentives would be required to diversify sources of income for those households dependent on land-based systems where net zero deforestation would affect the supply of land and alter land use dynamics throughout the region.
From a policy design perspective, this study revealed an important gap in information on the costs of policy implementation. While there is a growing body of evidence that supports the effectiveness of the policies considered here, information on costs is sorely lacking. This information is critical for governments to raise funds and allocate budgets for these policies. Without information on costs, well-intentioned efforts are destined to be under-funded and ultimately fall short of averting an Amazon tipping point. As we have shown here, the costs of failure would impose devastating consequences from an economic and environmental perspective.
Acknowledgments
This study was commissioned by the UK's HM Treasury to inform the Dasgupta Review on the Economics of Biodiversity. The study was funded by the UK's Department for Environment, Food & Rural Affairs and the Inter-American Development Bank. Support for Onil Banerjee's time was provided by the Inter-American Development Bank until March 2022 and by RMGEO Consultants Inc. thereafter. Support for Bagstad's time was provided by the USGS Land Change Science Program. Modeling of deforestation-climate feedbacks and analysis of regional climate risks for agricultural productivity, drought, and fire were supported by grants from the NSF (INFEWS #1739724), CNPq (Nexus-Cerrado #441463/2017-7; PELD-Tang #441703/2016-0PELD), and the Gordon and Betty Moore Foundation (#5482, #9957). The authors thank Robert Marks, Emily McKenzie, Felix Nugee and the Dasgupta Review Team for their constructive review of an early version of this study. The authors thank the Inter-American Development Bank's Allen Blackman, Gregory Watson, Annette Kilmer, Eirivelthon Lima, Carlos Salazar, Santiago Bucaram, Marisol Inurritegui, Pedro Martel, Fabiano Bastos, Jose Luiz Rossi and Aloisio de Melo for their valuable comments. Thanks also to Judson Ferreira Valentim, Mariane Crespolini dos Santos and Sergio De Zen for sharing their insights. The authors thank GLASSNET for providing a platform for engaging with GLASSNET scholars to enrich the study and identify linkages with related work from global to local scales.
Data availability statement
The data that support the findings of this study are available upon reasonable request from the authors.
Supplementary data (0.9 MB PDF)