

Abstract
Solar photovoltaic (PV) technology offers a promising path for addressing energy demand and mitigating climate change. However, climatic conditions relevant to the productivity of solar power may be changed in a warmer future. Here, we quantify the impact of climate change on PV potential over China based on high-resolution climate projections within the framework of the Coordinated Regional Climate Downscaling Experiment (CORDEX). Our results indicate that the annual mean PV power potential (PVPOT) over China would decrease by several percent relative to the reference period (1986–2005) under a warmer climate, with the most pronounced decrease over the Tibetan Plateau, which is currently the most solar-rich region in China. However, beyond changes in the mean climate state, we demonstrate a substantial increase in events of extreme low PV power outputs (i.e. those falling below the 10th percentile of the probability distribution of the daily PVPOT anomalies). For instance, the frequency of extreme low PV events is projected to reach nearly three times the reference period level over the Tibetan Plateau under the scenario of 3 °C global warming (similar to late-century warming projected based on current mitigation policies). Future changes in PVPOT are dominated by changes in surface solar irradiance, while the warming condition further exacerbates the decrease in PVPOT. Our results highlight that both the mean and extreme conditions of solar inputs should be considered simultaneously when assessing the impacts of climate change on PV power outputs.
Export citation and abstract BibTeX RIS

Original content from this work may be used under the terms of the Creative Commons Attribution 4.0 license. Any further distribution of this work must maintain attribution to the author(s) and the title of the work, journal citation and DOI.
1. Introduction
The human-induced rapid warming of the earth's climate potentially poses many negative effects on natural ecosystems and human society (Mora et al 2018, Watts et al 2021). To prevent dangerous anthropogenic interference with the climate system, Paris Agreement set a goal to maintain the global temperature increase relative to the preindustrial level significantly below 2 °C, and pursue efforts to limit it to 1.5 °C (United Nations Framework Convention on Climate Change 2015). However, based on the current mitigation policies, the late 21st-century warming is projected to reach ∼3 °C above the preindustrial level (Rogelj et al 2016, Raftery et al 2017, Zhang and Wang 2019, Liu and Raftery 2021, Wang et al 2022). To keep the Paris Agreement goal within reach, reducing carbon emissions is urgently needed (Höhne et al 2021, Huang and Zhai 2021). As the world's largest emitter of greenhouse gases, China has announced scaling up its national commitments, aiming to peak its CO2 emissions before 2030 and achieve carbon neutrality before 2060 (Xi 2020). A massive ramp-up of renewable electricity generation is therefore critical to supply the expected rise in future energy demand (Mallapaty 2020, Bertram et al 2021, Liu et al 2022b). As an important solar power system, photovoltaic (PV) technology offers a promising path for addressing these issues (Creutzig et al 2017). China is playing an increasingly immense role in the PV electricity supply. It has been estimated that nearly 40% of the global installed PV capacity will be held by China by 2023 (International Energy Agency 2018).
A high-resolution, exhaustive assessment of the current spatiotemporal pattern of solar energy potential in China has been carried out by multiple studies, and the results indicate that solar energy resources in China are generally stable but with notable spatial heterogeneity, with western China being the most abundant and an optimal location for solar PV plants (Feng et al 2021, Qiu et al 2022, Liu et al 2022a). However, solar resources are shown no longer to be stable over time and undergo substantial decadal changes with climate change in the 21st century (Wild et al 2015, Huber et al 2016). Other climate variables that affect PV production, such as temperature, wind speed, and aerosols, are likely to change under different future warming scenarios (Wild et al 2015, Danso et al 2022). Therefore, potential climate change impacts must be considered in long-term management planning for solar PV (Soares et al 2019, Poddar et al 2021, Danso et al 2022). A pioneering global-scale study indicated an increase in solar power output by several percent in China in the 21st century (Crook et al 2011). Other studies pointed out that PV power output in southeastern China will increase, while that in western China will decrease (Wild et al 2015, Yang et al 2018, Zou et al 2019). Zhao et al (2020) concluded that PV energy potential will likely decrease up to 6% in most of China based on statistically downscaled climate projections.
Another important issue is the dependence of solar energy on local weather conditions, making PV output vulnerable to climate change and natural climate variability (Ravestein et al 2018). One of the criteria necessary for the deployment of PV is to deliver a high power and quality requirement for users; however, the periods of extreme low irradiance levels relative to the climatology can make this objective difficult to be achieved (Yin et al 2020, Plain et al 2019). While the trends in mean solar radiation have been investigated extensively in previous studies (e.g. Crook et al 2011, Zhao et al 2020), less attention has been paid to trends in the extreme low PV output days. Pioneering studies at the global scale show that climate change may affect PV outputs by enhancing the weather variability and making extreme conditions more frequent. For instance, the more frequent concurrence of high temperatures and clouds contributes to the doubling of the summer days with extreme low PV output days in the Arabian Peninsula by the mid-21st century (Yin et al 2020, Feron et al 2021). However, there is no similar analysis conducted for China.
Furthermore, most of the above studies are based on global climate model (GCM) projections, which do not reliably capture the climate characteristics at the regional scale, and thus may lead to less reliable projected future changes (Liang et al 2008, You et al 2022). To meet the increasing demand for fine-scale regional climate information usable for impact assessment studies, dynamically downscaling of GCM outputs with regional climate models (RCM) is increasingly used nowadays (e.g. Rummukainen 2016, Gao et al 2018, You et al 2022, Zhang et al 2022b). Several studies have been devoted to the impact of climate changes on PV potential in the future based on dynamically downscaled projections in other regions, such as Europe (Jerez et al 2015), Africa (Bichet et al 2019, Sawadogo et al 2021), and Australia (Poddar et al 2021). As for China (or the East Asia region), although recent studies have investigated long-term changes in annual and seasonal mean PV potential based on dynamically downscaled projections (Park et al 2022, Wu et al 2022), the understanding of future changes in the number of days with extreme low PV power outputs with high-resolution data is still lacking. Given the importance of PV technology in addressing energy demand and mitigating climate change, there is an urgent need to comprehensively investigate how the PV potential over China, a major energy consumer, will change in a warmer future.
Under these circumstances, the present study aims to provide an overall picture of future changes in PV potential over China based on an ensemble of high-resolution climate simulations. In addition to changes in the mean climate state, changes in the events of extreme low PV power outputs are emphasized. To the best of our knowledge, this study is an early attempt to conduct a comprehensive investigation of changes in PV potential (both mean and extreme conditions) over China in a warmer future. The remainder of this paper is organized as follows. Section 2 describes the data and methods used. Section 3 presents the projected changes in mean and extreme PV potential under future scenarios relative to the reference period (1986–2005), and examines the reason for changes in PV potential. Section 4 provides a discussion and conclusion.
2. Data and methods
2.1. Data description
Simulated climatic data are derived from 25 km-resolution dynamically downscaled climate simulations in the East Asia domain, produced by the latest version of the Regional Climate Model version 4 (RegCM4; Giorgi et al 2012) within the Coordinated Regional Climate Downscaling Experiment-Coordinated Output for Regional Evaluations framework (CORDEX-CORE; Giorgi et al 2022). RegCM4 is driven by three GCMs, i.e. the Met Office Hadley Centre Earth System model (HadGEM2-ES; Jones et al 2011), the Max Planck Institute for Meteorology Earth System Model (MPI-ESM-MR; Giorgetta et al 2013), and the Norwegian Earth System Model (NorESM1-M; Bentsen et al 2013), with corresponding downscaled simulations named HdR, MdR, and NdR, respectively. Here, we used daily mean surface downward solar irradiance (Rs), near-surface temperature, and near-surface wind speed from historical simulations (1980–2005) and future projections (2006–2098) forced by the representative concentration pathway (RCP) 8.5 scenario (van Vuuren et al 2011). The main configuration of RegCM4 simulations is summarized in table S1. Here, we did not apply a bias correction method because it is unlikely to have an impact on the relative differences between the future and reference period of our interest (Ehret et al 2012, Maraun 2016).
In addition, the daily mean of hourly outputs from the fifth generation of the European Center for Medium Weather Forecasting atmospheric reanalysis (ERA5; Hersbach et al 2020) is employed as the reference data for evaluating the model results. The ERA products (ERA5 and its predecessor) are the official validation databases for the CORDEX downscaling initiatives (Gutowski et al 2016) and have been widely used as a reference in previous studies (e.g. Poddar et al 2021, Martinez and Iglesias 2022, Wu et al 2022). The ERA5 is shown to be outperforming other reanalysis products in estimating Rs throughout China (He et al 2021, Zhang et al 2021). We did not use observed Rs from meteorological stations because of the concerns about the uneven distribution of stations, missing records, and inhomogeneity issues due to station migration and changes in calculation methods (Wang et al 2015).
2.2. Estimation of photovoltaic potential
In the present study, we estimated the PV power potential (PVPOT) using the energy rating method (Mavromatakis et al 2010, Crook et al 2011), where PVPOT is defined as the fraction of the power output under standard conditions that a PV module may exhibit in the field:
where  is the solar irradiance at Standard Test Conditions (STC), which is equal to 1000 W m−2.
  is referred to as the performance ratio, which accounts for changes in the efficiency of the PV cells due to changes in weather conditions. According to previous studies (Jerez et al
2015, Feron et al
2021, Sawadogo et al
2021),
is referred to as the performance ratio, which accounts for changes in the efficiency of the PV cells due to changes in weather conditions. According to previous studies (Jerez et al
2015, Feron et al
2021, Sawadogo et al
2021),  can be calculated as:

where  is the ambient air temperature at STC (25 °C), and the constant γ can be taken as equal to 0.5% °C−1 in the case of monocrystalline silicon cells.
  (°C) is the solar cell temperature, which is expressed as a function of solar irradiance (Rs), air temperature (T), and surface wind speed (v) as:

where  = 4.3 °C,
  = 0.943,
  = 0.028 °C W−1 m2, and
  = −1.528 °C m−1 s. Note that the above calculation presents the theoretical PV potential. The tilt of PV panels is not considered here. In addition, other technological and politico-economical aspects are not considered.
Although PVPOT is estimated based on daily average T, Rs, and v here due to the absence of high temporal resolution outputs from climate models, we recognize that those variables may change during the day. Given the context, based on ERA5, we compared PVPOT estimated based on daily average datasets and those estimated based on hourly datasets, and the difference in terms of both spatial pattern (figure S1) and temporal variation (figure S2) was confirmed to be small, which further consolidates our strategy in estimating PVPOT.
To assess the possible effects of individual variables on the change in PVPOT, we rewrote the expression of PVPOT by merging equations (1)–(3), as follows:

with  = 1.1035 × 10⁻³,
  = −1.4 × 10⁻⁷,
  = −4.175 × 10⁻⁶, and
  = 7.64 × 10⁻⁶, in the corresponding units (PVPOT should be dimensionless). Thereby, changes in PVPOT are given as follows (Jerez et al
2015):
= 7.64 × 10⁻⁶, in the corresponding units (PVPOT should be dimensionless). Thereby, changes in PVPOT are given as follows (Jerez et al
2015):
According to equation (5), the change in PVPOT due to a change in T can be obtained by taking  = 0 and
  = 0, and the change in PVPOT due to the influence of changes in Rs (or v) alone can be derived similarly.
We considered extreme low daily PV power outputs to be those falling below the 10th percentile of the probability density function (PDF) of the daily PVPOT anomalies (the departure of the daily PVPOT value from the daily base climatology), in which the PDF is estimated within a 15 day rolling window of the PVPOT data over the reference period (1986–2005). This definition is inspired by the methodology used for assessing changes in the probability of occurrence of extreme events (Zhang et al 2011, Perkins-Kirkpatrick and Lewis 2020). Here, we focused on three metrics, i.e. PV10, PV10N, and PV10D (table 1), to quantify the potential change in the events of extreme low PV power outputs. We demonstrated that the effect of using daily average datasets instead of hourly datasets on the calculation of these three indices is small (figure S3). In addition, the method for computing PV10 was also applied for sequentially computing the share of days with extreme low solar irradiance (Rs10, according to the 10th percentile), the share of days with extreme high temperature (T90, according to the 90th percentile), and the share of days with extreme low wind speed (W10, according to the 10th percentile). Following previous studies (Sutanto et al 2020, Feron et al 2021), we created binary maps for the days that exhibited extreme low PVPOT (defined according to the 10th percentile) and extreme low irradiances (defined according to the 10th percentile), which enabled us to assess the number of days with concurrent extremes low PV outputs and extreme solar irradiance. Similar analysis can be performed for other concurrent extremes.
Table 1. Metrics for analyzing the events of extreme low PV power outputs in the present study.
| Metrics | Definition |
|---|---|
| PV10 | The share of extreme low daily PVPOT values (that is, the number of days falling below the 10th percentile of the PVPOT anomaly distribution over the reference period) |
| PV10N | The number of events of extreme low power outputs per year. Each event is a period of at least three consecutive days of extreme low power outputs (defined according to the 10th percentile) |
| PV10D | The length in days of the longest event during a year |
2.3. Other methods used
Here, we examined PVPOT changes at specific global warming levels, i.e. 1.5 °C, 2 °C, and 3 °C above the pre-industrial level (1861–1880) based on a time sampling method. Among the above warming levels, 2 °C and 1.5 °C are the Paris Agreement goals, whereas 3 °C is similar to late-century warming projected based on current mitigation policies (Rogelj et al 2016, Liu and Raftery 2021). Given that RCMs do not provide global datasets, we use outputs from the GCMs, which initiate the RCM runs, to calculate the timing of global temperature reaching the global warming targets. Following previous studies (Zhang and Zhou 2020, Zhang and Wang 2022), the warming thresholds are determined using the 11 year running average global mean surface air temperature for each GCM. The specific warming periods are then aggregated over the 11 year windows that are centered on the years when respective warming levels occur (table 2). Note that the results regarding specific global warming thresholds in the present study represent a transient response, which is different from the stabilized response at the same global warming level (King et al 2020, Zhang et al 2022a).
Table 2. The timings of 1.5 °C, 2 °C, and 3 °C global warming above pre-industrial level (1861–1880) in RCP8.5 simulation.
| Time period | ||||
|---|---|---|---|---|
| RCM | Driving GCM | 1.5 °C | 2 °C | 3 °C |
| RegCM4.4 | HadGEM2-ES | 2020–2030 | 2031–2041 | 2051–2061 |
| MPI-ESM-MR | 2017–2027 | 2036–2046 | 2057–2067 | |
| NorESM1-M | 2030–2040 | 2045–2055 | 2069–2079 | |
Future changes relative to the reference period (1986–2005) are derived from the difference between projections and historical simulations for individual RCMs. The statistical significance of changes is evaluated using Wilcoxon's rank-sum test imposing a significance level of 0.05. The ensemble-mean signal is the arithmetic mean of the three individual signals from RCMs. If at least one significant individual signal differs in the sign of the projected change, it is considered as 'uncertain'; else if the uncertainty condition is not fulfilled and less than half of the individual signals are significant, it is considered as 'negligible'; otherwise, the ensemble mean signals are referred to as 'robust'. To examine the regional characteristics of solar resources, we divided China into four subregions (figure 1(a)), i.e. the Tibetan Plateau (TP), northwestern China (NWC), northeastern China (NEC), and southern China (SC).
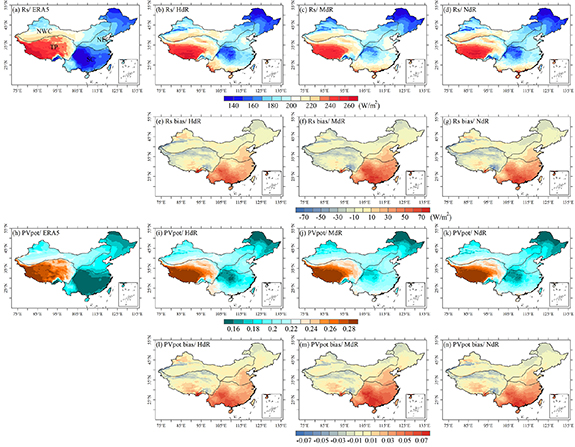
Figure 1. (a)–(d) Spatial pattern of annual mean Rs in the reference period (1986–2005), based on ERA5 dataset and three dynamically downscaled simulations (named HdR, MdR, and NdR). (e)–(g) Bias in annual mean Rs relative to ERA5 dataset in dynamically downscaled simulations. (h)–(k) Spatial pattern of annual mean PVPOT in the reference period, based on ERA5 dataset and dynamically downscaled simulations. (l)–(n) Bias in annual mean PVPOT relative to ERA5 dataset in dynamically downscaled simulations.
Download figure:
Standard image High-resolution image3. Results
3.1. Future changes in PV potential
Before examining future changes, we evaluated the performance of the dynamically downscaled simulations in reproducing the present-day spatial pattern of annual mean Rs and PVPOT over China. During the reference period (1986–2005), the highest Rs over China is on the TP, followed by NWC, while the lowest is in the west-central part of SC. The spatial pattern of PVPOT generally matches that of Rs (figures 1(a) and (h)), suggesting that western China is favored for its abundant PV power, whereas central and eastern China are the least favorable for PV power generation. The spatial patterns of both Rs and PVPOT are considerably captured by all three dynamically downscaled simulations, with a spatial correlation coefficient between RCMs and ERA5 ranging from 0.69 to 0.79 for Rs and 0.80–0.85 for PVPOT (figures 1(a)–(d), (h), (i) and table S2). All three RCMs slightly overestimate both Rs and PVPOT over China by a few percent (table S2), regarding the spatial distribution of biases, Rs and PVPOT are overestimated in SC and parts of NEC but are generally underestimated in NWC and over the TP (figures 1(e)–(g) and (l)–(n)). A rigorous evaluation of models' capability in reproducing surface solar irradiance over China is somehow out of the scope of the present study and has been reported in the previous literature (Wu et al 2022); however, the different RCMs provide similar and reasonable results, indicating good reliability and stability of the current model ability, which builds more confidence for future projection.
There are a few percent changes in Rs over China in a warmer future, projected by dynamically downscaled simulations. An important finding is that regions with high Rs (e.g. TP and SWC) under today's climate tend to experience a decrease in Rs in a warmer future, and vice versa (figures 2(a)–(c)). Although a broadly similar phenomenon has also been projected by an ensemble of GCMs participating in phase 5 of the Coupled Model Intercomparison Project (Wild et al 2015, Yang et al 2018), the RCMs employed here demonstrate a more refined spatial pattern and are expected to be of higher accuracy (Wu et al 2022). Moreover, projected changes in surface air temperature and wind speed, the other two variables that affect PV, are displayed in figure S4. Under a warmer climate in the future, the increase in temperature is most pronounced in high latitudes and high altitudes, while the signal of changes in wind speed is generally negligible. Under the combined effect of the above factors, changes in annual mean PVPOT show a similar pattern to those in Rs, but with differences in magnitude (figures 2(d)–(f)).
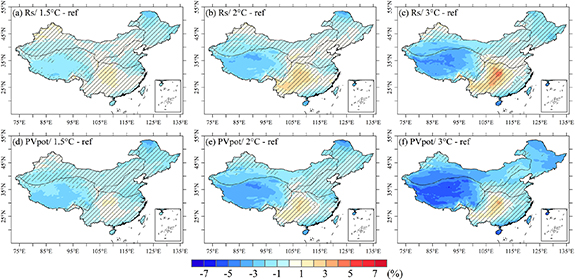
Figure 2. Spatial pattern of changes in annual mean Rs and PVPOT relative to the reference period under the scenarios of 1.5 °C, 2 °C, and 3 °C global warming, based on the ensemble mean. The hatching with forward-slash (/) indicates negligible change, whereas the hatching with backslash (\) indicates uncertain change. Robust change exhibits in the remaining area. For definitions of 'negligible', 'uncertain', and 'robust', refer to section 2.3.
Download figure:
Standard image High-resolution imageIn general, the mean PV potential over China decreases with escalating global warming in the future (figure 3(a)). Specifically, the national average changes in PVPOT relative to the reference period in 1.5 °C, 2 °C, and 3 °C warming futures are −1.1%, −1.5%, and −2.6%, respectively, based on the ensemble mean, implying that if the global warming level is limited to the Paris Agreement goals, the adverse impact of climate changes on PVPOT is expected to be avoided to a considerable extent. In terms of spatial distribution, the decrease in PVPOT is robust in all subregions, except for SC. The TP is projected to experience the most pronounced decrease in PVPOT, with magnitudes of −1.8%, −2.8%, and −4.4% in 1.5 °C, 2 °C, and 3 °C warming futures, respectively. This is followed by NWC and NEC. In terms of spatial distribution (figures 2(d)–(f)), under the 3 °C warming scenario (similar to late-century warming projected based on current mitigation policies), the northwest half of China tends to experience a robust decrease in PVPOT, while this signal is negligible in the southeastern half of China. In addition, under the 2 °C and 3 °C warming scenarios, the decrease in Rs is negligible in the northern and eastern parts of NEC, but this is not the case for PVPOT (figures 2(c) and (f)), which can be mainly explained by the negative effect of elevated temperature (figure S4) on PVPOT (equations (2) and (3)). It is noted that the projected decrease in PVPOT over the TP is robust even under the lowest 1.5 °C warming scenario. The above results indicate the adverse impact of escalating global warming on solar energy in China, suggesting the need for proactive action to mitigate climate change. Another finding is that the currently solar-rich regions in China, such as the TP and parts of NWC (Feng et al 2021, Qiu et al 2022), are expected to suffer the most remarkable decrease in PVPOT in a warmer future, although the magnitudes are confined to a few percentages, which is insufficient to change the overall spatial pattern of solar PV resources over China (figures 1(i)–(k) and S5).
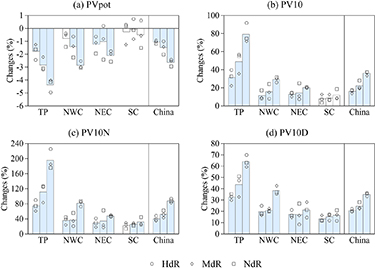
Figure 3. Regional averaged changes in (a) annual mean PVPOT, (b) PV10, (c) PV10N, and (d) PV10D relative to the reference period under the scenarios of 1.5 °C, 2 °C, and 3 °C global warming. Results from each of the three future scenarios are represented by the three adjacent bars, respectively. Dots represent results from individual simulations (see legend), whereas bars represent the ensemble mean signals: colored, grey, or white if robust, negligible, or uncertain, respectively.
Download figure:
Standard image High-resolution imageWe further examine changes in events of extreme low PV power outputs. By definition, PV10 should be close to 0.1 over the base period; however, PV10 estimates calculated over a certain period in the future may be notably different due to changes in the climate. Specifically, PV10 is projected to increase in the vast majority of China in a warmer future, and the spatial range with robust changes in PV10 variation is wider than that with robust changes in annual mean PVPOT (figures 4(a)–(c)). The changes in PV10 over China relative to the reference period are 16.0%, 22.3%, and 36.1% in 1.5 °C, 2 °C, and 3 °C warming futures, respectively, based on the ensemble mean. All subregions will experience a robust increase in PV10, except for SC. The projected increase in PV10 over the TP reaches more than twice the national average, while that over NWC and NEC is slightly below the national average (figure 3(b)). PV10N and PV10D are also projected to substantially increase under future scenarios (figures 3(c) and (d)), and correspondingly, the changes in PV10N (PV10D) over China relative to the reference period are 40.2% (20.7%), 52.2% (24.4%), and 87.9% (35.0%) in 1.5 °C, 2 °C, and 3 °C warming futures, respectively. Regarding the spatial distribution, changes in PV10, PV10N, and PV10D show similar patterns in general, although with different magnitudes (figures 4(c)–(i)). The most pronounced increase in events of extreme low PV power outputs locates in the TP, followed by northern China (north of 40° N) and southern China coast, while the rest of the region shows a relatively moderate change.
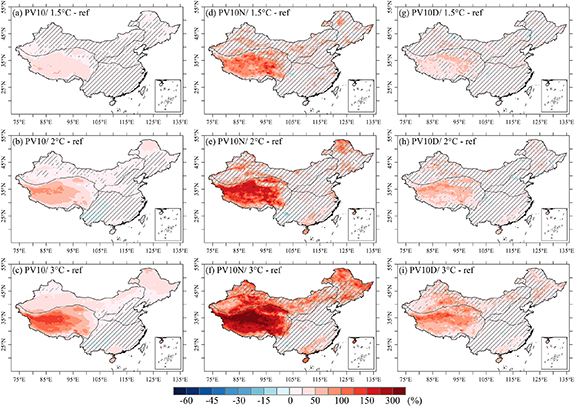
Figure 4. Spatial pattern of changes in PV10, PV10N, and PV10D relative to the reference period under the scenarios of 1.5 °C, 2 °C, and 3 °C global warming. The hatching with forward-slash (\) indicates negligible change, whereas the hatching with backslash (\) indicates uncertain change. Robust change exhibits in the remaining area. For definitions of 'negligible', 'uncertain', and 'robust', refer to section 2.3.
Download figure:
Standard image High-resolution imageIn addition to changes in mean climate state, changes in time variability of PVPOT value are also essential for power outputs, especially since persistent low PV power output affects the network stability and even causes power outages. Although previous studies have investigated projected variabilities of PVPOT at different time scales (expressed as a standard deviation; Jerez et al 2015, Bichet et al 2019, Müller et al 2019), the present study focuses on extreme low daily PVPOT events, i.e. those falling below the 10th percentile of the probability distribution of the daily PVPOT anomalies, shows a more intuitive result. The increasing frequency of extreme low PV output days would make it harder to maintain the production/consumption balance within an electrical grid, and further compromise the economic sustainability of PV projects (Patt et al 2013, Feron et al 2021).
3.2. The reason for future changes in PV potential
PV cells directly convert sunlight into electricity using a semiconductor junction. According to equations (1)–(3), PV energy yields depend on the downwelling shortwave irradiance that is modulated by aerosols and clouds (Zou et al 2019, Li et al 2020, Danso et al 2022), but are also affected by air temperature and surface wind speed. Specifically, cooler conditions generally improve the performance of PV cells and vice versa, whereas air flow typically cools the PV module, thereby improving the performance of PV cells. Although the explanation for mechanisms of the PV potential changes is limited in this work because the relevant physical quantities are not available in CORDEX-CORE outputs, we nevertheless calculate the contributions of individual variables to the projected PVPOT change based on the equation (5). Here, we take the results under the scenario of 3 °C warming as an example, whereas similar but weaker signals are noted under the scenarios of 2/1.5 °C warming (figure S6). The spatial pattern of Rs-induced changes (figure 5(a)) is similar to that of overall changes (figure 2(f)), implying that future changes in PVPOT are dominated by spatially uneven changes in Rs. Moreover, the elevated air temperatures (T) also contribute to the decrease in PVPOT with relatively uniform spatial distribution (figure 5(b)). Compared to the first two, the effect of wind speed (W) is generally negligible (figures 5(c) and (d)). For the national average, the effect of Rs and T on the decrease in PVPOT is comparable; however, the relative contributions of Rs and T vary markedly across subregions. The decrease in Rs superimposed on the negative impact of T on PV outputs results in a remarkable decrease in PVPOT over the TP, while in SC, the positive effect of increasing Rs is offset by the negative impact of T on PV outputs (figure 5(d)). Moreover, regarding the change in days with extreme low PV power outputs in the future, it can be seen that the days with extreme low PV power outputs mainly coincide with those with extreme low solar irradiance, followed by those with extreme high temperatures (figures S7–S8). The substantial increase in extreme low irradiance events in a warmer future dominates the increase in events of extreme low PV power outputs, while the escalating extreme high-temperature events also contribute slightly.

Figure 5. Effects of solar irradiance (Rs), temperature (T), and wind speed (W) on changes in PVPOT relative to the reference period under the scenario of 3 °C global warming. (a)–(c) Spatial patterns of Rs-induced, T-induced, and W-induced changes in PVPOT, based on the ensemble mean. (d) Regional averaged changes in PVPOT induced by changes in Rs, T, and W, respectively. Dots represent results from individual simulations (see legend), whereas bars represent the ensemble mean signals.
Download figure:
Standard image High-resolution image
4. Discussion and conclusion
Based on an ensemble of dynamically downscaled simulations within the framework of CORDEX-CORE, the present study quantifies the impact of climate change on the potential of solar PV resources for China. We demonstrate a slight decrease in annual mean PV potential over China in a warmer future but clear regional differences are exhibited. This decrease is evident over the Tibetan Plateau and northwestern China, where solar resources are currently abundant, but the change of annual mean PV potential is generally negligible over eastern and southern China. However, it is noted that changes in events of extreme low PV power outputs are more pronounced than changes in the mean climate state. The number of days with extreme low PV power outputs is expected to increase significantly over most parts of China, especially over the Tibetan Plateau. We highlight the fact that the relatively modest changes in mean PV potential mask substantial shifts in the number of days with extreme low PV power outputs, and previous studies, which only considered changes in annual/season mean PVPOT (Yang et al 2018, Zhao et al 2020, Park et al 2022, Wu et al 2022) may have overlooked the adverse impact of a substantial increase in extreme low PV output days over parts of China in a warmer future. Moreover, we indicate that the spatial pattern of future changes in surface solar irradiance dominates the heterogeneous response of solar PV resources to global warming, with the elevated temperature further posing a moderate dampening effect on solar PV resources.
The transition to renewables (including solar energy) plays a key role in climate change mitigation strategies. However, solar resources are in turn dependent on weather and climate, a dependency that could affect the feasibility of future low-carbon energy supply systems. Our results show that the climate change impact on PV potential over China is overall negative but even more importantly, the changes in the events with extreme low PV power outputs are more pronounced than changes in mean PV potential. On the one hand, the above results suggest that a more aggressive transition to renewables is needed to mitigate climate change (e.g. meeting the Paris Agreement goals) is beneficial for avoiding the negative impact of warming on PV production. On the other hand, the limit to the reliability of PV production imposed by increased frequency of extreme low PV output days is a key challenge for China's energy system under future scenarios. This calls for holistic deployment plans aimed at exploiting the spatiotemporal complementarity of the resources and thereby minimizing the variability of the renewable supply, such as the combined PV-plus-wind power production (Jerez et al 2019, Tong et al 2021). In addition, both storage energy systems and more advanced solar resource forecasting are also urgently needed (Yang et al 2022). Moreover, it is recommended to incorporate a detailed inter-comparison of various PV technologies in the future, especially those with relatively lower temperature coefficients that will consequently perform better under warming scenarios (Poddar et al 2021).
Although our results provide useful additional information on the issue of the impact of climate change on solar energy potential in China, they can be improved in several ways:
On the one hand, we recognize that the current CORDEX-CORE simulations do not include the radiative effects of aerosols, which can be important for future changes in solar energy (Sawadogo et al 2021). It has been reported that local aerosol concentrations are projected to decline significantly over eastern China under future scenarios (Wilcox et al 2020, Wang et al 2021). Given the projected decline in aerosol concentrations, the Rs may increase by a few percent in those regions, and this speculation is supported by some GCMs that consider the radiative effects of aerosols (figure S9; Wild et al 2015, Zou et al 2019). However, the projected decrease in Rs over western China (especially for the TP) is also supported by those models. Although projected global warming and its implications will be dominated by the levels of greenhouse gases emissions for the long-term (e.g. in the 2nd half of the 21st century; Wilcox et al 2020, Tebaldi et al 2021), the impact of aerosol changes on solar energy over China should be addressed in future works.
On the other hand, technological improvement for PV cells has not been considered in the present study. Research and development in PV cells have led to continual improvements in their conversion efficiency, for instance, it has been shown that the absolute efficiency of monocrystalline silicon considered in this study has increased incrementally with a range of 0.04%–0.09% per year recently (Polman et al 2016). Latest technological developments in the PV industry are also expected to introduce solar cells with relatively lower temperature coefficients that will consequently perform better under future warming scenarios. In addition, the role of complementary technologies (such as energy storage) to increase the overall utilization of incoming solar radiation has not been considered. It would be important to include the effects of technological innovations of solar cells in solar resource assessment studies.
Moreover, the dynamically downscaled simulations used here were driven by only three GCM simulations. However, a larger simulation ensemble with more driving GCMs would provide more robust information, as the analysis of different RCMs (Nikulin et al 2018, Vautard et al 2021). We also recognize that the use of RCMs at convection-permitting resolutions (e.g. Gutowski Jr et al 2020, Zhou et al 2021) is expected to better represent mesoscale systems along with the diurnal cycle of convective clouds, which would enable a more accurate estimate of the solar resource. All these model uncertainties should be refined in future work to inform further improvements in solar energy planning.
Acknowledgments
This study is supported by the Second Tibetan Plateau Scientific Expedition and Research (STEP) Program (Grant No. 2019QZKK0105), the Shanghai B&R Joint Laboratory Project (No. 22230750300), the National Natural Science Foundation of China (41971072), and the Research Fund for International Young Scientists of the National Natural Science Foundation of China (42150410381). Fudan University-Tibet University Joint Laboratory for Biodiversity and Global Change is acknowledged. We sincerely thank three anonymous reviewers for their helpful suggestions and comments. We thank the climate modeling groups for producing and making available their model output (available online: https://esgf-data.dkrz.de/search/cordex-dkrz/). We also thank the European Centre for Medium-Range Weather Forecasts for archiving the reanalysis data (available online: https://cds.climate.copernicus.eu/).
Data availability statement
The data that support the findings of this study are openly available at the following URL: https://esgf-data.dkrz.de/search/cordex-dkrz/.
Conflict of interest
The authors declare no conflicts of interest relevant to this study.
Supplementary data (1.6 MB PDF) Figures S1-S9, Tables S1-S2