

Abstract
In West Africa, very poorly documented are the recovery trajectories of secondary forests, and even less is known about the origin of the observed variability in recovery rates. To understand the relative importance of local and regional environmental conditions on these trajectories, we inventoried all trees larger than 2.5 cm DBH on 236 plots (0.2 ha), aged from 0 to 45 years plus controls, on eight chronosequences representing the typical regional North-South climatic gradient of West Africa. In a hierarchical Bayesian framework, we modelled recovery trajectories of biodiversity, aboveground biomass and floristic composition and tested the influence of variability in local (plot history, landscape context, remnant trees) and regional (climate and soil) conditions on recovery rates. Our results show that (a) diversity recovers faster than composition and biomass, (b) among the local variables, the number of remnant trees has a positive impact on recovery rates while the duration of agricultural cultivation has a negative impact, and (c) among the regional variables, the high seasonality of precipitation and climate, typical of the dry forests of the northern West African forest zone, leads to faster secondary successions. Our simulation approaches have indicated that poor regional conditions can be counterbalanced by adequate local conditions and vice versa, which argues strongly in favour of a diagnosis that integrates these two aspects in the choice of more or less active technical itineraries for forest restoration.
Export citation and abstract BibTeX RIS

Original content from this work may be used under the terms of the Creative Commons Attribution 4.0 license. Any further distribution of this work must maintain attribution to the author(s) and the title of the work, journal citation and DOI.
1. Introduction
In West Africa, secondary forests arising from the abandonment of agricultural fields occupy a prominent place in today's landscapes. Secondary forests have a distinct floristic composition (Amani et al 2021) and lower biomass (N'Guessan et al 2019) than the original old-growth forests, but they can still provide a wide range of goods and services to human societies (Amahowe et al 2018, Doua-Bi et al 2021), locally (e.g. provision of fuelwood, non-timber forest products), regionally (e.g. regulation of the water cycle, provision of timber) and globally (e.g. carbon storage, biodiversity reservoirs). Notably, they can store more carbon than agricultural fields (N'Guessan et al 2019), even if those fields are conducted in agroforestry (Sanial et al 2022). The main factor that has driven the historical expansion of secondary forests in West Africa is the development of family farming (Bayas et al 2022), linked to rapid demographic growth, which results in a pioneer front dynamic (Pouliot et al 2012). As such, West African farmers cultivate clear-cut lands for a few decades before migrating elsewhere once soil fertility is depleted and then eventually returning again once fertility is restored after a few decades of fallowing (Ruf et al 2015). Despite the crucial importance of these secondary forests resulting from agricultural fallows in the functioning of human societies (Sanial et al 2022) and in the structuring of West African landscapes, there is still a serious lack of knowledge on the trajectories, and their main local and regional determinants, of forest recovery in this region of the world (Schroeder et al 2010).
Globally, the great resilience of tropical forests has been demonstrated by numerous local (N'Guessan et al 2019, Amani et al 2021) and pantropical (Poorter et al 2021a) studies, that have documented that most of the important characteristics of the forest (structure, soil properties, functional traits, biodiversity) can be recovered in a few decades, except for composition and biomass, for which it requires one or several centuries. Behind this apparent great resilience, however, lies a great variability of trajectories (Arroyo-Rodríguez et al 2015, Norden et al 2015), a variability linked to locally heterogeneous environmental conditions (N'Guessan et al 2019) and/or to large regional pedoclimatic gradients (Poorter et al 2016, Rozendaal et al 2019).
- Locally, the main factors controlling the trajectories of recovery are relatively well identified today. First, the number of remnant trees (forest trees spared during the establishment of agricultural crops) significantly modifies the microclimate in the fallow and attracts dispersing animals such as monkeys and bats (Derroire et al 2016), allowing for a faster recolonisation by old-growth trees (Amani et al 2021). The agricultural practices that preceded the farmer's abandonment of the land are also a determining factor to consider. For example, the greater the duration and intensity (use of pesticides, plowing) of cultivation, the more the soils are depleted not only in nutrients but also in propagules, thus preventing a rapid start of secondary succession (Amani et al 2021). Finally, forest connectivity is crucial because old-growth forests serve as seed/propagule reservoirs and often constitute habitats for dispersing animals (Arroyo-Rodríguez et al 2015).
- Regionally, the influence of climate variability on ecosystem recovery rates has, to our knowledge, never been addressed in West Africa. Most of the studies conducted in West Africa have been carried out at very small scales (N'Dja and Decocq et al 2008, N'Guessan et al 2019, Amani et al 2021), even though the strong South-North climatic gradient in West Africa (Feng et al 2013), which is manifested by a rapid transition, in a few hundred kilometres, from evergreen forests to semi-deciduous and then to dry forests (figure 1), prevents the widespread use of the results. Previous works conducted under the neotropics suggests that the harsher the climate (strong seasonality, little precipitation), the slower the rate of biomass (Poorter et al 2016) and floristic composition (Rozendaal et al 2019) recovery. However, recent work in West Africa has shown that the flora of dry forest areas is more resilient than that of humid forests (Fauset et al 2012). On the other hand, it seems important to couple this regional climatic variability to the regional variability of soils, knowing, for example, that the capacity of plants to resist drought depends not only on precipitation but also on the properties of the soil that retain water to a greater or lesser extent (Wagner et al 2011).
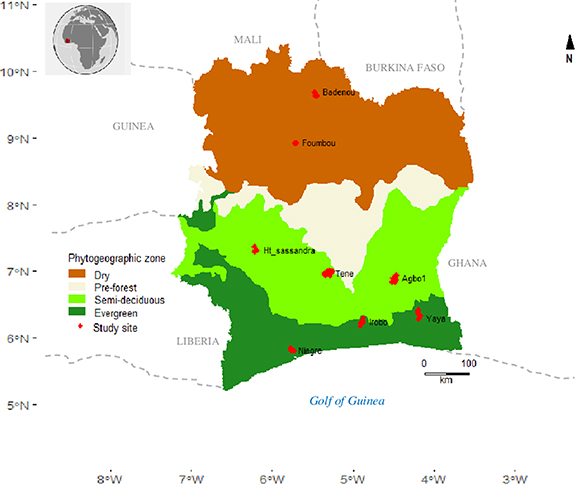
Figure 1. Bioclimatic map and distribution of the eight chronosequences (20 plots including 4 old-growth forest plots, 0.2 ha each) in the phytogeographic zones of Côte d'Ivoire.
Download figure:
Standard image High-resolution imageFew studies have focused on the relative importance of local and regional factors on trajectories of recovery (Crouzeilles et al 2016). However, it is very likely that the two categories of factors interact strongly to determine original and specific trajectories for each location (Vítovcová et al 2021). In the context of African governments' commitments to restore 100 million hectares of degraded and deforested land in Africa by 2030 (Bond et al 2019), a high degree of local variability, induced by the surrounding environmental context and/or the specific history of each plot, in the natural restoration capacities of the forest could seriously complicate the implementation of public policies at regional scale.
In this study, we focused on the recovery trajectories of three complementary (Poorter et al 2021a) ecosystem attributes: aboveground biomass, biodiversity and the floristic composition of tree species, and assessed how recovery rates are influenced by a wide range of local and regional covariates. We will tackle the following questions: (a) What are the relative rates of recovery of biomass, biodiversity and floristic composition of trees in abandoned agricultural fields in West Africa? (b) What is the relative influence of regional pedoclimatic and local environmental variables on the recovery rates of the three attributes studied? (c) What lessons can be drawn for the management of secondary forests in West Africa?
2. Materials and methods
2.1. Sampling strategy
The sampling covers three phytogeographic areas of Côte d'Ivoire, West Africa (figure 1): (a) evergreen forests are found in the ombrophilous zone; (b) semi-deciduous forests in the mesophilous zone and (c) open dry forests in the Sudanese zone. This gradient corresponds to an annual precipitation gradient that varies between 2500 mm in the south and 1100 mm in the north. The average annual temperature is around 26.5 ∘C but with much higher daily and seasonal temperature variations in the north than in the south.
We set up eight chronosequences and, in each chronosequence, we established 20 plots of 0.2 ha corresponding to different ages of the plots since their abandonment by the local farmers. Care was taken to ensure that all ages were represented in each chronosequence, with a total of 32 plots per age class ( years, 11–20 years, 21–30 years,
  years) and 32 old-growth forests (never logged or burnt in human memory and with no visible signs of disturbance). Botanical names, diameter at breast height (DBH) and height of all stems at least 2.5 cm DBH were measured from October 2016 to October 2020. We chose the threshold of 2.5 cm DBH because young trees are an important component of early successional stages (Swaine and Hall 1983).
We collected a set of environmental variables (table 1) to characterise (a) local variability related to the plot itself (soil hydromorphy, presence of remnant trees), its history (type and duration of previous crop) and its landscape context (forest proximity, connectivity) and (b) regional variability of climate (temperature, precipitation) and soils (density, texture).
- The local variables were collected in situ, i.e. in the field. A survey, prior to the choice of the plot, with the owners (current and former) of the abandoned fields and with Sodefor, the forest service in charge of forest management and protection in Côte d'Ivoire, provided information on the management history of the plot (type and duration of past cultivation) and the status of each tree (remnant or not), as well as the exact age of the secondary forest plots. The landscape context (density of old growth forest, distance to old growth forest) was recorded in situ, details in table 1. Local soil hydromorphy was estimated in the field, i.e. it was generally low-lying areas, plots located near river banks or plots located in areas where the micro topography makes them temporarily retain water.
- The regional variables were acquired in silico, i.e. through the climatic and soil databases available online. The climate variables were extracted from the Worldclim 2 database with a resolution of 10 min (Fick and Hijmans 2017). The intermediate resolution of 10 min was chosen in order to capture the broad regional climatic gradients and not capture particular microclimates. Soil variables were extracted from the SoilGrids version 2.0 databases at a depth of 0–5 cm (Poggio et al 2021), a depth that is crucial for understanding the influence of the topsoil on the early stages of successional dynamics.
Table 1. table of regional and local environmental variables used to predict recovery trajectories in West African Secondary Forests.
| Variable | Description | Units | Source |
|---|---|---|---|
| Regional covariates | |||
| Annual mean temperature | Average temperature for each month | 0.1 ∘C | http:worldclim.org |
| Temperature annual range | Difference between the Max of the warmest and the Min of the coldest month | 0.1 ∘C | http:worldclim.org |
| Temperature seasonality | Ratio of the standard deviation to the mean monthly temperature |

| http:worldclim.org |
| Annual precipitation | Total precipitation for each month | mm | http:worldclim.org |
| Precipitation seasonality | Ratio of the standard deviation to the mean monthly total precipitation |

| http:worldclim.org |
| Bulk density | Bulk density of the fine earth fraction | kg dm−3 | http:soilgrids.org |
| Coarse content | Volumetric fraction of coarse fragments |

| http:soilgrids.org |
| Clay content | Proportion of clay particles (< 0.002 mm) in the fine earth fraction |

| http:soilgrids.org |
| Sand | Proportion of sand particles (> 0.05 mm) in the fine earth fraction |

| http:soilgrids.org |
| Local covariates | |||
| Hydromorphy | Ferralithic (0) or hydromorph (1) soils | / | Field-measured |
| Remnants | Number of left-alive isolated trees from the former old-growth forest | trees ha−1 | Field-measured |
| Density | Presence of old-growth forest within a 500 m distance on the eight cardinal points | frequency | Field-measured |
| Proximity | 1/Distance to the nearest old-growth forest fragment | 1 m−1 | Field-measured |
| Crop | Annual (0) or perennial (1) crops | / | Field-measured |
| Duration | Duration of the previous crop grown | Year | Field-measured |
2.2. Computing ecosystem attributes
All calculations have been made without remnant trees, which are the legacy of old-growth forests, i.e. trees that were present before cultivation was established.
2.2.1. Aboveground biomass
We calculated the biomass of all trees in each plot. Then we summed them up and brought the total value to one hectare. The generic allometric equations that include DBH, height and timber density values from the BIOMASS package (Réjou-Méchain et al 2017) in R was used for this calculation.
2.2.2. Diversity
Shannon diversity (or first-order diversity transformed into Hill number) was calculated using the entropart package (Marcon and Hérault 2015) using the unbiased estimator. The Shannon diversity allows to take into account simultaneously richness and equitability: the higher the number of codominant species in the community, the higher the estimator (Marcon et al 2014).
2.2.3. Composition
To assess the similarity between the tree species composition of secondary forest (SF) and old-growth forest (OGF) plots in a given chronosequence, we calculated the Chao-Jaccard abundance-based estimator between all SF-OGF pairs of possible combinations. We made this choice in order to reduce the large variability that might exist between OGF sites within a given chronosequence (Poorter et al 2021a). This is a kind of resampling method in the 'meta-community' of old-growth forests in order to take into account the natural variability between old-growth forest communities. The similarity indices between old-growth forests, i.e. OGF-OGF, represent in this approach the end of successional trajectory values.
2.3. Modelling framework
2.3.1. Modelling recovery trajectories
We parameterised an ecosystem attribute recovery model that has already been successfully tested to predict the recovery trajectories of biomass (N'Guessan et al 2019), biodiversity (Amani et al 2021) and timber volumes (Doua-Bi et al 2021):
with
 : the value of the attribute X (biomass, diversity or composition) of the plot from chronosequence s of age t
 : the starting point of the attribute X when the recovery starts, in chronosequence s
 : the ending point of the fully recovered attribute X in chronosequence s, namely the asymptotic value of the attribute X on time
αX : a parameter link to the inflexion point (before, the recovery rate increases with age and after, it decreases) of attribute X
 : the variance of the lognormal law used to infer attribute X.
Starting points and ending points were both encapsulated into two lognormal hyperlaws centred around different values for each bioclimatic area, namely:
 : the starting point of the attribute X when the recovery starts, in bioclimatic area z
 : the ending point of the fully recovered attribute X in bioclimatic area z
 : the variance of the hyperlaw over starting points for attribute X
 : the variance of the hyperlaw over ending points for attribute X
 , the intrinsic recovery rate of attribute X, this rate is exponentially-transformed to always be defined on
  .
.
In order to infer the model and determine the a posteriori distribution of all above-mentioned model parameters, we chose to use a lognormal likelihood law because  is positive and defined on
  .
.
2.3.2. Effects of the local and regional variables
To test the effect of each variable on the rate of recovery κ, we introduce them into the model at the plot level p through this equation:
where  , is the effect of variable i on the intrinsic recovery rates of attribute X and
  is the standardized value of variable i in plot p.
In order to obtain a model that is as parsimonious as possible and not over-parameterised, we proceeded to a step-by-step forward variable selection stage using the Akaike information criterion (AIC) in a Bayesian framework. All variables were standardised beforehand in order to be able to directly compare their respective effects on the intrinsic recovery rates.
The model was written in Stan (Carpenter et al 2017) and then inferred in a Bayesian framework using the Hamiltonian Monte Carlo algorithm. The priors chosen for the parameters are uninformative, as follows


2.3.3. Relative importance of local vs regional variables
To study the relative importance of local and regional variables on the trajectories of recovery of the attributes studied, we simulated six recovery scenarios. For the first three scenarios, we set the values of the regional variables to their averages, i.e. to 0 as they are normalised, and consider three local situations: favourable (values of the local variables retained equal to 2 when beta is positive and −2 when beta is negative), average (values of the local variables retained equal to 0) and unfavourable (values of the local variables retained equal to −2 when beta is positive and 2 when beta is negative). For the next three scenarios, we set the values of the local variables to their averages, i.e. to 0 as they are normalised, and consider three regional situations: favourable (values of the regional variables retained equal to 2 when beta is positive and −2 when beta is negative), average (values of the regional variables retained equal to 0) and unfavourable (values of the regional variables retained equal to −2 when beta is positive and 2 when beta is negative). The detailed set of values used in the simulation is available
3. Results
A total of 50 738 individual trees were inventoried. They belong to 646 species from 340 genus within 75 families. Among those species, 173 were unique to the evergreen area, 184 to the semi-deciduous area and 89 to the dry area. Only 13.45% of the species were shared between the three zones. In the evergreen area, 101 species are unique to secondary forests, 106 are unique to old-growth forests and 171 shared. In the semi-deciduous area, 115 species are unique to secondary forests, 97 are unique to old growth forests and 180 shared. In the dry area, 32 species are unique to secondary forests, 15 to old-growth forests and 75 shared. Finally, the composition similarity was on average 0.61, 0.64 and 0.67 between old-growth forests of the, respectively, evergreen, semi-deciduous and dry areas while this similarity dropped to 0.18, 0.18, 0.36 between young (less than 10 years) secondary and old-growth forests.
The three attributes studied (biomass, diversity, composition) are effectively recovering over time, whatever the type of West African forest considered (figure 2). Visually, a very high variability of recovery trajectories can be observed between chronosequences. This variability is, in part, linked to the great variability of the end points, i.e. the asymptotes of the recovery trajectories. In particular, there is a positive gradient in asymptotic biomass from dry forests to evergreen forests, through semi-deciduous ones. This gradient is also valid for diversity but not for composition.

Figure 2. Recovery trajectories of ecosystem attributes (biomass, composition and diversity) for eight chronosequences of secondary and old-growth forests located in the three major forest types (evergreen in dark green, semi-deciduous in light green and dry in orange) of West Africa. The dots represent secondary forests, the triangles represent old-growth forests at the end of the recovery trajectory, the lines represent the trajectory with the maximum likelihood for each chronosequence.
Download figure:
Standard image High-resolution image3.1. Recovery rates and times
On average, diversity has the highest rate of recovery, followed by composition and then biomass (figure 3). In terms of recovery time, the restoration of 50% of the value of the three attributes studied is reached in less than 35 years at the regional scale (table 2). In contrast, it will take more than 60 years to recover more than 90% of the initial biomass and composition in secondary forests (table 2 and figure 3).
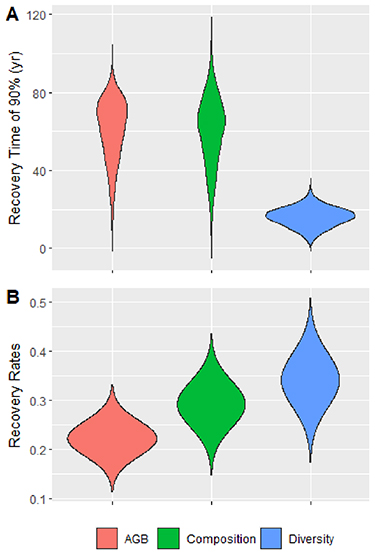
Figure 3. (A) A posteriori distribution of the recovery time of 90% of the value of each attribute (biomass in red, composition in green and diversity in blue) in secondary forests with reference to old-growth forests. (B) A posteriori distribution of the intrinsic recovery rate of ecosystem attributes estimated at maximum model likelihood.
Download figure:
Standard image High-resolution imageTable 2. Values (medians and quantiles) of the parameters of the recovery trajectories' models for the three explored forest attributes (biomass, composition, and diversity). θ0 is the starting point of the trajectories of recovery and  the final point of the attribute of each site, κ indicates the instantaneous rate of recovery, σ the model error, time (50%) is the recovery time of 50% of the attribute and time (90%) is the recovery time of 90% of the attribute.
| Parameters | Biomass | Composition | Diversity |
|---|---|---|---|
| θ0 | 0 [0 ; 0] | 0.16 [0.08 ; 0.31] | 3.34 [2.31 ; 4.32] |

| 163.37 [110.08 ; 240.18] | 0.63 [0.57 ; 0.70] | 21.79 [17.46 ; 28.27] |
| κ | 0.24 [0.02 ; 0.47] | 0.26 [0.03 ; 0.47] | 0.36 [0.11 ; 0.48] |
| α | 23.29 [11.27 ; 30.24] | 22.97 [10.45 ; 32.01] | 6.04 [2.76 ; 8.90] |
Time 
| 34 [31 ; 39] | 34 [28 ; 42] | 9 [7 ; 12] |
Time 
| 63 [56 ; 71] | 62 [52 ; 77] | 16 [12 ; 21] |
3.2. Drivers of recovery rates
Of all the covariates (15 in total, see table 1) that were used in the selection procedure, 10 were actually retained in at least one of the three models (diversity, composition, biomass) and thus had effects on the corresponding recovery rates. Biomass and diversity were influenced by a large number of covariates (7 each, see figure 4) compared to composition (only 5).

Figure 4. Effect of regional covariates (green), and local covariates (red) on recovery rates for ecosystem attributes (biomass, composition and diversity). All covariates have been standardised, their relative effects are directly comparable.
Download figure:
Standard image High-resolution image3.2.1. Regional covariates
Temperature annual range, precipitation seasonality, soil bulk density, and soil coarse content had positive effects on one, two or all three of the attribute recovery rates (figure 4), while annual precipitation only influenced diversity recovery rates with a negative effect (figure 4). Seasonality of precipitation is the most important variable at the regional level since it influences the rates of biomass recovery, composition and diversity. The strength of this effect was greatest on composition ( ) then diversity (
 ) and finally biomass (
 ).
).
3.2.2. Local covariates
The number of remnant trees and soil hydromorphism are very important variables because they influence the rates of reconstitution of all attributes (figure 4). The effect of the number of remnants is always positive and greatest on the recovery rate of composition ( ), then on diversity (
 ), and finally on biomass (
 ). The effect of soil hydromorphism is always negative and more pronounced on composition (
 ), then on diversity (
 ) and finally on biomass (
 ). Lastly, forest density positively influences the rate of biomass recovery (
 ) and negatively influences the rate of diversity recovery (
 ).
).
3.3. Local versus regional importance
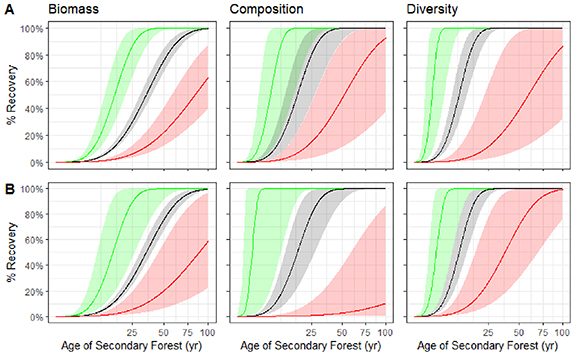
Overall, the general signal is that variability in local conditions (figure 5(A)) as well as variability in regional conditions (figure 5(B)) lead to significant changes in recovery trajectories. Beyond this general signal, we note that composition is slightly more influenced by regional covariates and diversity is slightly more influenced by local covariates. When local conditions are favourable (figure 5(A), green curves), diversity is the attribute that recovers the fastest, followed by composition and biomass. When regional conditions are favourable, composition recovers first (figure 5(B), green curves), followed by diversity and biomass. Nearly 100% of diversity and composition are recovered in less than 25 years when both local and regional conditions are favourable. In contrast, under unfavourable regional conditions, composition hardly recovers at all over the time scale studied.
Figure 5. Variability of recovery trajectories under different local (A) and regional (B) scenarios on the three forest attributes. Solid lines represent prediction trajectories at their maximum likelihood and shaded areas represent the 95% credibility interval. (A) Regional average conditions associated with, in red unfavourable local conditions, in black average local conditions, in green favourable local conditions. (B) Local average conditions associated with, in red unfavourable regional conditions, in black average regional conditions, in green favourable regional conditions.
Download figure:
Standard image High-resolution image
4. Discussion
Diversity is the first attribute to be recovered with, on average, 90% recovery within 20 years. In terms of composition and biomass, it will take more than half a century for West African secondary tropical forests to recover values comparable to old-growth forests. We also found that both types of covariates tested, local and regional, play a very strong role in recovery trajectories but do not influence the attributes studied in the same way. We were able to determine that diversity was more influenced by local covariates. On the other hand, the rate of recovery of composition is somewhat more related to regional covariates. Finally, biomass is influenced by both local and regional conditions. The simulation approach indicates that, despite the greater or lesser weight of local versus regional conditions in controlling recovery rates, poor regional conditions can be counterbalanced by adequate local conditions and vice versa.
4.1. Recovery rates depend on forest attributes
Estimated recovery times vary considerably between attributes (figure 3(A)), a result observed in most secondary forests worldwide (Poorter et al 2021a). The recovery of 90% of diversity in less than 20 years (figure 3(B)) shows the very high resilience of West African forest biodiversity. Similar results have already been observed in neotropical forests where only 20 years were sufficient for secondary forests to recover 90% of their species richness and diversity (Lennox et al 2018, Barros et al 2020). The fast recovering of diversity may be linked to the intermediate disturbance hypothesis where biodiversity quickly peaks in recovering forests because of the co-occurrence of persisting pioneer species and shade-tolerant species that established in the shade of these pioneers (Rozendaal et al 2019).
In contrast, secondary forests take, on average, more than six decades to recover 90% of the composition of old-growth forests in our study. This may be explained by the high similarity index between old-growth forests and can be explained by the late arrival of understory forest species in secondary forests that remain thus highly dynamic in composition for a long time. These results corroborate observations made in the central Congo basin where the convergence of the floristic composition of young forests towards the community composition of old-growth forests was slower as compared to diversity (Makelele et al 2021) and echo work done in the neotropics (Rozendaal et al 2019) and in Southeast Asia (Deng et al 2018) where the return of old-growth forest species can take hundreds of years, mainly because of their poor dispersal abilities, especially since a number of these species are dispersed by large animals that also suffered during the time the area was deforested for agriculture. For biomass, it also takes several decades for secondary forests to recover 90% of the biomass of old-growth forests. This long time lag could be explained by the fact that young secondary forests in West Africa have low biomass productivity (N'Guessan et al 2019), and because the regeneration of very large emergent trees, typical of West African landscapes, highly depends on the presence, in the plots, of remnant trees that provide seeds typical late-successional species (Doua-Bi et al 2021). However, these results contrast somewhat with those of the Congo Basin where biomass recovery is much slower, with only 32% recovered by secondary forests in 60 years (Makelele et al 2021), a discrepancy that can be linked to the greater biomass in the old-growth forests of Central Africa (Avitabile et al 2016).
4.2. Faster recovery under drastic pedoclimatic regional conditions
By far the most important variable at the regional scale is the precipitation seasonality, which has a very marked positive effect on the recovery rates of the three attributes studied (figure 4). This precipitation seasonality gradient corresponds, in West Africa, to a South-North gradient with, in the South, evergreen forests where precipitation is regularly distributed over the year and, in the North, open and dry forests where precipitation is concentrated over a few months (Feng et al 2013). It has already been noted several times that recovery trajectories are totally different in tropical rainforests and dry forests, linked to a particular flora and more drastic biophysical constraints in dry forest (Poorter et al 2019). However, it has often been argued that total precipitation and thus water availability positively influence recovery rates (Becknell et al 2012, Rozendaal and Chazdon 2015, Poorter et al 2016). This is not the case in our study where biomass, diversity and composition recover faster in areas with high precipitation seasonality (figure 4) and different, non-exclusive explanations can be mobilised. (a) In areas with high seasonality, herbaceous species are mainly annual and only live for a few months so that the soil is completely bare at the end of the long dry season (Hérault and Hiernaux 2004), which offers the opportunity for woody species to germinate more easily every year when the rains return. In contrast, in low-seasonality areas, perennial herbaceous plants quickly colonise the abandoned field and make it more difficult for tree seeds to germinate. (b) In low-seasonality evergreen forests, the early part of the succession process is dominated by heliophilous woody species (Herault et al 2010, Hérault et al 2011, Mirabel et al 2019) or pioneer lianas that transiently prevent the germination of late-successional forest species (Finegan 1996, Hérault and Piponiot 2018). These cohorts of pioneer species are absent from dry forests and succession begins at abandonment with slow-growing, hardwood species (Poorter et al 2019), most of which are found at the end of succession (figure 2). (c) In terms of structure and biodiversity, West African dry forests are simpler than their evergreen or semi-deciduous counterparts, so their reconstitution may be less complex.
Two additional variables appear to positively influence recovery rates: temperature annual range and soil bulk density. Concerning temperature, as with our results for precipitation, the mean annual temperature had no effect on the recovery rates of the three attributes evaluated (figure 4), whereas its variability through the temperature annual range positively influences the rate of composition recovery. Regarding bulk density, our results may seem contrary to those suggesting that soils that are too compact prevent good vegetation development (Gu et al 2018). It is remarkable that the most drastic soil and climatic conditions (compact soils and high temperature annual range) lead, somewhat paradoxically, to a faster recovery due to the impossibility of following a classical succession path with successive cohorts of pioneers, long-lived pioneers and mature forest species (Finegan 1996). It is also interesting to note that, for these two variables, the development of the forest will profoundly modify their values. Indeed, the reconstitution of the forest will (a) generate an increasingly buffered microclimate where daily thermal amplitudes will be less perceptible (Ellison et al 2017) and (b) decompact the soil through the action of the tree roots which will increase the porosity and stability of the aggregates (Gu et al 2018), thus improving the soil's water conduction capacity (Ajayi and Horn 2016).
4.3. On the importance of the local environment
Regardless of the attributes, the local variables retained by the selection procedure are comparable and show similar effects on recovery rates (figure 4). Two variables appear to be very important because they were selected for all of the attributes, namely remnant trees and local soil hydromorphy. (a) Remnant trees have a very positive influence on forest recovery rates (figure 4). Presence of remnant trees improves environmental conditions (da Duarte et al 2010, Pérez-Cárdenas et al 2021) by attracting seed dispersers such as birds (de la Peña-Domene et al 2014) and bats (Galindo-González and Sosa et al 2003, Derroire et al 2016). Recent work has shown that the abundance of remnant trees on a given site directly impacts seed rainfall, and thus affects the density of the stand being replenished (Wu et al 2022). Indeed, these remnant trees left (in)voluntarily in the field allow for rapid initiation of secondary succession (Yarranton and Morrison 1974) and may also facilitate the regeneration of slow-growing species that are typically late-trajectory species, allowing for faster passage through the early stages of succession (Tucker and Kashian 2018). (b) Local soil hydromorphy has a negative effect on biomass recovery rates, composition, and diversity (figure 4). Hydromorphic soils have a particular flora that is adapted to temporary excesses of water. For instance, the presence on hydromorphic soils of extremely competitive herbaceous species of the Maranthaceae family (Cuni-Sanchez et al 2016), which form monospecific mats, hinders the regeneration of other plants.
Among other local variables, but of lesser importance, the duration of agricultural cultivation has a negative effect on the rates of biomass and diversity recovery (figure 4). This duration of cultivation directly influences the abundance of seed and shoot banks, and the soil global fertility (Kennard et al 2002) which are essential for a rapid return of biomass and biodiversity. Secondary forests that have developed on long cultivated sites are dominated by species that are resistant or adapted to repeated disturbance and low soil fertility, sometimes resulting in irregular successional trajectories (de Cássia Guimarães Mesquita et al 2015, Jakovac et al 2016). Secondly, the density of forests in the landscape and/or the proximity of old-growth forests also positively influences recovery. Old-growth forests around secondary forests constitute a seed bank of various trees and shelters for certain animals (Rozendaal et al 2019), they ensure landscape connectivity and provide corridors for the movement of seed dispersing animals. However, as old-growth forest cover has strongly decreased in West African landscapes, secondary plots move from being surrounded by old-growth forest to being surrounded by less and less old-growth forest and more secondary forests. This leads to limited availability of old-growth species as succession proceeds (Melo et al 2013, Gilroy et al 2014, Mendenhall et al 2014) and, in turn, limits our ability to relate the observed succession trajectory (especially for aged secondary plots) to the current environment, which may be very different from the environment in which succession began.
4.4. Lessons for better management of West African secondary landscapes
West Africa is home to a large rural population for whom subsistence agriculture is at the expense of forests (Somorin 2010). In other words, deforestation and forest degradation are largely attributable to small-scale, non-mechanised clearing for agriculture (Appiah et al 2007, Curtis et al 2018, Duguma et al 2019). Secondary forests resulting from this deforestation represent a large part of the West African landscape and are valuable to local people. These secondary forests provide valuable ecosystem services, including timber and fuelwood, fodder for livestock, non-timber forest products, and also contribute to water purification (Amani et al 2021, Doua-Bi et al 2021, Sanial et al 2022). In order to ensure that these secondary forests can continue to provide these services and cleared land is reduced to a few suitable areas, it would be necessary to
- Promote sustainable, i.e. non-shifting, agricultural practices such as agroforestry in an agro-ecological transition to ensure the maintenance of household income
- Develop community-based management practices for secondary forests, which do not currently exist, so as not to tie the future of a given forest to an individual decision
- Support commercial chains of non-timber forest products to increase economic benefits from secondary forests (which cannot yet produce timber)
- Assess soil fertility to decide first the suitability of an area for agriculture, and if the site is not suitable compared to other nearby areas, conserve the area to recover forest.
For rapid restoration, local conditions are very important as they condition the initiation of secondary succession after land abandonment. Hence, we have demonstrated the great importance of remnant trees in agricultural fields and fragments of old-growth forests in the nearby environment of abandoned fields to sustain the seed rain and to create landscape connectivity that ensures the movement of disseminating animals. In order to keep the landscape suitable for rapid secondary succession, one should therefore
- Avoid large-scale deforestation, partly caused by concessions granted to large private companies, which totally destructure the landscape, eliminate all remnant trees and thus handicap natural recovery once industrial cultivation is abandoned.
- Protect remnant trees in small farmers' fields by giving the latter true ownership of these trees, so as to consider them as standing capital to be preserved, so that these trees can no longer be sold as concessions granted to timber companies by the governments.
- Systematically protect the few remaining old-growth forests as the main seed sources for natural reforestation.
Regional conditions determine recovery trajectories that are specific to each studied attribute and phytogeographic zone (figure 2). Overall, climatic conditions in the northern part of the study area (dry forests with high variability of precipitation and temperature) are much more suitable for rapid forest restoration (especially of composition, figure 4) than conditions in the south (evergreen forests with low climatic variability). These results suggest that there is a need for politicians, decision-makers and other actors involved in forest management to take into account both the variability of regional climatic conditions and local conditions related to plot history and landscape context in a decision-making framework for the choice of more or less active restoration techniques. The main lines that can be drawn from our study are as follows:
- In the North, when the local context is favourable (good connectivity, presence of numerous remnant trees), we propose to allow secondary succession to take place and to better value these forests in recovery thanks to a community management of the natural resources which are therein.
- In the North, when the local context is unfavourable (poor connectivity, no or few remnant trees), we propose to (a) leave the possibility of converting a part of these surfaces for subsistence agriculture and (b) for the remainder, use assisted natural restoration techniques (Chomba et al 2020) to accelerate the installation/growth of trees. Assisted regeneration have already proved their worth in Sahelian and Sudanian zones and could be implemented at little cost in dry forests where the flora is relatively similar.
- In the South, when the local context is favourable, we propose cleaning, depressing and pruning young trees. Indeed, the relative slowness of reconstitution is not linked here to a lack of regeneration but to competition from herbaceous plants, lianas and pioneer species. These targeted silvicultural interventions also make it possible to manage the forest stand in such a way as to favour species that are useful to local populations.
- In the South, when the local context is unfavourable, succession is so slow that more active interventions by planting local species should be considered if the objective is to reconstitute a forest cover within a few decades. With this in mind, we recommend reforesting with a mixture of local species (Hérault et al 2020) in order to minimise the ecological, health and commercial risks (Messier et al 2022) and using Taungya-type planting techniques which, during the first few years of planting, allow the rural population to farm while maintaining the young plants (Kalame et al 2011).
Beyond that, the technical management options for secondary forests proposed above are only broad guidelines to orient public policies, technical services and to optimise investment and training efforts according to the restoration strategies that are most likely to be implemented in a given region. However, these broad guidelines cannot be used alone in a top-down planning of actions and must imperatively be accompanied by a field diagnosis in the target abandoned fields. This diagnostic stage will certainly be biophysical in order to estimate the real potential for forest restoration based on the current state of the secondary succession, but also socio-economic in order to integrate the aspirations and room for manoeuvre of smallholders in the choice of technical itineraries and species to be promoted.
Acknowledgments
This work was done under the framework of the DynRecSE Project (PReSeD-CI 2 funding) that was financially supported by the Ministry of Higher Education and Scientific Research (MESRS) of Côte d'Ivoire as part of the implementation of the C2D by the Institute of Research for Development (IRD).
Data availability statement
The data that support the findings of this study are available upon reasonable request from the authors.
Authors contribution
Bienvenu H K Amani: conceptualization, data curation, formal analysis, investigation, methodology, validation, visualization, writing—original draft.
Anny E N'Guessan: conceptualization, data curation, methodology, supervision, writing—review & editing.
Victor Van der Meersch: data curation, writing—review & editing.
Géraldine Derroire: conceptualization, supervision, writing—review & editing.
Camille Piponiot: conceptualization, supervision, writing—review & editing.
Justin K N'dja: conceptualization, funding acquisition, investigation, methodology, project administration, resources, supervision, writing—review & editing.
Aka G M Elogne: writing—review & editing.
Karidia Traoré: writing—review & editing.
Bruno Hérault: conceptualization, data curation, formal analysis, investigation, methodology, software, supervision, validation, visualization, writing—original draft.
: Appendix
Detailed set of parameter values used in the simulation schemes (U: unfavourable; M: medium; F: Favourable) to study the relative importance of local and regional variables on the trajectories of recovery of the three attributes studied.
A: Regional mean conditions associated with unfavourable local conditions, medium local conditions and favourable local conditions.
B: Local mean conditions associated with unfavourable regional conditions, medium regional conditions and favourable regional conditions.
 : effect of annual precipitation;
  : effect of bulk density;
  : effect of coarse content;
  : effect of density;
  : effect of duration;
  : effect of hydromorphy;
  : effect of precipitation seasonality;
  : effect of proximity;
  : effect of remnants;
  : effect of temperature annual range.
A
| Biomass | Composition | Diversity | |
|---|---|---|---|
| U M F | U M F | U M F | |

| - - - | - - - | 0 0 0 |

| 0 0 0 | 0 0 0 | - - - |

| 0 0 0 | - - - | - - - |

| −2 0 2 | - - - | 2 0 −2 |

| 2 0 −2 | - - - | 2 0 −2 |

| 2 0 −2 | −2 2 2 | 2 0 −2 |

| 0 0 0 | 0 0 0 | 0 0 0 |

| - - - | - - - | −2 0 2 |

| −2 0 2 | −2 0 2 | −2 0 2 |

| - - - | 0 0 0 | - - - |
B
| Biomass | Composition | Diversity | |
|---|---|---|---|
| U M F | U M F | U M F | |

| - - - | - - - | 2 0 −2 |

| −2 0 2 | −2 0 2 | - - - |

| −2 0 2 | - - - | - - - |

| 0 0 0 | - - - | 0 0 0 |

| 0 0 0 | - - - | 0 0 0 |

| 0 0 0 | 0 0 0 | 0 0 0 |

| −2 0 2 | −2 0 2 | −2 0 2 |

| - - - | - - - | 0 0 0 |

| 0 0 0 | 0 0 0 | 0 0 0 |

| - - - | −2 0 2 | - - - |