

Abstract
Over recent decades, wildfire activity across western North America has increased in concert with summertime air quality degradation in western US urban centers. Using a Lagrangian atmospheric modeling framework to simulate smoke transport for almost 20 years, we quantitatively link decadal scale air quality trends with regional wildfire activity. Modeled smoke concentrations correlate well with observed fine-mode aerosol (PM2.5) concentrations (R > 0.8) at the urban centers most impacted by smoke, supporting attribution of observed trends to wildfire sources. Many western US urban centers (23 of 33 total) exhibit statistically significant trends toward enhanced, wildfire-driven, extreme (98th quantile) air quality episodes during the months of August and September for the years 2003–2020. In the most extreme cases, trends in 98th quantile PM2.5 exceed 2 μg m−3 yr−1, with such large trends clustering in the Pacific Northwest and Northern/Central California. We find that the Pacific Northwest is uniquely impacted by smoke from wildfires in the mountainous Pacific Northwest, California, and British Columbia, leading to especially robust degradation of air quality. Summertime PM2.5 trends in California and the Intermountain West are largely explained by wildfires in mountainous California and the American Rockies, respectively. These results may inform regional scale forest management efforts, and they present significant implications for understanding the wildfire—air quality connection in the context of climate driven trends toward enhanced wildfire activity and subsequent human exposure to degraded air quality.
Export citation and abstract BibTeX RIS

Original content from this work may be used under the terms of the Creative Commons Attribution 4.0 license. Any further distribution of this work must maintain attribution to the author(s) and the title of the work, journal citation and DOI.
1. Introduction
Fine mode aerosol particulate matter (PM2.5: aerodynamic diameter <2.5 microns), for which wildfires are a major source [1, 2], is known to harm human health. Exposure to elevated levels of PM2.5 has been linked to enhanced population level mortality [3, 4], increased risk of cardiovascular disease [5], and increased emergency room visits for respiratory illness [6–9]. Given this connection to human health, PM2.5 is regarded as a 'criteria pollutant' by the United States Environmental Protection Agency (EPA) and is regulated under the Clean Air Act. Acceptable levels of PM2.5 are set by the National Ambient Air Quality Standards (NAAQS), which currently requires three-year averages of the annual mean and 98th percentile of PM2.5 concentrations to be less than 12 and 35 μg m−3, respectively. Further, some studies suggest that wildfire-emitted PM2.5 may be more toxic than PM2.5 from other sources, e.g. dust, thus posing a greater human health risk [7, 10], and underscoring the need to quantify the wildfire-air quality relationship.
Over the years 2000–2020, the average PM2.5 concentration measured at EPA monitoring sites across the United States decreased by 41% [11]. However, over this period, the Northwest region (Washington, Oregon, and Idaho) experienced an increase in average PM2.5 of 6% [11]. Trend analyses at monthly/seasonal time-scales suggest that the degradation of air quality in the Northwest is driven by changes in PM2.5 during the month of August, and that this trend is likely related to wildfire-emitted PM2.5 [12, 13]. At the 98th percentile, trend analyses indicate increasingly extreme PM2.5 loading across the western US [14], with the greatest air quality degradation occurring in the Pacific Northwest and Northern California during the month of August [12]. It has been hypothesized that the Pacific Northwest is subject to such robust air quality degradation due to its close proximity to British Columbia and the mountainous Pacific Northwest/California, both of which having undergone a steep increase in wildfire emissions [12]. However, prior analyses lack the atmospheric transport modeling necessary to quantify the impact of smoke source regions on near-surface PM2.5 concentrations within population centers in order to confirm or reject this hypothesis.
Wildfire activity throughout the western US has become increasingly intense over recent decades, with many mountainous ecoregions characterized by increases in extreme fire weather [15], burned area [16–18], wildfire emissions [12], burn severity [16], and taller wildfire plumes [19]. Efforts aimed at attribution of such trends largely point toward climate change as a major factor, with statistical analyses highlighting connections to increasing temperatures and atmospheric aridity [15, 16, 20–22], decreasing summertime precipitation [23], and reduced snowpack [24, 25]. Modeling focused on the climate change—wildfire—air quality connection suggests that these trends will persist into the future [26, 27], with associated health outcomes including millions of additional human exposures to wildfire degraded air quality [28] and an increase in deaths related to wildfire PM2.5 [26]. Given the legacy of fire suppression, the impacts of climate change on western US wildfire activity will be exacerbated, therefore amplifying the risk of air quality degradation due to large wildfires [29].
While observation-based analyses strongly suggest that wildfires are driving recent western US aerosol trends [12–14, 30, 31], their inability to directly link smoke sources to air quality measurements has hampered quantitative attribution. Similarly, prior modeling has emphasized understanding of smoke transport pathways but did not quantify the magnitude of air quality degradation stemming from these pathways [32]. Based on forward trajectory modeling, it is known that air quality in the Northwestern US, Southwestern US (including California) and Rocky Mountains tends to be impacted by smoke from wildfires within the Northwestern and Southwestern US, Southwestern US, and all three sub-regions, respectively, but it is unclear the degree to which these connections influence air quality trends within population centers [32]. To effectively attribute western US aerosol trends to wildfire sources, a model framework that quantifies near-surface PM2.5 concentrations based on wildfire emissions and atmospheric transport of smoke is needed. Further, a refined understanding of western US smoke sources, atmospheric transport pathways, and the subsequent human exposure to degraded air quality may provide guidance for targeted thinning, prescribed burns, and related forest management practices given the context of growing wildfire containment costs [33]. Here we apply a time-inverted Lagrangian particle dispersion model to simulate the transport of wildfire-emitted PM2.5 in the atmosphere in order to (a) perform a quantitative attribution of western US air quality trends to wildfire sources after accounting for atmospheric transport, and (b) elucidate smoke source regions that are particularly relevant to human exposure to degraded air quality in western US urban centers.
2. Methods
We use the Stochastic Time-Inverted Lagrangian Transport model (STILT) [34–36] coupled to the Weather Research and Forecasting model (WRF) [37] to estimate the daily averaged wildfire emitted primary PM2.5 arriving at western US urban centers and to identify source-receptor linkages between individual fires and air quality in urban centers. To account for the wildfire plume rise and deposition of aerosol during atmospheric transport, the WRF-STILT framework is augmented by a smoke module that rescales the influence of upwind wildfires in accordance with the wildfire plume top height, climatological estimates of the distribution of emission below plume top height, and the degree of atmospheric deposition of aerosol between the source fire and receptor (urban center).
Time series of the daily averaged wildfire derived PM2.5 sourced from all upwind wildfires as well as from fires in individual ecoregions/ecoprovinces [38, 39] were modeled for each urban center (33 in total) for the months of August and September of 2003–2020. Urban centers were selected based on the city clustering of Wilmot et al [12], in which they identified near continuous clusters of relatively high population density (>1,000 km−2) and total population (>200,000). Daily averaged PM2.5 time series were then aggregated to monthly averaged values and subject to 98th quantile regression [40, 41] to understand the role of wildfires in western US aerosol trends and to identify particularly relevant smoke source regions. Model simulations were evaluated with EPA measurements of PM2.5 [42]. Selection of STILT model receptor locations and EPA observation sites is discussed in greater detail in supplemental information (SI) section S1.
2.1. Data
The spatial information, temporal information, and usage of datasets included in this study are presented in table 1.
Table 1. A description of the data products used. The spatial and temporal information reflects the regions and years used in this study. All datasets subset to West of −100°E longitude. Geographic acronyms: continental United States (CONUS), Canada (CAN).
| Product Name | Spatial Info | Temporal Info | Usage |
|---|---|---|---|
| QFED PM2.5 emissions [43] | 0.1°, CONUS/CAN | Daily, 2003–2020 | Convolution with STILT output |
| GFED 4.1s diurnal cycle of active fires [44, 45] | 0.25°, CONUS/CAN | Every 3 h, 2003–2020 | Temporal downscaling of PM2.5 emissions |
| Plume rise climatology [19] | CONUS/CAN | Hourly, 2003–2020 | Plume rise inputs to STILT |
| WRF meteorology [19] | 12 km/4 km, western North America | Hourly, 2003–2020 | Meteorological inputs to STILT |
| EPA PM2.5 mass (24 h) | 33 sites, CONUS | Daily average, 2003–2020 >10 observations/month | Model evaluation, observed trends |
2.2. Models
2.2.1. STILT
STILT is a receptor-oriented Lagrangian particle dispersion model developed for time-reversed simulations that produce back trajectories for an ensemble of fictitious air parcels arriving at the receptor (site of observation in urban centers; see SI section S1). Production of back trajectories is performed through combination of time reversed mean wind fields and a stochastic turbulence parameterization represented as a Markov chain process [34]. From air parcel backward trajectories, STILT generates a gridded surface flux footprint that quantifies the influence of upwind grid cells on the receptor at a particular time (e.g. figure 1) [34]. When convolved with wildfire PM2.5 emissions estimates, the STILT footprint generates a 4-dimensional, quantitative description of the PM2.5 contributions from upwind source fires to the urban center receptor (e.g. figure 1). Further details regarding STILT are provided in SI section S2.

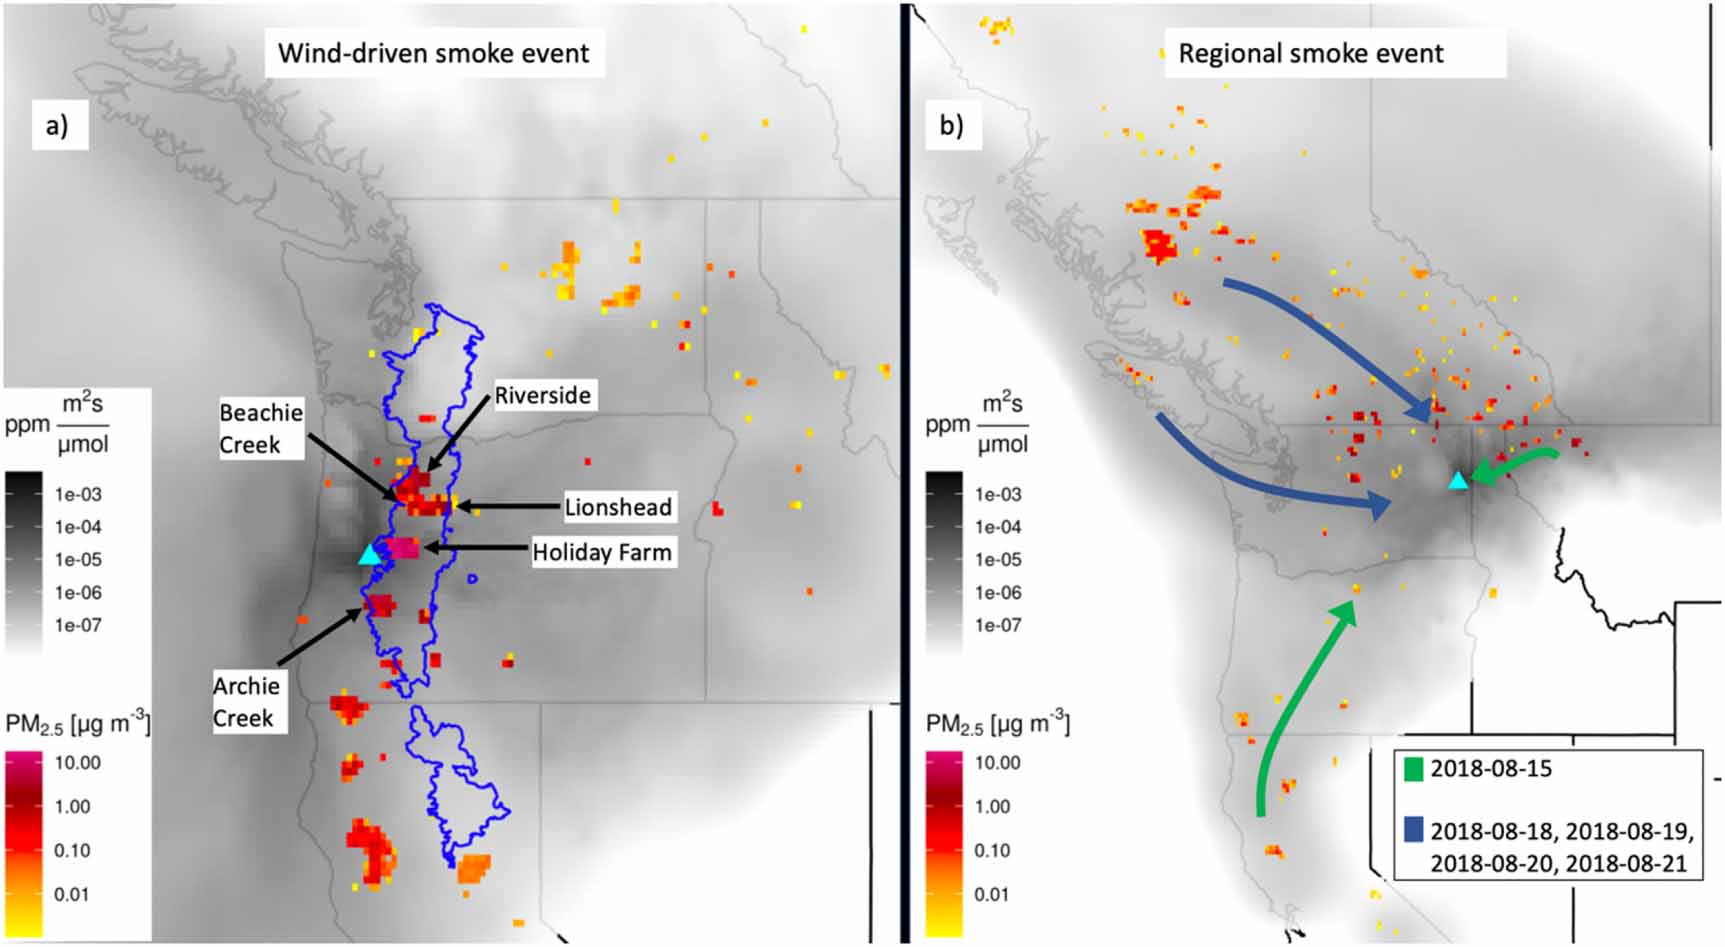
Figure 1. (a) Gridded average model results for Eugene, Oregon during the peak of air quality impacts from the 2020 labor day fires (average observed PM2.5 >250 μg m−3; 2020-09-07–2020-09-17). Average WRF-STILT-smoke module footprint values are represented by the grayscale color bar. Average PM2.5 contributions to Eugene from wildfire activity within individual grid cells (0.1 degree) are represented by the red-yellow color bar. The Cascades ecoregion is outlined in blue. The five largest individual wildfires (each >125,000 acres) that contributed to this event are labelled. (b) Same as panel (a), but representing the average model results for Spokane, Washington when it exceeded the EPA PM2.5 threshold for 'unhealthy' air quality (>55.5 μg m−3) during August of 2018 (2018-08-15 and 2018-08-18–2018-08-21). Green and blue arrows represent the dominant atmospheric transport pathways for regional wildfire smoke on 2018-08-15 and 2018-08-18–2018-08-21, respectively.
Download figure:
Standard image High-resolution imageIn this work, STILT ingests mean wind fields from WRF simulations (see SI section S2). At 3 h intervals throughout August and September of 2003–2020, we simulate 1200 back trajectories (see sensitivity tests in SI section S3) for each of the 33 western US urban centers considered. Trajectories were run 120 h back in time, as this should capture the majority of transport over the western US and Canada [32] before exiting over the Pacific Ocean. Wildfire PM2.5 emission estimates used for convolution with STILT output were obtained from the Quick Fire Emissions Dataset (QFED) [43] and were downscaled to 3 h emissions profiles on the basis of monthly aggregated satellite active fire detections sourced from the Global Fire Emissions Database (GFED; see SI section S2) [44, 45]. Modeling was limited to the months of August and September due to the computational/storage expense of producing regional-decadal scale WRF simulations. The years 2003–2020 were selected for consistency in the underlying input datasets. A limited number of STILT simulations, 120 out of 289,872, have been excluded from trend analyses as a result of model performance. A brief explanation of these excluded simulations may be found in SI section S2.
2.2.2. STILT smoke module
To account for processes relevant to wildfire emissions of PM2.5 within the STILT framework, a series of codes designed to treat wildfire plume rise and dry/wet deposition of aerosol during atmospheric transport were added to the STILT work flow. This approach largely follows the framework outlined by Mallia et al [46], but features updates in the form of an improved representation of the wildfire plume rise [19, 47], inclusion of compounding aerosol deposition during atmospheric transport, and simplified implementation within the STILT framework due to updates by Fasoli et al [35]. Formation of secondary organic aerosol during atmospheric transport was not included within this modeling framework, as large uncertainties pertaining to this mechanism remain and the literature suggests minor net changes to aerosol mass over time [48].
The effects of wildfire plume rise were included within the model framework by altering the position of the STILT influence volume, the volume through which emissions are diluted, and allowing an uneven vertical distribution of emission therein. We construct a framework for STILT to ingest model-derived wildfire plume top heights [19, 49] and subsequently rescale the depth of the influence volume (see SI section S2). Dry/wet deposition of PM2.5 was accounted for following the approach implemented within WRF-STILT by Mallia et al [46], in which dry deposition is based on the scheme developed by Zhang et al [50] and wet deposition is an adaptation of the GEOS-Chem wet deposition scheme (see SI section S2).
2.3. Trend analyses
Trend analyses of the observed PM2.5 at urban centers possessing adequate observations and wildfire derived PM2.5 (modeled) arriving at each of the 33 urban centers were performed using 98th quantile regression. Quantile regression is effectively a linear fit to the data that incorporates an asymmetric weighting for the least-squares minimization [40, 41], such that the fit may preferentially weight extreme data points (as is the case at the 98th quantile).
Daily averaged PM2.5 observations at EPA observation sites (corresponding to model receptor sites) were aggregated to monthly (August and September) averaged values for the years 2003–2020. Sites containing >10 daily averaged PM2.5 observations per month for >15 years over the span 2003–2020 were considered for trend analyses. Similarly, model outputs were aggregated to monthly average values for each of the 33 urban centers considered. Observed and modeled time series for the months of August and September were then subjected to quantile regression. Statistical significance was determined via a bootstrapping procedure that resampled each time series 100,000 times, with replacement, and performed 98th quantile regression to see if the actual regression was distinguishable from the scatter of the resampled regressions at p < 0.05.
Identification of particularly relevant smoke source regions was similarly performed using 98th quantile regression, but in this case time series were constructed to reflect the PM2.5 mass contributed to a particular urban center from fires in a specific ecoregion/ecoprovince. Ecoregions/ecoprovinces, sourced from the US EPA and Government of Canada [38, 39], define areas of similar ecosystem composition (climate, vegetation, hydrology, etc.), such that they may adhere to a similar fire regime. In the context of this analysis, the use of ecoregions/ecoprovinces is intended to allow spatial aggregation for the benefit of statistical relationships while maintaining the possibility of ecosystem scale factors influencing wildfire activity and subsequent air quality. Construction of time series specific to a particular ecoregion/ecoprovince was performed by spatially subsetting STILT-simulated PM2.5 contributions to individual ecoregions/ecoprovinces during convolution of wildfire emissions and STILT model output. Subsetting was performed specifically for US level 3 ecoregions and Canadian ecoprovinces (figure 2(a)) because they provided a reasonable balance between spatial resolution, illuminating informative transport pathways and smoke source regions, and valuable statistical relationships. At finer spatial resolutions (e.g. US level 4 ecoregions) many of the ecoregions are spatially discontinuous, and thus often lack additional information about atmospheric transport while simultaneously yielding less robust statistics given increased inter annual variability in wildfire activity.
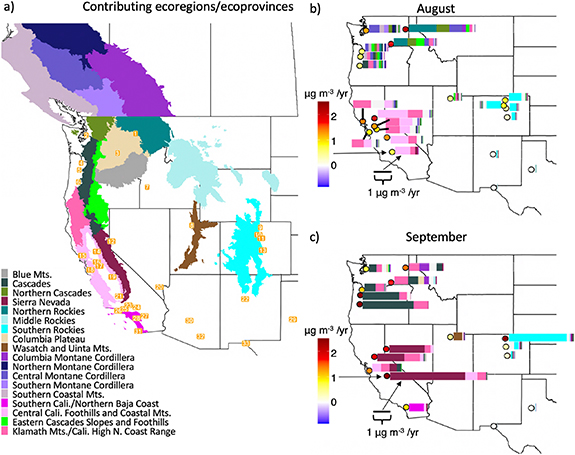
Figure 2. (a) A map of the US level 3 ecoregions and Canadian ecoprovinces that produce significant wildfire derived PM2.5 contribution trends at western US urban centers. Urban centers are labelled 1–33 as follows: (1) Spokane, WA; (2) Seattle, WA; (3) Kennewick, WA; (4) Portland, OR; (5) Salem, OR; (6) Eugene, OR; (7) Boise, ID; (8) Salt Lake City, UT; (9) Fort Collins, CO; (10) Boulder, CO; (11) Denver, CO; (12) Reno, NV; (13) Colorado Springs, CO; (14) Sacramento, CA; (15) Santa Rosa, CA; (16) Stockton, CA; (17) Modesto, CA; (18) San Jose, CA; (19) Fresno, CA; (20) Las Vegas, NV; (21) Bakersfield, CA; (22) Albuquerque, NM; (23) Lancaster, CA; (24) Victorville, CA; (25) Santa Clarita, CA; (26) Somis, CA, (27) Palm Springs, CA; (28) Lake Elsinore, CA; (29) Lubbock, TX; (30) Phoenix, AZ; (31) San Diego, CA; (32) Tucson, AZ; (33) El Paso, TX. (b) Results of 98th quantile trend analyses for the wildfire derived PM2.5 arriving at western US urban centers (only p < 0.05 shown) during the month of August (circles; follows color bar). Horizontal bars reflect the contributions to urban center trends from individual ecoregions and ecoprovinces (only p < 0.1 included; follows distance scale). (c) Same as (b) but for September.
Download figure:
Standard image High-resolution image2.4. Model evaluation against EPA PM2.5
Evaluation of model outputs against EPA observed PM2.5 was performed on the basis of individual sites (urban center receptors) and sub-regions of the western US (Pacific Northwest, Northern/Central California, Intermountain West, Southwest). With the intent of testing the capacity of this modeling framework to capture observed PM2.5 time series, we used the statistical analysis software R [51] to calculate the correlation between modeled and observed PM2.5. It was required that sites have greater than 5 years of monthly averaged data, requiring >10 daily observations per month, and that the most recent year be at least as recent as 2017. A cutoff of 2017 was selected to ensure that presented correlations reflect periods relevant to our trend analyses given that many western US ecoregions present a possible acceleration in PM2.5 emissions trends since 2017/2018 [19]. Of the 33 urban centers considered, 17 met these criteria, with average, minimum, and maximum duration of monthly average data being 14.7, 5, and 18 years, respectively. Given the lack of non-wildfire PM2.5 sources in the model, it should be recognized that even if the model perfectly captured fluctuations in wildfire derived PM2.5, the presented correlations to the observations would be less than unity.
3. Results and discussion
3.1. Wildfire derived PM2.5 trends in western US urban centers
We find that urban centers across the western US present positive and statistically significant (p < 0.05) 98th quantile trends in wildfire-emitted PM2.5 for the months of August and September over the years 2003–2020 (figure 2). In accordance with the empirical, observation-driven findings of Wilmot et al [12], wildfires exert a significant impact on air quality at a larger number of urban centers in August than September, and the Pacific Northwest and Northern/Central California demonstrate the most robust trends in wildfire PM2.5 degraded air quality. At many urban centers throughout the Pacific Northwest and Northern/Central California, modeled trends exceed 1 μg m−3 yr−1. For context, the median observed summertime PM2.5 over the years 2003–2020 ranges from ∼4 μg m−3 (Portland, OR) to ∼12 μg m−3 (Bakersfield, CA) for the 33 urban centers considered. In the most extreme cases, modeled trends exceed 2 μg m−3 yr−1, with such results preferentially occurring during September. These extraordinary September trends are largely tied to 2020 values that exceed 45 μg m−3, with the available observations suggesting model overestimation by a factor of ∼2 at Fresno, California, and model underestimation by a factor of ∼2 at Salem, Oregon. While further investigation is needed, the shift toward wind-driven fire activity from summer to fall offers a possible explanation for the large September trends modeled at sites in Oregon and California [22, 52]. Trends toward increasing temperatures and atmospheric aridity enhance the probability of coincident dry fuels and strong winds, allowing for extreme rates of fire spread that may have severe impacts on air quality [22, 52]. Attribution to wildfires at the ecoregion scale indicates that September 2020 PM2.5 values for Fresno (California), Fort Collins (Colorado), Salem and Eugene (Oregon) are driven by nearby wildfires in the Sierra Nevada, Southern Rockies, and Cascades ecoregions, respectively. Further, for Eugene and Salem, 2020 PM2.5 values can be attributed directly to the Labor Day fires (figure 1(a)), which burned an estimated 11% of the Oregon Cascades following a downslope wind event that drove rapid fire spread [53].
Trend analyses of time series spanning 2003–2019 indicate that the extreme fire activity of summer 2020 substantially influenced the 98th quantile PM2.5 trends reported at sites along the Colorado Front Range during August, within the Pacific Northwest during September, and within portions of California during both August and September. For urban centers along the Colorado Front Range, August trends spanning 2003–2019 are statistically significant, but are, on average, 49% smaller than the corresponding 2003–2020 trends. At urban centers within the Pacific Northwest (excluding Spokane, WA), September trends spanning 2003–2019 are only significant at p < 0.1, and they are, on average, 53% smaller than the corresponding trends for 2003–2020. Within California, trends spanning 2003–2019 at Bakersfield, Sacramento, and Santa Rosa during August and Fresno, Sacramento, Lake Elsinore, and San Jose during September, are 41% (p = 0.27), 27% (p < 0.05), 12% (p < 0.05), 69% (p < 0.05), 29% (p < 0.1), 55% (p = 0.25), and 87% (p = 0.43) smaller than the corresponding 2003–2020 trends, respectively. These findings highlight the sensitivity of identified trends to the years considered, while also drawing a possible connection to the hypothesized acceleration of trends in western US wildfire emissions and plume top heights over recent years [19].
Extrapolation of these trend analyses into the future supports the notion that many western US urban centers may soon face severe summertime air quality degradation. Though wildfire events are deemed 'exceptional events' and are thus not considered with regards to NAAQS compliance, the 35 μg m−3 limitation imposed by the EPA on 98th quantile PM2.5 provides concerning context for the trends modeled here. While extrapolation of short-term trends into the future has significant uncertainties, evidence for climate driven trends toward enhanced wildfire activity in relevant source regions [15, 16, 22] suggests that such an extrapolation may be reasonable. Further, modeling based on population, climate, and vegetation trends suggests an expectation that late 21st century western North American burned area and wildfire emissions will exceed a 1990–2010 baseline by 50%–120% and 110%–250%, respectively, under a moderate emissions mitigation scenario (Shared Socioeconomic Pathway 2–4.5) [54]. In terms of PM2.5 pollution, model estimates suggest that the moderate emissions mitigation scenario will translate to August-September 95th quantile PM2.5 values ranging from 85 to 125 μg m−3 at sites throughout the Pacific Northwest [54].
Comparison of modeled and observed 98th quantile trends demonstrates that modeling reasonably reproduces the observational record, particularly in August, and allows for varying levels of attribution of observed western US air quality degradation to wildfire sources (table 2). Eugene, Oregon demonstrates particularly strong alignment between modeled and observed trends during the month of August, with values of 0.549 μg m−3 yr−1 and 0.547 μg m−3 yr−1, respectively. The generally strong agreement between observed and modeled trends points towards the utility of this modeling framework and supports interpretation of modeled trends for urban centers. Beyond model errors and uncertainty, it is possible that disagreement between observed and modeled trends stems from uncertainty in wildfire emissions estimates [55] and/or a decreasing trend in anthropogenically emitted PM2.5 superimposed upon the increasing trend in wildfire derived PM2.5 [11, 14].
Table 2. A comparison of observed and modeled PM2.5 trends for urban centers possessing adequate observations to calculate an observational trend. Only results corresponding to observational trends with p < 0.1 are shown.
| City | Month | Observed trend (μg m−3 yr−1) | Observed p-value | Modeled trend (μg m−3 yr−1) | Modeled p-value |
|---|---|---|---|---|---|
| Bakersfield, CA | August | 1.12 | 0.007 | 0.70 | 0.037 |
| Boulder, CO | August | 0.40 | 0.027 | 0.81 | 0.021 |
| Reno, NV | August | 1.79 | 0.077 | 3.22 | 0.068 |
| Eugene, OR | August | 0.55 | 0.005 | 0.55 | 0.007 |
| Portland, OR | August | 0.61 | 0.008 | 0.65 | 0.0003 |
| Salem, OR | August | 0.60 | 0.003 | 0.61 | 0.0002 |
| Salt Lake City, UT | August | 0.46 | 0.028 | 0.52 | 0.039 |
| Kennewick, WA | August | 1.15 | 0.024 | 1.89 | 0.018 |
| Seattle, WA | August | 1.00 | 0.037 | 1.23 | 0.006 |
| Spokane, WA | August | 2.30 | 0.002 | 2.13 | 0.003 |
| Boulder, CO | September | 0.58 | 0.098 | −0.92 | 0.485 |
| Denver, CO | September | 0.33 | 0.060 | 0.35 | 0.0001 |
| Spokane, WA | September | 3.74 | 0.015 | 1.42 | 0.039 |
3.2. Major smoke source regions
Trend analyses of the wildfire derived PM2.5 contributions from specific ecoregions/ecoprovinces to western US urban centers indicates regionally varying smoke source regions (figure 2). Overall, the Pacific Northwest is impacted by smoke from numerous source regions throughout the western US and Canada, while urban centers in California and along the Colorado Front Range primarily see influences from wildfires in California and the Southern Rockies, respectively. Urban centers along the Wasatch Front of Utah, in Southern California, and in western Texas are characterized by contributions of varying magnitude from the Wasatch-Uinta mountains, Southern California/Northern Baja Coast, and Southern Rockies ecoregions, respectively. These findings largely follow the relatively coarse atmospheric transport pathways identified by Brey et al [32], though we identify transport pathways at a refined spatial resolution and find a proportionally greater contribution of smoke from wildfires in the Rocky Mountains (as defined by Brey et al [32]) to air quality in Colorado and along the Wasatch Front. This increased relevance of the Rocky Mountains to air quality along the Colorado Front Range may be due, in part, to intense 2020 wildfire activity in the nearby Southern Rockies ecoregion. Time series of PM2.5 arriving at urban centers along the Colorado Front Range as contributed from all wildfires and from wildfires within the Southern Rockies present a greater correlation when 2020 data is included as compared to analyses limited to 2003-2019 (SI figure S1). Dominance of the Southern Rockies in terms of wildfire-emitted PM2.5 contributions to the Colorado Front Range further agrees with prior work relating the time averaged 700 hPa flow to correlations between aridity/fire area burned in the Southern Rockies and organic aerosol loading at sites to the east of the Southern Rockies [30].
During August, urban centers in the Pacific Northwest are uniquely subject to smoke from Canadian wildfires, and experience further contributions from the mountainous Pacific Northwest and California, a result that aligns with the observational findings and hypotheses of Wilmot et al [12]. The range of smoke source regions contributing to aerosol loading at urban centers in the Pacific Northwest reflects the unique challenge to air quality that results from the Pacific Northwest's proximity to wildfires in Canada, Washington, Idaho, Oregon, and California (e.g. figure 1(b)). In extreme cases, urban centers in the Pacific Northwest may experience unhealthy levels of PM2.5 pollution regardless of wind direction as a result of being surrounded by wildfires that are regionally relevant smoke sources (figure 1(b)). The presence of general north-south gradients in PM2.5 contributions from wildfires in British Columbia and California to urban centers in the Pacific Northwest indicates the utility of urban center—smoke source proximity as a first estimate of the relevance of that smoke source to local air quality. Similar gradients are seen for California urban centers in terms of August PM2.5 contributions from the Klamath Mountains/California High North Coast Range and the Central California Foothills and Coastal Mountains ecoregions. Given the known connections between the Klamath Mountains region and western US wildfire activity/air quality [12, 13, 22], it is of note that this is the sole ecoregion that presents a statistically significant (p < 0.05) impact on August PM2.5 loading at each of the 33 western US urban centers considered.
While regional contribution patterns are largely consistent from August to September, we find a distinct shift of the dominant contributing ecoregions. Most notably, September features the emergence of the Cascades, Sierra Nevada, and Wasatch-Uinta Mountains ecoregions as the dominant PM2.5 contributors to urban centers in the Pacific Northwest, California, and along the Wasatch Front, respectively. Relative to August, September presents comparatively large contribution trends from individual ecoregions. As indicated previously, these extraordinary September trends are largely the result of unprecedented wildfire activity in September of 2020, and we hypothesize a possible connection to wind-driven fire activity during the fall for sites in Oregon and California. The diminished importance of emissions from Canadian wildfires during September is in agreement with earlier findings [12].
3.3. Evaluation of modeled PM2.5 against EPA observations
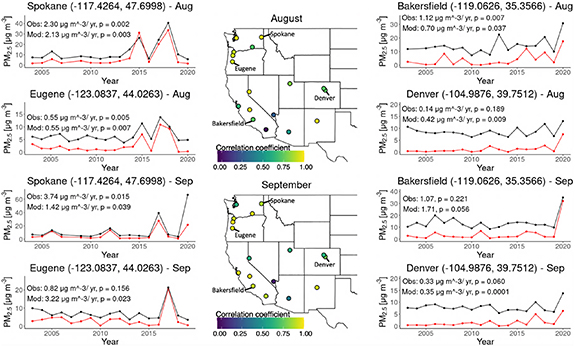
In terms of monthly aggregated PM2.5 values, the modeling framework evaluates well against EPA observed PM2.5. For sites with an adequate number of observations for evaluation, results indicate strong correlation coefficients between modeled and observed PM2.5 (figure 3). At the level of individual sites, maximum and minimum values in the correlation coefficient of 0.99 and −0.04 are found at Salem, Oregon in September and Palm Springs, California in August, respectively. Given that this framework neglects PM2.5 from non-wildfire sources, we would expect a well-constructed model to present stronger correlations to observations in regions and months with greater wildfire contributions to PM2.5. When comparisons are averaged by region, we find that the model presents stronger observation-model correlation coefficients in the Pacific Northwest and California, while demonstrating weaker correlations in the Southwest (table 3). Correlations between modeled and observed PM2.5 were stronger in August relative to September. These results are in line with the expectation of enhanced correlations where wildfires play a greater role in PM2.5.
Figure 3. Correlations between modeled and observed PM2.5 for the months of August and September at urban centers possessing adequate observational data to make a comparison. Time series of the modeled (red) and observed (black) PM2.5 at Spokane (Washington), Eugene (Oregon), Bakersfield (California), and Denver (Colorado) are also presented, with the corresponding 98th quantile trends listed within each subplot. As our model neglects non-fire PM2.5 sources, non-unity correlations and a pronounced offset during periods free of wildfire influences are expected.
Download figure:
Standard image High-resolution image
Table 3. Average correlations between modeled and observed PM2.5 by western US sub-region. Supplemental figure S3 depicts the urban centers grouped into each sub-region.
| Region | Mean August correlations | SD of August correlations | Mean September correlations | SD September correlations |
|---|---|---|---|---|
| Pacific Northwest (6 sites) | 0.894 | 0.091 | 0.865 | 0.150 |
| North/Central CA and Reno, NV (4 sites) | 0.829 | 0.162 | 0.855 | 0.179 |
| Intermountain West (3 sites) | 0.760 | 0.038 | 0.670 | 0.103 |
| Southwest (4 sites) | 0.427 | 0.422 | 0.557 | 0.433 |
In looking at figure 3, it is clear that the model framework consistently underestimates observed PM2.5 values. However, as this model framework neglects PM2.5 from non-fire sources, a consistent low-bias is to be expected. For a well-constructed model, it would be expected that this low-bias reflects background, non-smoke impacted, PM2.5 values within the urban centers considered. Comparison of median observation-model differences to median observed August and September PM2.5 values at the regional scale largely supports the notion that background, non-smoke, PM2.5 explains the consistent observation-model discrepancy (table 4). The similar magnitude of median PM2.5 observations and observation-model differences, as well as their regional variability, suggests that PM2.5 from non-fire sources comprises much of the observation-model differences.
Table 4. Median observation-model differences (observed value minus modeled value; μg m−3) and median observed PM2.5 values (μg m−3) for the months of August and September by western US sub-region. Supplemental figure S3 depicts the urban centers grouped into each sub-region.
| Region | Observations-model (August) | Observed PM2.5 (August) | Observations-model (September) | Observed PM2.5 (September) |
|---|---|---|---|---|
| Pacific Northwest (6 sites) | −3.6 | 5.9 | −4.3 | 5.1 |
| North/Central CA and Reno, NV (4 sites) | −6.1 | 9.9 | −7.7 | 10.1 |
| Intermountain West (3 sites) | −5.7 | 6.8 | −6.1 | 6.7 |
| Southwest (4 sites) | −6.1 | 6.5 | −6.4 | 6.7 |
Further, linear fit trend analyses for the observation-model differences suggest only minor implications for the modeled 98th quantile trend analyses reported here. Negative trends, indicating a decrease in the observation-model discrepancy over time were found at Seattle during August (−0.23 μg m−3 yr−1; p < 0.05) and September (−0.24 μg m−3 yr−1; p < 0.05), Denver during August (−0.12 μg m−3 yr−1; p < 0.05) and September (−0.14 μg m−3 yr−1; p < 0.05), Palm Springs during August (−0.32 μg m−3 yr−1; p < 0.05), Salt Lake City during September (−0.15 μg m−3 yr−1; p < 0.1), and Bakersfield during September (−0.29 μg m−3 yr−1; p < 0.05). While these negative trends suggest the possibility of somewhat inflated modeled PM2.5 trends at these urban centers, in particular at Denver in August, and at Seattle, Salt Lake City, and Denver in September, we note that this observation-model convergence may alternatively be the result of trends toward decreasing anthropogenic emissions of PM2.5 [14].
4. Conclusions
Summertime PM2.5 trends across the western US can largely be attributed to wildfires when using a modeling framework that links smoke source regions with urban centers. This attribution is well supported by similar spatial and temporal patterns in trend analyses of observed and modeled PM2.5, as well as strong observation-model correlations in regions known to be heavily impacted by wildfire smoke. We find the most robust simulated trends toward wildfire degraded air quality in the Pacific Northwest and Northern/Central California (figure 2). These trends align with observational analyses carried out in previous work [12, 13]. Similar to observationally-derived air quality trends [12], simulated wildfire-contributed PM2.5 trends demonstrate a greater prevalence of statistically significant increases in extreme aerosol loading within western US urban centers during the month of August relative to September (figure 2). For many western US urban centers, the correlation strength between modeled and observed PM2.5 time series exceeds 0.8, supporting attribution of observed trends to wildfire sources and bolstering confidence in the model framework (figure 3). Given that the model framework used here neglects non-fire PM2.5 sources, stronger correlations in heavily smoke impacted regions like the Pacific Northwest relative to less impacted regions like the Southwest provides additional confidence in the model framework (table 3).
Attribution of observed 98th quantile PM2.5 trends to wildfires in specific source regions further supports the role of wildfires in western US air quality trends and highlights both critical smoke transport pathways and source regions. Broadly, modeling results indicate that summertime air quality degradation in urban centers in California, along the Colorado Front Range, and in the Pacific Northwest is due to wildfire activity in California, the Southern Rockies, and ecoregions throughout British Columbia and the mountainous Pacific Northwest/California, respectively (figure 2). This result is in general agreement with the forward trajectory modeling of Brey et al [32], though this analysis provides a spatially refined understanding. Specifically, we find major PM2.5 contributions to western US urban centers from the Central Montane Cordillera, Northern Rockies, Southern Rockies, Cascades, Klamath Mountains, Sierra Nevada, and Central California Foothills/Coastal Mountains ecoregions, highlighting the relevance of these areas to human exposure to degraded air quality. This result is in accordance with observationally hypothesized wildfire emissions hotspots that significantly impact air quality in western US urban centers [12]. Notably, the unique position of urban centers in the Pacific Northwest, surrounded by regionally relevant smoke sources, explains the robust air quality degradation in this region.
Broadly, the model framework deployed here provides for improved understanding of regional-decadal scale atmospheric smoke transport pathways that are relevant to human exposure to degraded air quality by (a) refining the spatial resolution of source regions, (b) quantifying the degree of air quality degradation (PM2.5 concentrations vs. smoke hours [32]), (c) incorporating additional physical mechanisms that are relevant to regional scale smoke transport (plume rise and aerosol deposition), and (d) emphasizing near-surface smoke concentrations.
While many ecoregions span a large area, these results may present value in terms of informing targeted forest management practices. Should forest management resources be directed with the implications for human exposure to degraded air quality in mind, the aforementioned ecoregions would be optimal targets for thinning efforts, prescribed burning, and related fuel treatments. Additionally, further analyses regarding the relationship of air quality trends to wildfires within specific vegetation types and altitude ranges, as well as the role of different ignition types, may compliment the work presented here in terms of further focusing forest management on specific locations.
Caveats to this work include the exclusion of atmosphere—fire feedbacks, smoke particle size distributions, and in plume aerosol chemistry within the atmospheric modelling framework. Given the computational expenses of including fire—atmosphere feedbacks and treating aerosol deposition for a complete size distribution, inclusion of these mechanisms for a regional-decadal scale analysis was not feasible. Regarding in plume aerosol chemistry, these mechanisms were similarly considered computationally unfeasible for a multi-decadal simulation, while the inclusion of a simplified secondary organic aerosol mechanism was neglected on the grounds of large current uncertainty [48]. Available evidence suggests only minor net change in aerosol mass during atmospheric transport as a result of secondary organic aerosol processes [48]. In addition, we note the large discrepancies between wildfire emissions inventories [55], and consider their refinement to be a powerful means of improving wildfire—air quality modeling. Within the continental US, annual wildfire emissions estimates have been shown to vary by as much as a factor of ∼7, with QFED consistently reporting the largest values, when a range of wildfire emissions inventories is considered [56].
While this study has advanced understanding of the connection between observed trends in wildfire activity and western US air quality by quantitatively accounting for the role of atmospheric transport, further understanding may be provided by: (a) accounting for fire—atmosphere feedbacks in the modeling framework, (b) quantifying wildfire—air quality relationships and trends in the context of different vegetation types, (c) attempting to link wildfire emissions and trends to ignition types when possible, (d) identifying strong smoke sources at a range of spatial scales relevant to different forest management practices, and (e) considering strong smoke source regions in the context of the wildfire—climate change connection and regional climate projections.
Acknowledgments
The authors are grateful to the University of Utah's Center for High Performance Computing and the iNterdisciplinary EXchange for Utah Science for computational resources and financial support, respectively. We are thankful to the NASA Global Modeling and Assimilation office, the Climate Data Guide of the National Center for Atmospheric Research, and the United States Environmental Protection Agency for access to QFED emissions estimates, Climate Forecast System Reanalysis data, and PM2.5 observations, respectively. We are thankful to NASA, the Gordon and Betty Moore Foundation, and The Netherlands Organisation for Scientific Research for funding GFED. We thank Iowa State University and Iowa Environmental Mesonet for access to the rawinsonde data used in this study. Additionally, the authors gratefully acknowledge the NOAA Air Resources Laboratory (ARL) for the provision of gridded archive meteorology.
Data availability statement
The data that support the findings of this study are available upon reasonable request from the authors.
Author contributions
John Lin and Gannet Hallar designed the study. Taylor Wilmot performed the model runs, analyzed model output, and generated the figures with input from Derek Mallia, John Lin, and Gannet Hallar. Derek Mallia was a point of support, instruction, and feedback throughout the modeling process. Taylor Wilmot wrote the manuscript, with edits provided by Gannet Hallar, John Lin, and Derek Mallia.
Conflict of interest
The authors declare no competing interests.
Supplementary data (5.3 MB DOCX)