

Abstract
Tropical rivers are dynamic CO2 sources. Regional patterns in the partial pressure of CO2 (pCO2) and relationships with other a/biotic factors in densely populated and rapidly developing river delta regions of Southeast Asia are still poorly constrained. Over one year, at 21 sites across the river system in the Red River Delta (RRD), Vietnam, we calculated pCO2 levels from temperature, pH, and total alkalinity and inter-linkages between pCO2 and phytoplankton, water chemistry and seasonality were then assessed. The smaller, more urbanized, and polluted Day River had an annual median pCO2 of 5000 ± 3300 µatm and the larger Red River of 2675 ± 2271 µatm. pCO2 was 1.6 and 3.2 times higher during the dry season in the Day and Red rivers respectively than the rainy season. Elevated pCO2 levels in the Day River during the dry season were also 2.4-fold higher than the median value (2811 ± 3577 µatm) of calculated and direct pCO2 measurements in >20 sub/tropical rivers. By further categorizing the river data into Hanoi City vs. other less urban-populated provinces, we found significantly higher nutrients, organic matter content, and riverine cyanobacteria during the dry season in the Day River across Hanoi City. Forward selection also identified riverine cyanobacteria and river discharge as the main predictors explaining pCO2 variation in the RRD. After accounting for the shared effects (14%), river discharge alone significantly explained 12% of the pCO2 variation, cyanobacteria uniquely a further 21%, while 53% of the pCO2 variance was unexplained by either. We show that the urbanization of rivers deltas could result in increased sources of riverine pCO2, water pollution, and harmful cyanobacterial blooms. Such risks could be mitigated through water management to increase water flows in problem areas during the dry season.
Export citation and abstract BibTeX RIS

Original content from this work may be used under the terms of the Creative Commons Attribution 4.0 license. Any further distribution of this work must maintain attribution to the author(s) and the title of the work, journal citation and DOI.
1. Introduction
Large river systems are an integral part of the global carbon (C) cycle, functioning as conduits and biogeochemical reactors of organic matter (OM) [1–4]. They receive large quantities of terrestrial organic C, which often can be degraded and respired elevating the partial pressure of CO2 (pCO2) in waters [4, 5]. An estimated 5.1 Pg C is transported by the world's rivers from the land to the ocean every year [5], of which around 48%–64% is carried by large tropical rivers [6, 7]. Further, CO2 evasion from inland waters to the atmosphere is estimated at 1292 Tg C yr−1, from which rivers alone contribute around half (649 Tg C yr−1) [8]. Of the total global river flux, South American rivers supply 42% (270 Tg C yr1), followed by Asian rivers (25%; 166 Tg C yr−1), African rivers (22%; 138 Tg C yr−1), and non-tropical North American (46.14 Tg C yr1) and European rivers (20.35 Tg C yr1) with 8% and 3% respectively [8].
In tropical rivers, the processes that determine aquatic pCO2 concentrations are complex and depend upon multiple factors operating across variable spatial and temporal scales. Processes include dissolved inorganic C (DIC) contributions from watershed weathering, the balance between catchment and in situ photosynthesis and respiration, river discharge, surface air temperature and precipitation [4, 9]. If DIC contributions are small and/or gross primary production is greater than respiration, rivers could function as CO2 sinks [2]. When DIC concentrations are high and/or respiration exceeds gross primary production, rivers systems could become sources of CO2 to the atmosphere [2], which is the generally observed state. As shown in the Amazon (South America) and Congo (Africa) Rivers, tropical rivers are usually found to be important CO2 sources to the atmosphere [9, 10]. The combination of higher temperature, which increases OM decomposition, and intense rainfall, which enhances OM transfer from catchments, means that pCO2 in tropical rivers is often higher than in temperate counterparts, especially in the rainy season [4, 9].
Concentrations of pCO2 in tropical rivers may also change in response to catchment urbanization which is proceeding rapidly in many regions [11–13], especially in the populous river delta areas of Southeast Asia [14–16]. Urbanization can change river discharge, reduce infiltration, and influence the delivery of OM enriched in nutrients and heterotrophic microorganisms [11–13, 17]. Transforming the river basin and hydrological characteristics may also lead to eutrophication, water quality degradation, hypoxia, and harmful algal blooms (HABs) [11, 17, 18].
The Red River Delta (RRD) in northern Vietnam (figure 1) exemplifies how natural river C cycling dynamics respond to urbanization and population growth. Over the last decade (2010–2020), mean population density across the RRD has risen from 952 inhabitants km−2 in 2011 to 1078 inhabitants km−2 in 2019 (supplementary table S1) [19]. Hanoi City, in the western-central part of the RRD, has supported the greatest rise from 2031 inhabitants km−2 in 2011 to 2410 inhabitants km−2 in 2019 (table S1) [19] and the current ratio of urban/rural population (0.97) is 4.4-fold higher than in other RRD provinces (0.2 ± 0.3; table S2) [19]. The two main delta rivers, the Day, and the lower Red River, which flow through Hanoi City, are characterized by organic-rich waters, circumneutral pH (Day: 6.8 ± 0.2; Red: 7.1 ± 0.3) and moderate-to-high total alkalinity (TA) (>1000 μmol l−1). These rivers differ in length (Day: 240 km; Red: 1126 km) and have been negatively impacted by land use changes, increased loads of concentrated OM and nutrients, and reductions in river water discharge [20, 21]. In Hanoi City, the Day River configuration and hydrology has been particularly modified towards a regulated system of connecting natural and artificial lakes through channels and canals with open gutters, sewers, and ditches for stormwaters and wastewaters [22]. Independent C budgets for these two rivers, indicate that both are supersaturated with CO2 (annual mean pCO2 > 410 µatm) and act as a likely CO2 source to the atmosphere [20, 21, 23, 24]. DIC contributions from rich carbonate–silicate rocks in the upper drainage area of the Red River also contribute to pCO2 [20]. C dynamics of these rivers have however, not been directly compared (i.e. at the delta scale), and linkages between physicochemical stressors, seasonality, and primary producers are poorly understood [25–27]. Linking biotic and abiotic processes will delineate the sequences of biogeochemical processes operating across multiple temporal and spatial scales in heavily impacted tropical rivers [25], enhancing predictive capability and informing evidence-based management guidance.

Figure 1. Map of the Red River Delta in Northern Vietnam, showing the location of the studied 11 sampling stations in the Day River and its tributaries (D) and 10 sampling stations in the Red River (H) and its tributaries. Population density (inhabitants km−2) at each study province are also indicated by a grey scale. Yen Bai (H1); Vu Quang (H2); Hoa Binh (H3); Son Tay (H4); Ha Noi (H5); Gian Khau (H6); Quyet Chien (H7); Nam Dinh (H8); Truc Phuong (H9); Ba Lat (H10); Phung Dam (D1); Mai Linh Bridge (D2); Ba Tha (D3); Te Tieu Bridge (D4); Que Bridge (D5); Do Bridge (D6); Doan Vy Bridge (D7); Non Nuoc Bridge (D8); Do Thong (D9); Do Muoi (D10); Nhu Tan (D11).
Download figure:
Standard image High-resolution imageWe present combined estimates of riverine pCO2 dynamics across the RRD and examine its interlinkages with degree of urbanization (population density), primary producers (phytoplankton), water quality, hydrology, and seasonality across 21 river sampling stations over a one-year period (figure 1). Comparisons with >20 tropical and subtropical rivers allow global contextualization of our findings.
2. Material and methods
2.1. Water sample collection and analysis
River waters were sampled and analyzed monthly at 10 stations along the Red River and 11 along the Day River (figure 1; see supplementary site description). Physical and chemical parameters including temperature, pH, TA, turbidity, dissolved oxygen (DO), conductivity, total dissolved nitrogen (TDN), total dissolved phosphorus (TDP), nitrate (NO3–N), nitrites (NO2–N) and ammonium (NH4–N) were collected and analyzed monthly at each station across the dry (November–April) and rainy (May–October) seasons of 2018–2019. Daily river discharge (m3 s−1) was obtained from eight hydrological stations in the Red River corresponding to sampling points H1, H3, H4, H5, H7, H9, H10 and five stations in the Day River corresponding to sampling sites D3, D6, H6, D8, D10, provided by the Vietnam Center of Hydro-Meteorological Data [28].
Temperature, pH, DO, conductivity, and turbidity were measured in situ with a Hydrolab Sonde DS5 (USA). The pH electrode was calibrated between sampling campaigns using standard solutions (pH: 4.01 and 6.88, Merck) with a precision and accuracy of ±0.01. Surface water samples were collected and stored at 4 °C before analysis within 48 h. TDN, TDP, NO3–N, NO2–N, NH4–N, and TA were determined according to APHA standard protocols [29] with filtration (Whatman Glass Fiber Filter(GF/F): 0.7 µm pore size) for soluble parameters. TA was measured on filtered samples and determined by the single-point titration using methyl orange and phenolphthalein indicators, respectively.
2.2. Photosynthetic pigment analysis
As a proxy of phytoplankton, chlorophyll and carotenoid pigments were extracted from filter papers collected monthly at each river sampling stations and stored at −4 °C for 12 h in acetone: methanol: water (80:15:5), followed by filtration through a polytetrafluoroethylene (PTFE) 0.22 μm filter, and evaporation under nitrogen gas. Dried extracts were then re-dissolved in a solution of (70:25:5) acetone, ion-pairing reagent (0.75 g of tetrabutylammonium acetate and 7.7 g of ammonium acetate in 100 ml water) and methanol. Samples were separated and quantified using an Agilent 1200 series high performance liquid chromatography (HPLC) separation module, quaternary pump, with an octadecylsilyl (ODS) Hypersil column (205 × 4.6 mm; 5 μm particle size) and photo-diode array detector, using modification conditions of Chien et al [30]. Pigments were quantified using commercial standard calibrations (DHI LAB PRODUCTS, Denmark) and identified using absorbance spectra and retention times. Analyzed pigments include those from siliceous algae (fucoxanthin, diadinoxanthin, diatoxanthin), chlorophytes (lutein), cyanobacteria (zeaxanthin, canthaxanthin) and from all primary producers (Chla and its degradation products the allomer Chla' and the epimer Chla").
2.3. OM C/N ratio
Water samples collected monthly at each river sampling station were filtered through 0.7 µm GF/F Whatman filters. Filtrates were scraped from the filter papers and ground using an agate pestle and mortar. The percentage total organic carbon (% TOC) and percentage total nitrogen (% TN) were analyzed by sample combustion in a Costech Elemental Analyser at the National Environmental Isotope Facility, British Geological Survey. C:N ratios are reported as atomic mass ratio.
2.4. pCO2 calculations
Monthly concentrations of pCO2(μatm) at each sampling station were calculated from TA, pH, and temperature using the freshwater option in the CO2SYS program (version 2.0) [31]. pCO2 values were then corrected for pH and alkalinity bias following Liu et al [32]. Bias in pH was estimated using a relationship between pH measurement error and river water ionic strength (conductivity). As low pH data is prone to higher errors owing to low ionic strength, we discarded any sampling data with pH < 6.4 (35 samples out of 367) before corrections [32, 33]. Organic alkalinity was estimated by applying a ratio to river water dissolved organic carbon (DOC) concentration. DOC was indirectly estimated by assuming an exponential relationship with TA [32].
2.5. Data analysis
To reduce variance in the data (tables S3 and S4), the median seasonal and annual values of the corrected monthly pCO2, pigment, physicochemical parameter, C:N data, and river discharge data at each sampling station were calculated prior to statistical analysis. Conductivity and NH4–N were highly collinear with the other parameters and excluded from all analyses. A Tukey Honest test (p < 0.05) was used to assess differences in physicochemical variables, water discharge, C:N data and pCO2, at: (a) the annual between-river scale; (b) within-river seasonal scale; and (c) Hanoi City vs. less densely urban populated RRD provinces (Yen Bai, Phu Tho, Hoa Binh, Ninh Binh, Ha Nam and Nam Dinh). This test incorporates an adjustment for the unbalanced sample size to avoid inflation in the probability of declaring a significant difference between the groups.
Spatial gradients in the a/biotic parameters and pCO2 variation were then assessed using Multiple factor analysis–MFA [34]. MFA clusters the different phytoplankton pigments (cyanobacteria, siliceous algae, chlorophytes and phytoplankton biomass), selected water quality parameters (i.e. excluding those used to calculate pCO2), C:N, discharge, and corrected pCO2 along with categorical variables (river name and season) into specific groups to simultaneously assess the amount of variation explained by each group. The quantitative group variables were scale-transformed in the MFA to reduce skewness and rescale the data into comparable units [34]. The MFA was performed in R using the package FactoMineR [35].
A partial redundancy analysis (pRDA; varpart function in 'vegan' R package) [36] was then conducted to partial out the unique contribution of the a/biotic data on pCO2 variation. A parsimonious pRDA was achieved by selecting first, the most important a/biotic predictors of pCO2 variation via forward selection analysis (forward.sel function in 'adespatial' R package) [37]. The variation explained by each component in the pRDA was corrected to adjusted R2. The total variance of the pRDA was decomposed into four fractions: (a) abiotic, (b) biotic, (c) shared, and (d) unexplained variation. The shared fraction (c) represents variance that may be attributed to biological and/or abiotic descriptors together. The significance of each component was tested through 499 random Monte Carlo permutations under the reduced model.
3. Results
3.1. Between-river water quality
Median values of the study a/biotic parameters and Tukey test results are presented in the tables S3–S5 respectively. Significant comparisons between these parameters (figure 2), indicated that annual median nutrient concentrations in the Day River were higher (TDN: 3.3 ± 1.6 mg l−1; NO2–N: 0.1 ± 0.1 mg l−1; TDP: 0.3 ± 0.4 mg l−1) than the Red River (TDN: 1.3 ± 0.2 mg l−1; NO2–N: 0.03 ± 0.03 mg l−1; TDP: 0.1 ± 0.1 mg l−1). Turbidity (150.7 ± 353.3 nephelometric turbidity unit [NTU]) and TA (1992 ± 243 µmol l−1) were also higher in the Day vs. the Red River (turbidity: 29.5 ± 21 NTU; TA: 1705 ± 84.6 µmol l−1 ). pH (6.8 ± 0.2) and DO (2.6 ± 1.0 mg l−1) were in turn, lower in the Day vs. the Red River (pH: 7.1 ± 0.3; 3.9 ± 0.4 mg l−1). C:N ratios of OM were higher in the Red (8.4 ± 1.4) than the Day (6.5 ± 0.6) River. Higher (∼10-fold) chlorophyll and carotenoid pigments from river phytoplankton were also found in the Day River than the Red River (figure 2).
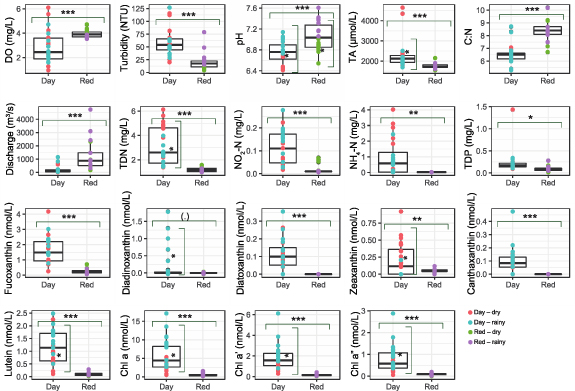
Figure 2. Boxplots showing significant comparisons (horizontal brackets) as indicated by Tukey Honest test analysis, of water chemistry parameters (this study), organic matter ratio (C:N) (this study), river discharge parameters (Vietnam center for hydro-meteorological data [28]) and phytoplankton pigments (this study) between the Day and Red Rivers during 2018–2019. Significant seasonal comparisons in these parameters at the within-river scale are also indicated (vertical brackets). (.) p ⩽ 0.1; *p ⩽ 0.05; **p ⩽ 0.01; ***p ⩽ 0.001. Non-significant comparisons are presented in table S5.
Download figure:
Standard image High-resolution image3.2. Within-river seasonal water quality
Comparisons in a/biotic parameters between the seasons at each river (figure 2) indicated that during the dry season, pH in both rivers was significantly lower (Day River: 6.6 ± 0.2; Red River: 6.8 ± 0.1) than in the rainy season (Day River: 6.9 ± 0.1; Red River: 7.3 ± 0.2). TDN and TA concentrations were also higher in the Day River during the dry season (TDN: 3.9 ± 1.6 mg l−1; TA: 2564 ± 9230 µmol l−1) than the rainy season (TDN: 2.3 ± 0.8 mg l−1; TA: 1992 ± 243 µmol l−1). Among river phytoplankton, diadinoxanthin from siliceous algae mainly occurred during the wet season in the Day River. Lutein from chlorophytes and indicators of total phytoplankton biomass in the Day River were also higher in the rainy season (lutein: 1.6 ± 0.6 nmol l−1; Chla: 8.7 ± 4.1 nmol l−1; Chla': 2.5 ± 1.4 nmol l−1; Chla": 1.1 ± 0.7 nmol l−1) than in the dry season (lutein: 0.8 ± 0.6 nmol l−1; Chla: 2.8 ± 1.6 nmol l−1; Chla': 1.2 ± 0.7 nmol l−1; Chla": 0.5 ± 0.3 nmol l−1). Zeaxanthin was, in contrast, higher in the Day River during the dry season (0.4 ± 0.2 nmol l−1) vs. the rainy season (0.02 ± 0.05 nmol l−1).
3.3. Water quality in Hanoi City vs. less densely urban-populated provinces
Discharge in the Red River during both seasons, was significantly higher in Hanoi City than in the other provinces (figure 3). During the dry season in the Day River, DO (1.9 ± 1.2 mg l−1) and NO3–N (0.7 ± 0.5 mg l−1) were lower around Hanoi City than in the other provinces (DO: 3.8 ± 1.5 mg l−1; NO3–N: 1.9 ± 0.9 mg l−1). During the dry season, TA (3362 ± 1332 µmol l−1) and TDP (0.5 ± 0.6 mg l−1) were in turn, higher in the Day River, around Hanoi City compared to the other provinces (TA: 2150 ± 189 µmol l−1; TDP: 0.1 ± 0.03 mg l−1).
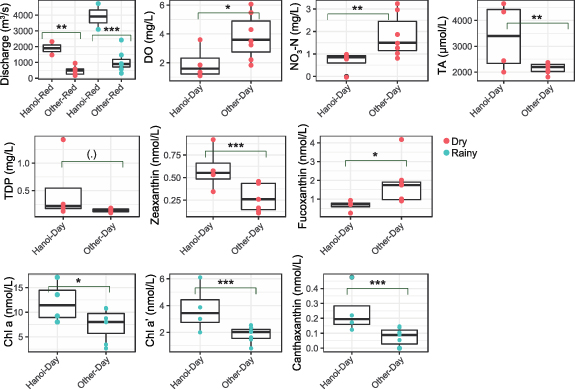
Figure 3. Boxplots showing significant comparisons as indicated by Tukey Honest test analysis of water chemistry parameters (this study), river discharge parameters (Vietnam center for hydro-meteorological data [28];) and phytoplankton pigments (this study) between Hanoi City and the other less densely urban-populated provinces in the Day and Red Rivers during 2018–2019. (.) p ⩽ 0.1; *p ⩽ 0.05; **p ⩽ 0.01; ***p ⩽ 0.001. Non-significant comparisons are presented in table S5.
Download figure:
Standard image High-resolution imagePhytoplankton biomarkers from cyanobacteria (zeaxanthin: 0.6 ± 0.2 nmol l−1) were higher around Hanoi City in the Day River during the dry season than in the other provinces (zeaxanthin: 0.3 ± 0.1 nmol l−1), while siliceous algal biomarkers (fucoxanthin) were lower in Hanoi City (0.7 ± 0.3 nmol l−1) than in the other provinces (1.9 ± 1.1 nmol l−1) (figure 3). In the rainy season, biomarkers representing siliceous algae (diatoxanthin: 0.2 ± 0.4 nmol l−1), cyanobacteria (canthaxanthin: 0.1 ± 0.1 nmol l−1), and total phytoplankton biomass (Chla: 7.1 ± 3.2 nmol l−1, Chla': 1.8 ± 0.5 nmol l−1) were lower around Hanoi City in the Day River vs. the other provinces (diatoxanthin: 1.2 ± 1.3 nmol l−1, canthaxanthin: 0.2 ± 0.2 nmol l−1, Chla: 12.0 ± 4.2 nmol l−1, Chla': 3.7 ± 1.8 nmol l−1).
3.3.1. pCO2
After correction, water pH increased on average by 0.12 units across the Day River and by 0.14 units across the Red River (table S6). Alkalinity only declined in both rivers by <3%. Consequently, correcting pCO2 indicated an overestimation of around 36 ± 8% for the Day River data and of 42 ± 7% for the Red River data (figure 4(a); table S6). The annual median concentration of both rivers combined (i.e. RRD) was 3976 ± 3144 µatm and there were significantly higher median values in the Day River (5000 ± 3300 µatm) than in the Red River (2675 ± 2271 µatm) (figure 4(b)). Concentrations in both rivers were much higher in the dry season (Day River: 6689 ± 3821 µatm, Red River: 4404 ± 1883 µatm) than in the rainy season (Day River: 3908 ± 1259 µatm; Red River: 1402 ± 579 µatm). No differences in pCO2 concentrations were observed between Hanoi City and the other less urban-populated provinces in both rivers.
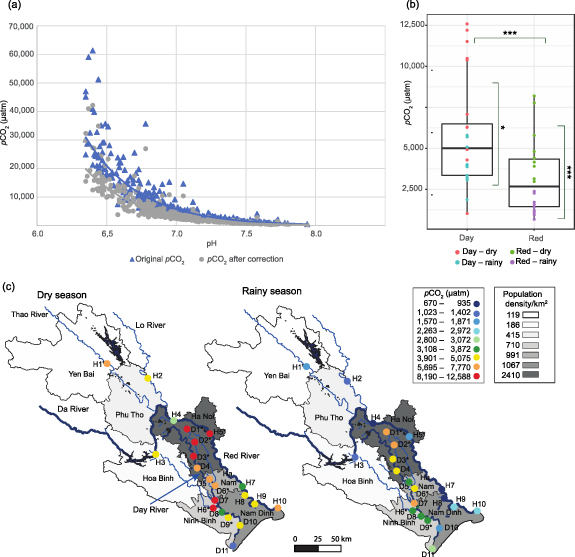
Figure 4. (a) Original pCO2 values (blue triangles), across the sampling stations in the Red and Day Rivers vs. corrected pCO2 values from bias in pH measurements and high organic alkalinity (grey dots); (b) boxplots showing significant comparisons (horizontal brackets) as indicated by Tukey Honest test analysis of corrected median pCO2 values between the sampling stations in the Red and Day Rivers. Significant seasonal variations in corrected median pCO2 values within the rivers sampling stations are also indicated (vertical brackets). *p ⩽ 0.05; **p ⩽ 0.01; ***p ⩽ 0.001; (c) spatial and season variation of corrected median pCO2 values across the sampling stations in the Red River Delta.
Download figure:
Standard image High-resolution image3.4. Gradients of change
The MFA showed the data are clearly separated by river, seasons, and degree of urbanization (Hanoi City vs. other provinces) (figure 5). Red River data negatively correlated with dimension 1 (DIM1), and Day River data positively. The a/biotic data from monitoring during the rainy season, were negatively associated (for both rivers) with dimension 2 (DIM2), but positively related to DIM2 during the dry season. An upstream-downstream spatial pattern, particularly for the Day River, was also depicted with downstream more saline (marine-influenced) areas converging towards the center of the plot and Hanoi city stations towards the right-hand side of the plot.
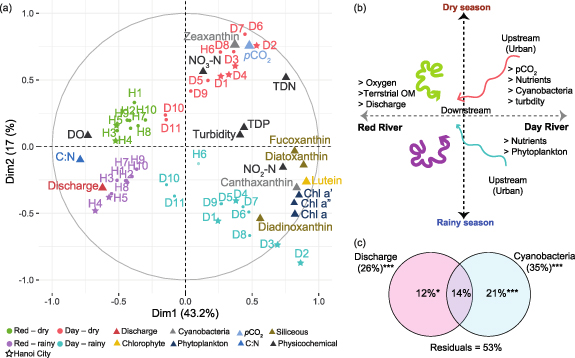
Figure 5. (a) Multiple factor analysis (MFA) plot showing the variation of the river phytoplankton groups (as pigments from all primary producers, cyanobacteria, chlorophytes and siliceous algae), selected water quality parameters (DO, NO2–N, NO3–N, TDN, TDP), corrected pCO2 values, river discharge, and organic matter ratio (C:N) in the Day and Red Rivers during the dry and wet seasons; (b) schematic representation of (a) summarizing the main patterns. (c) Venn diagram showing the results of partial variance redundancy analysis (pRDA) performed on the variation of pCO2 values and forward selected river discharge and river cyanobacteria (zeaxanthin) in the Red and Day Rivers. *p < 0.05; **p < 0.01; ***p < 0.001.
Download figure:
Standard image High-resolution imageMFA DIM1 explained 43% of the total variation with degree of urbanization, river phytoplankton pigment groups, river type, water quality, and C:N ratio having the greatest contribution (figure S1). DIM2 explained 17% of the total variation with season, pigments from cyanobacteria, and pCO2 contributing the most (figures 1 and S1). A strong negative association with DIM1 was observed for river discharge, DO, and C:N ratio, while pCO2, nutrients and turbidity, were all positively correlated. Pigments from river phytoplankton were all positively related to DIM1 but separated along DIM2. pCO2, NO3–N, and cyanobacteria (zeaxanthin) positively related to DIM2, while all siliceous algae, cyanobacteria (canthaxanthin) and phytoplankton biomass negatively relate to DIM2.
Forward selection analysis identified cyanobacteria (zeaxanthin) and river discharge, as the most significant variables contributing to pCO2 adjusted variation (table S7). After accounting for the shared effects (14%), river discharge alone related to a significant 12% of the pCO2 variation and cyanobacteria uniquely to 21% (figure 5(c)). A remaining 53% of the pCO2 variance was unexplained by discharge and cyanobacteria.
4. Discussion
4.1. Main factors influencing pCO2
Comparisons of two tropical rivers (Red and Day) which differ in size, discharge, degree of urban population, and water pollution allowed us to estimate the extent and causes of CO2 supersaturation in the RRD, one of the most densely populated river deltas in Southeast Asia. Both river networks exhibited pCO2 above atmospheric equilibrium (>410 μatm), consistent with other river studies in Southeast Asia, showing that they function as potential sources of CO2 to the atmosphere. However, the 1.8-fold higher pCO2 across the more hydrologically-regulated Day River, along with higher nutrients and lower DO across Hanoi City, highlight significant negative urban influences on river water quality and carbon dynamics. Urbanization effects on pCO2 were further supported by the observed pCO2 in the Day River during the dry season, which was almost double that of the Red River and was 2.4-fold higher than the median of calculated and directly measured pCO2 (2811 ± 3577 µatm) in >20 global sub/tropical studied rivers (figure 6).

Figure 6. Annual median (bars) and standard deviation (line) of corrected pCO2 in the two studied rivers (Red and Day [bold, red bars]) in the Red River Delta (RRD), in comparison to other tropical and subtropical rivers. pCO2 equilibrium with the atmosphere (410 µatm) is indicated by the vertical black line (– –) line, the median pCO2 values (2811 ± 3577 µatm) and average (4097 ± 3577 µatm) of the tropical and subtropical rivers by the vertical (-—-) (–.–.) blue lines respectively, and the average (2798 ± 1906 µatm) value of calculated and corrected values of >1300 sampling points across China's streams and rivers by Ran et al [38] by the vertical (.–.–.) green line. Superscripts number in each river name indicate reference sources (in supplementary material). a Calculated pCO2; b Direct observations of pCO2.
Download figure:
Standard image High-resolution image
Compared to the Red River, the Day River has a more populous catchment with abundant OM and TA sources, and waters that are turbid, hypereutrophic and with oxygen concentrations that are marginal for supporting aerobic life. The observed large differences in pCO2 between the two rivers reflect the more stagnant/lentic conditions of the Day River resulting from river channelization and intensive ground and surface water use of approximately 70 l person day−1 within Hanoi City [39, 40]. Urban domestic sewage effluents increase OM inputs enriched in organic nitrogen and heterotrophic micro/organisms [12, 18] and can reduce riverine organic C:N ratios below those typical of terrestrial sources [41]. The higher lability of DOC derived from urban watersheds is also thought to contribute to higher CO2 production and DIC [11–13]. Aquatic pCO2 can be higher in such narrower, smaller river channels with lower flow velocity and greater concentrations of DIC and OM [11–13], and the modifications of the Day River appear to have markedly enhanced pCO2 in the upstream urban areas around Hanoi City. Higher [NO3–N] outside Hanoi City during the dry seasons in the Day River (figure 3) likely reflects the influence of nitrogen, phosphorus and potassium (NPK) chemical fertilizers and urea that are heavily applied during the dry season in rice paddy fields, and which eventually leach into rivers/canals networks [42]. Alternatively, as observed in the Red River, OM and pollutant inputs from urbanization can be diluted (though still above equilibrium) in large fast-flowing rivers, leading to lower pCO2 [43].
4.1.1. pCO2 and river phytoplankton
The Day River supported more phytoplankton, of which, riverine cyanobacteria is uniquely related to large portions of the pCO2variation. This effect was especially strong during the dry season in the upstream zones (Hanoi City), suggesting that times of water scarcity enhance potential HAB risks. The more stagnant and lentic conditions in urban areas may thus create synergistic opportunities for the intensification of HABs and CO2 production [18, 44–46]. Prevalent cyanobacteria species in the dry season in both rivers include Merismopedia sp., Microcystis aeruginosa, and Oscillatoria sp [47, 48]. These cyanobacteria (particularly Microcystis) thrive under high nutrient conditions and supersaturated pCO2 [18, 44, 45]. The algal biomass produced by such HABs can in turn, enhance turbidity and limit light availability in the water column for primary production, while increasing OM sources and decomposition, which together could further increase CO2 production [18, 44, 45]. The positive relationship between Chla degradation products with pCO2 during the rainy season also suggests that particulate and partially degraded OM could be important sources to support river respiration during high river discharge [48].
4.2. Potential confounding factors and pCO2 uncertainties
As the river water moves from the upstream urban areas towards the coast, the physicochemical conditions of the waters may naturally change towards an increase in pH and bicarbonates [15, 41]. Such changes may simply reflect lower pCO2 in the coastal areas compared to the upstream urban areas [15, 41], hence confounding our interpretations. However, the spatial variation in pH and TA across our sampling sites does not entirely reflect such a gradient in water chemistry (table S3), suggesting the impacts from other driving factors such as the influence of river urbanization on pCO2.
Direct measurements of water pCO2 are scarce in tropical rivers. However, as water properties including T, pH, and TA are regularly monitored by governments and research bodies, estimations of pCO2 from these monitored parameters remain important for assessing trends of C dynamics in response to human activities [38, 48]. Correcting the pCO2 values for pH and organic alkalinity bias reduces estimations by 30%–50%; as recently reported in China's main rivers [48]. Although organic alkalinity is recognized as a main source of CO2 calculation error in tropical acidic waters [32, 33], the high TA (>1000 μmol l−1) in the RRD waters resulted in minimal influence. pCO2 estimations also concur with previous assessments in the Day (calculated values) and Red (direct measurements) Rivers, especially during the rainy season (figures 4 and 6). In our study there was a marked exceedance of pCO2 during the dry season in the Red River compared to that recorded in 2014 [20]. Such exceedances are most likely to be due to distinct pH and rainfall patterns between 2014 and 2018–2019 [19] with dry season pH (8.1 ± 0.2 [20]) and rainfall (1660 mm) being higher in 2014 than in 2018–19 (pH 6.8 ± 0.1 [20]; rainfall 1311 mm). Similar low pH values (7.3 ± 0.1) were also reported in 2019 for the Red River [49].
4.3. Implications and conclusions
Carbon emissions from fossil fuels and land use change combined are estimated at around 11 500 ± 0.9 Tg C yr−1 globally [50]. The natural contribution of tropical riverine CO2 fluxes to the global C budget is comparatively minimal (<600 Tg C yr−1). However, our findings are consistent with recent research showing that water quality degradation through increasing lentic/stagnant waters from river channelization, sewage treatment infrastructure, and pollution load in densely populated cities, could significantly strengthen the potential for river CO2 outgassing [11–13, 51]. Annual pCO2 in the Day River was 1.8-fold higher than in the Red River and up to two-fold greater during the dry season than the median of pCO2 in >20 sub/tropical rivers. Thus, the rapid urbanization of rivers could result in hotspots of aquatic CO2 sources, water pollution and HABs [11–13], increasing water quality concerns downstream for communities who are dependent on the water and for river biota [52]. The increase in water demands to support urban development coupled with periods of low rainfall and river flows as projected in future climates [53, 54] could further exacerbate such risks. Currently, 29% of total wastewater in Hanoi is treated [55] with near-future plans (2021–2025) aiming to increase it to 50% [56]. Such endeavor will undoubtedly help removing OM, and organic nutrients load into the rivers. However, the wastewater collection system and the pumping of untreated wastewater into the Red River for flood remediation, are still a big issue [42]. This means that water quality in the RRD needs to be monitored carefully in the long-term, especially as the release of mineralized nutrients from the expanding water treatments plants will likely exacerbate the HABs-pCO2 feedback loop.
Traditionally, urban tropical river drainage systems include levees, dams, artificial lakes, and detention facilities to cope with the prevalent floods [22]. However, we demonstrate here that beyond flood control, water quality degradation and the associated increases in pCO2 and HABs must also be considered to achieve environmental sustainability. To help mitigate these harmful effects introduced by urban development, we suggest carrying out responsive water course management actions to increase river flows in problem areas during the dry season [22, 40], along with the implementation of green infrastructure that prioritize the natural hydrological functions of the river [54]. Improving sanitation infrastructure and management in urban centers [51] and strengthening the engagement with local government to exchange research findings and support policy making on water management, including sustainable agricultural development (e.g. use of fertilizers) [42], could further help reducing nutrient load and greenhouse gasses.
Acknowledgments
This work was supported by funding from the UKRI-GCRF NE/S008926/1 Living Deltas Hub and the NERC-NAFOSTED Research Partnerships Grant NE/P014577/1 Assessing human impacts on the Red River system, Vietnam, to enable sustainable management. We also thank the lab members of the Analytical Chemistry Department, Institute of Chemistry Vietnam Academy of Science and Technology A18, Hanoi, Vietnam, for fieldwork and laboratory support.
Data availability statement
The data that support the findings of this study are openly available at the following URL/DOI [57]: https://doi.org/10.5285/7e35e760-0ca2-4290-8970-464ead03055d.
Conflict of interest
The authors declare that the research was conducted in the absence of any commercial or financial relationships that could be construed as a potential conflict of interest.
Author contributions
S M, V N P, T A D, and D T N designed research; J S, S T, T A D, J H L and D T N performed research; T A D, M J L and D T N contributed analytic tools; J S analyzed data; and J S, S M, V P, T A D, D T N, L R R, Y Z, A B, J H L, M J L and S T, wrote the paper.
Supplementary data (0.3 MB XLSX)