

Abstract
Tropical cyclones range among the costliest of all meteorological events worldwide and planetary scale warming provides more energy and moisture to these storms. Modelling the national and global economic repercussions of 2017's Hurricane Harvey, we find a qualitative change in the global economic response in an increasingly warmer world. While the United States were able to balance regional production failures by the original 2017 hurricane, this option becomes less viable under future warming. In our simulations of over 7000 regional economic sectors with more than 1.8 million supply chain connections, the US are not able to offset the losses by use of national efforts with intensifying hurricanes under unabated warming. At a certain warming level other countries have to step in to supply the necessary goods for production, which gives US economic sectors a competitive disadvantage. In the highly localized mining and quarrying sector—which here also comprises the oil and gas production industry—this disadvantage emerges already with the original Hurricane Harvey and intensifies under warming. Eventually, also other regions reach their limit of what they can offset. While we chose the example of a specific hurricane impacting a specific region, the mechanism is likely applicable to other climate-related events in other regions and other sectors. It is thus likely that the regional economic sectors that are best adapted to climate change gain significant advantage over their competitors under future warming.
Export citation and abstract BibTeX RIS

Original content from this work may be used under the terms of the Creative Commons Attribution 4.0 license. Any further distribution of this work must maintain attribution to the author(s) and the title of the work, journal citation and DOI.
With annual global damages amounting to $26bn [1], tropical cyclones (TCs) range among the costliest and most harmful natural disasters. In the US, they have caused more than half of all damages attributed to extreme weather since 1980 [2]. One particularly destructive hurricane was Harvey in 2017. It made landfall along the Texas coast on 26 August 2017 as a category 4 TC on the Saffir–Simpson scale. Stalling for four days, the storm released torrential rainfall and flooded large areas, predominantly in the state of Texas but also in Louisiana [3]. Harvey resulted in 89 deaths and caused an estimated total damage of $125bn (in 2017 dollars). Adjusting for price inflation, this makes Harvey the second-costliest hurricane on record after Katrina (2005) [2].
Natural disasters like Hurricane Harvey not only cause dramatic loss of life and damages in capital stock locally (denoted 'damages' hereafter). Losses of local production from business interruption (denoted 'direct losses' hereafter) also propagate through the global supply chain network and lead to higher-order effects and associated economic repercussions (denoted 'indirect' or 'higher-order' effects) elsewhere in the world [4–6]. Analyses of such indirect effects from individual historic TCs [7, 8] suggest that also Harvey's economic repercussions extended well beyond the directly affected area within the US.
With intensifying weather extremes due to anthropogenic climate change [9], the damages, direct losses and thus indirect repercussions from TCs can be expected to increase in the future [1, 10–12]. It has already been shown that a significant share of Harvey's economic costs can be attributed to the ∼1 ∘C global warming in 2017 [13]. Even though TC frequency is believed to decrease or remain stable, the Intergovernmental Panel on Climate Change (IPCC) projects an increase in intensity and precipitation of the most severe TCs [14–16], and particularly those with a genesis in the North Atlantic basin [17]. In addition to changed climatic conditions [18], increased economic values at risk are another factor for exacerbated future TC damages [19, 20].
On the 16th anniversary of Hurricane Katrina, Hurricane Ida made landfall in Louisiana on 29 August 2021 [21]. Even though among the five costliest US hurricanes on record [22], Ida's damages did not match those of Katrina, which has been attributed to the improved New Orleans levee system after the latter. While there are meteorological differences between the two storms, this example highlights the importance to assess possible impacts of past events under future conditions so that appropriate countermeasures can be taken. Here, we aim to assess possible economic repercussions of Hurricane Harvey under further global warming. To approach this, we use a storyline method [23–25] and construct counterfactual scenarios of Hurricane Harvey under future climate conditions. The storyline approach aims to generate and assess plausible effect chains that probabilistic approaches would typically fail to cover due to the relatively rare occurrence of extreme events like Hurricane Harvey. Previous studies (e.g. [26–29]) that show exacerbated economic repercussions from TCs under climate change often use large ensembles of simulated TCs or try to detect trends in historic observations. Here we focus on a single historic event and the economic repercussions it could result in under different climate.
1. Method overview
We generate counterfactuals for an additional increase in global warming of up to 4 ∘C after 2017. These counterfactuals are based on a conceptualization [30] of the original (i.e. unscaled) Hurricane Harvey, modelled as a decrease in productive capacity (the direct economic shock). Note that this shock only models short-term business interruption and does not cover reconstruction efforts or externalities on, e.g. the transport sector (see supplement A: methods and [30] for details). The original scenario is then projected to future climate (scaled or counterfactual scenarios). We generally assume a shock for the US states Texas and Louisiana with exponential decay, deriving the initial shock intensity from the share of the economy that is geographically exposed to the hurricane. For the latter, gross regional product on a county level is used as a proxy. The duration of the shock is estimated from reported initial unemployment claims in the state of Texas after Hurricane Harvey.
Projections are based on the expectation that precipitation will increase with global warming and that hurricanes may grow larger [12, 31–33] and have longer decay time on land [34], affecting larger areas. According to the Clausius–Clapeyron equation, warming of 1 ∘C yields an additional 7% of possible air moisture [35] and thus potential precipitation. However, precipitation increase from hurricanes due to climate change must be assumed to be much higher [36] and previous studies [35, 37, 38] confirm this for the case of Hurricane Harvey. We therefore here use the average best estimate of the three studies on Harvey, i.e. about 19% ∘C−1 warming [13]. Assuming that damages increase linearly with precipitation and that recovery time from business interruption is proportional to damages, we scale the original hurricane's recovery time with the precipitation increase. Likewise, we scale the initial shock intensity with the increase in exposed gross regional product resulting from larger affected areas. The size of TCs is typically determined as radii of various wind speeds [39] and it is uncertain whether and how it is affected by climate change [16]. However, some studies find a moderate increase in wind speed radii with larger temperatures [40, 41]. We therefore here assume three scenarios A, B and C with no, moderate (5 km ∘C−1) and strong (10 km ∘C−1) increases in radius of affected area by flooding from Hurricane Harvey. Along these three scenarios, we vary parameters slightly for points in steps of 1 ∘C to obtain estimates for variability of the dynamics in our model at these points.
Higher-order effects of natural disasters are often analysed, i.a. using computable general equilibrium (CGE) or I–O (input–output) models. For this study, we use the agent-based model Acclimate [42]. A full review of the variety of models and their applications is beyond the scope of this study and can be found in the literature [4, 43, 44] but we here give a brief reasoning of the model choice and basic functioning. For all details on the model, please see the model publication [42]. Unlike CGE models [44], Acclimate does not require market equilibrium. This is particularly important in the immediate aftermath of a disaster [7] which we focus on here. At the same time, there is only one equilibrium and the model cannot capture longer-term structural network adaptation or economic growth. Like I–O models, Acclimate assumes a fixed-proportion production function. However, it is less rigid than I–O models [43, 44] in that it can respond to price changes and adjust each agent's production capacities. The economic and spatial resolution of Acclimate is in principle only bound by data availability for the underlying baseline network, theoretically allowing the simulation of single firms as agents. Here, as baseline, we use a disaggregated [45] version of the EORA multi-region input–output (MRIO) database [46] for the year 2015. With a total of 268 regions and 27 sectors, this results in over 7000 economic agents that are connected through a dense network of more than 1.8 million trade relations.
Agents in Acclimate represent economic sectors of entire regions (countries, generally and states or provinces for the US and China, respectively). Their rationale is, for an agent-based model, rather sophisticated with a local optimization scheme. This is guided by prices, in particular, extra unit production costs when firms use additional idle capacities and costs that arise through deviating from baseline supply relations. Additionally, agents can resort to inventories, storages, when needed. The dynamics of the model accordingly depends not only on the structure of the underlying network, but also on the parameterization of emerging local price changes as well as storage sizes and usage time frames. For this model parameterization we overall stick to the parameters values that have been identified in the model description publication [42] (supplementary table 4). However, for key price and storage parameters we conduct a sensitivity analysis over a wide value range in supplement B: sensitivity analysis.
In this paper, we analyse how net production changes globally in the direct aftermath of the disaster. Hereafter, we refer to net production volumes, i.e. the difference of an agent's outputs to its inputs, simply as 'production'. We assess if and how direct production losses in Texas and Louisiana can be balanced out by other regions. We thereby define production increases by other regions as compensation efforts for direct losses, or simply as compensation. Note that compensation here should not be confused with wages, a notion common in other branches of economics. We find that while the United States are able to compensate for direct local production losses from the original 2017 hurricane, this is no longer possible with further global warming. Losses in the US cannot be offset by national efforts with intensifying hurricanes under unabated warming. At a certain warming level, other countries and regions step in to supply the necessary goods for production. In the highly localized mining and quarrying sector (which here also comprises oil and gas production), this happens already with the original Hurricane Harvey and intensifies under warming. Eventually, also other regions reach limits of what they can offset, suggesting an individual threshold for compensation capabilities. Our results show that countries have an interest to adapt their economies such that they are able to compensate for direct losses from extreme weather in order to keep a competitive advantage. One possible way of adaptation is regional distribution of production capacities. For sectors where this proves challenging, sufficient buffers are necessary to reduce dependencies on other regions for compensation.
2. US unable to compensate for losses under climate change
We first investigate how global production changes during the first year after the original, unscaled hurricane. For this, we aggregate each region's difference from baseline production during this time and find that—all sectors combined—production gains outweigh losses on a global level. The latter are almost exclusively direct losses in Texas (99.6% of all losses) while indirect losses after the disaster can be regarded as negligible. California, New York and Florida as the economically strongest US states show the largest share of gains. Even though directly affected by the hurricane, Louisiana can compensate for local direct losses. In total, losses in Texas are about equal to the gains in all other US states, meaning that the country can overall compensate for these losses. However, while other regions in the world experience production increases due to the temporary scarcity of goods, the US does not profit from this stimulus due to the compensation efforts.
While the US can overall compensate for direct losses in Texas, this is not achieved on the individual level of the mining and quarrying sector which is highly concentrated in Texas. Texas is responsible for over 42% of US crude oil production and over 25% of US natural gas production 5 . We compare how production is redistributed globally in this sector after the hurricane, compared to an aggregate of all other economic sectors. For each region, we calculate the share of global production gains or losses, respectively, depending on whether a region experiences an overall increase or decrease in production compared to baseline. Results are shown (again for the time of one year after the hurricane) in figure 1. We observe that the lost production in Texas results in a much different production distribution for the different sectors. Only about 11.5% of global production gains in the mining and quarrying sector are realized within the US as opposed to about 62.8% for the aggregated remaining sectors. At the same time, mining and quarrying gains realized within the US do not outweigh losses in Texas, resulting in a net production loss of the country in this sector. To offset this loss on a global scale, demand and thus production are shifted from the US to other strong mining and quarrying export regions (figure 1(b), supplementary table 2). The degree to which production is shifted to these regions is significantly higher than with regards to the aggregated remaining sectors. We note that also strong coal-producing regions like Australia, Indonesia and India show increased production in this sector, even though Texas and Louisiana are responsible for only small shares of total US coal production [47, 48]. The reason for this lies in the economic baseline data we use for our model. In this data, mining and quarrying does not only contain monetary flows for oil and gas trade but also other fossil energy resources and their production like coal.

Figure 1. Global production anomaly distribution for the unscaled Hurricane Harvey. Net regional gains or losses as percentage share of global total gains or losses, respectively, for (a) an all industry aggregate without the mining and quarrying sector and (b) only the mining and quarrying sector. Production anomaly is calculated as a region's difference in production quantity during the first year after the hurricane to baseline production. Orange colours indicate production gains, purple colours indicate losses. Grey regions without significant production. Note the different scales of gains and losses for better visibility. All region shape files retrieved from GADM [49].
Download figure:
Standard image High-resolution imageWe observe that production gains outside of Texas grow when projecting the original, unscaled direct economic impact of the hurricane to future climate. In figure 2 we show the relative production difference on a global scale for all simulated scenarios, excluding Texas and Louisiana as directly affected regions. We find that, for all assumed temperature-radius relationships, global production increases roughly linearly with global warming. Notably, the relative production increase of the mining and quarrying sector is slightly more than twice the relative increase of the rest of the industry. This factor is a result of the respective sector shares of global exports from Texas (supplementary table 3), which are almost twice as high for the mining and quarrying sector as for the aggregated other sectors. While global production excluding the directly affected US-states increases with all assumed temperature-radius relationships, the steepness of the slopes for this relationship has an impact on the change of absolute production values. However, the qualitative result of linearly increasing global production is robust against variation of the assumed slopes and the dominant factor for production increase is the change in temperature, given the moderate radius increases. Results are also robust against slight variation of radius and temperature (boxed fields in upper panels and error bars in lower panels of figure 2).

Figure 2. Global production anomaly under simulated climate impact. Anomalies are shown as relative production difference for an aggregate of all global regions except Texas and Louisiana during the first year after the hurricane impact, relative to baseline values for (left) an all industry aggregate without the mining and quarrying sector and (right) only the mining and quarrying sector. (Upper panels) Heat maps with all simulated combinations of  (global mean temperature change after 2017) and
  (radius change to the original Hurricane Harvey). Lines A, B and C denote possible relationships between the two, with slopes 0,
  ,
,  . Nine fine-grained simulations were conducted along these slopes for each
 ![$\Delta T \in [0, 1, 2, 3, 4]$](https://content.cld.iop.org/journals/1748-9326/17/10/104013/revision2/erlac90d8ieqn5.gif) ∘C (boxed fields,
∘C (boxed fields,  ∘C and
  km). (Lower panels) Mean and value range for the boxed fields of each slope in the upper panels.
Download figure:
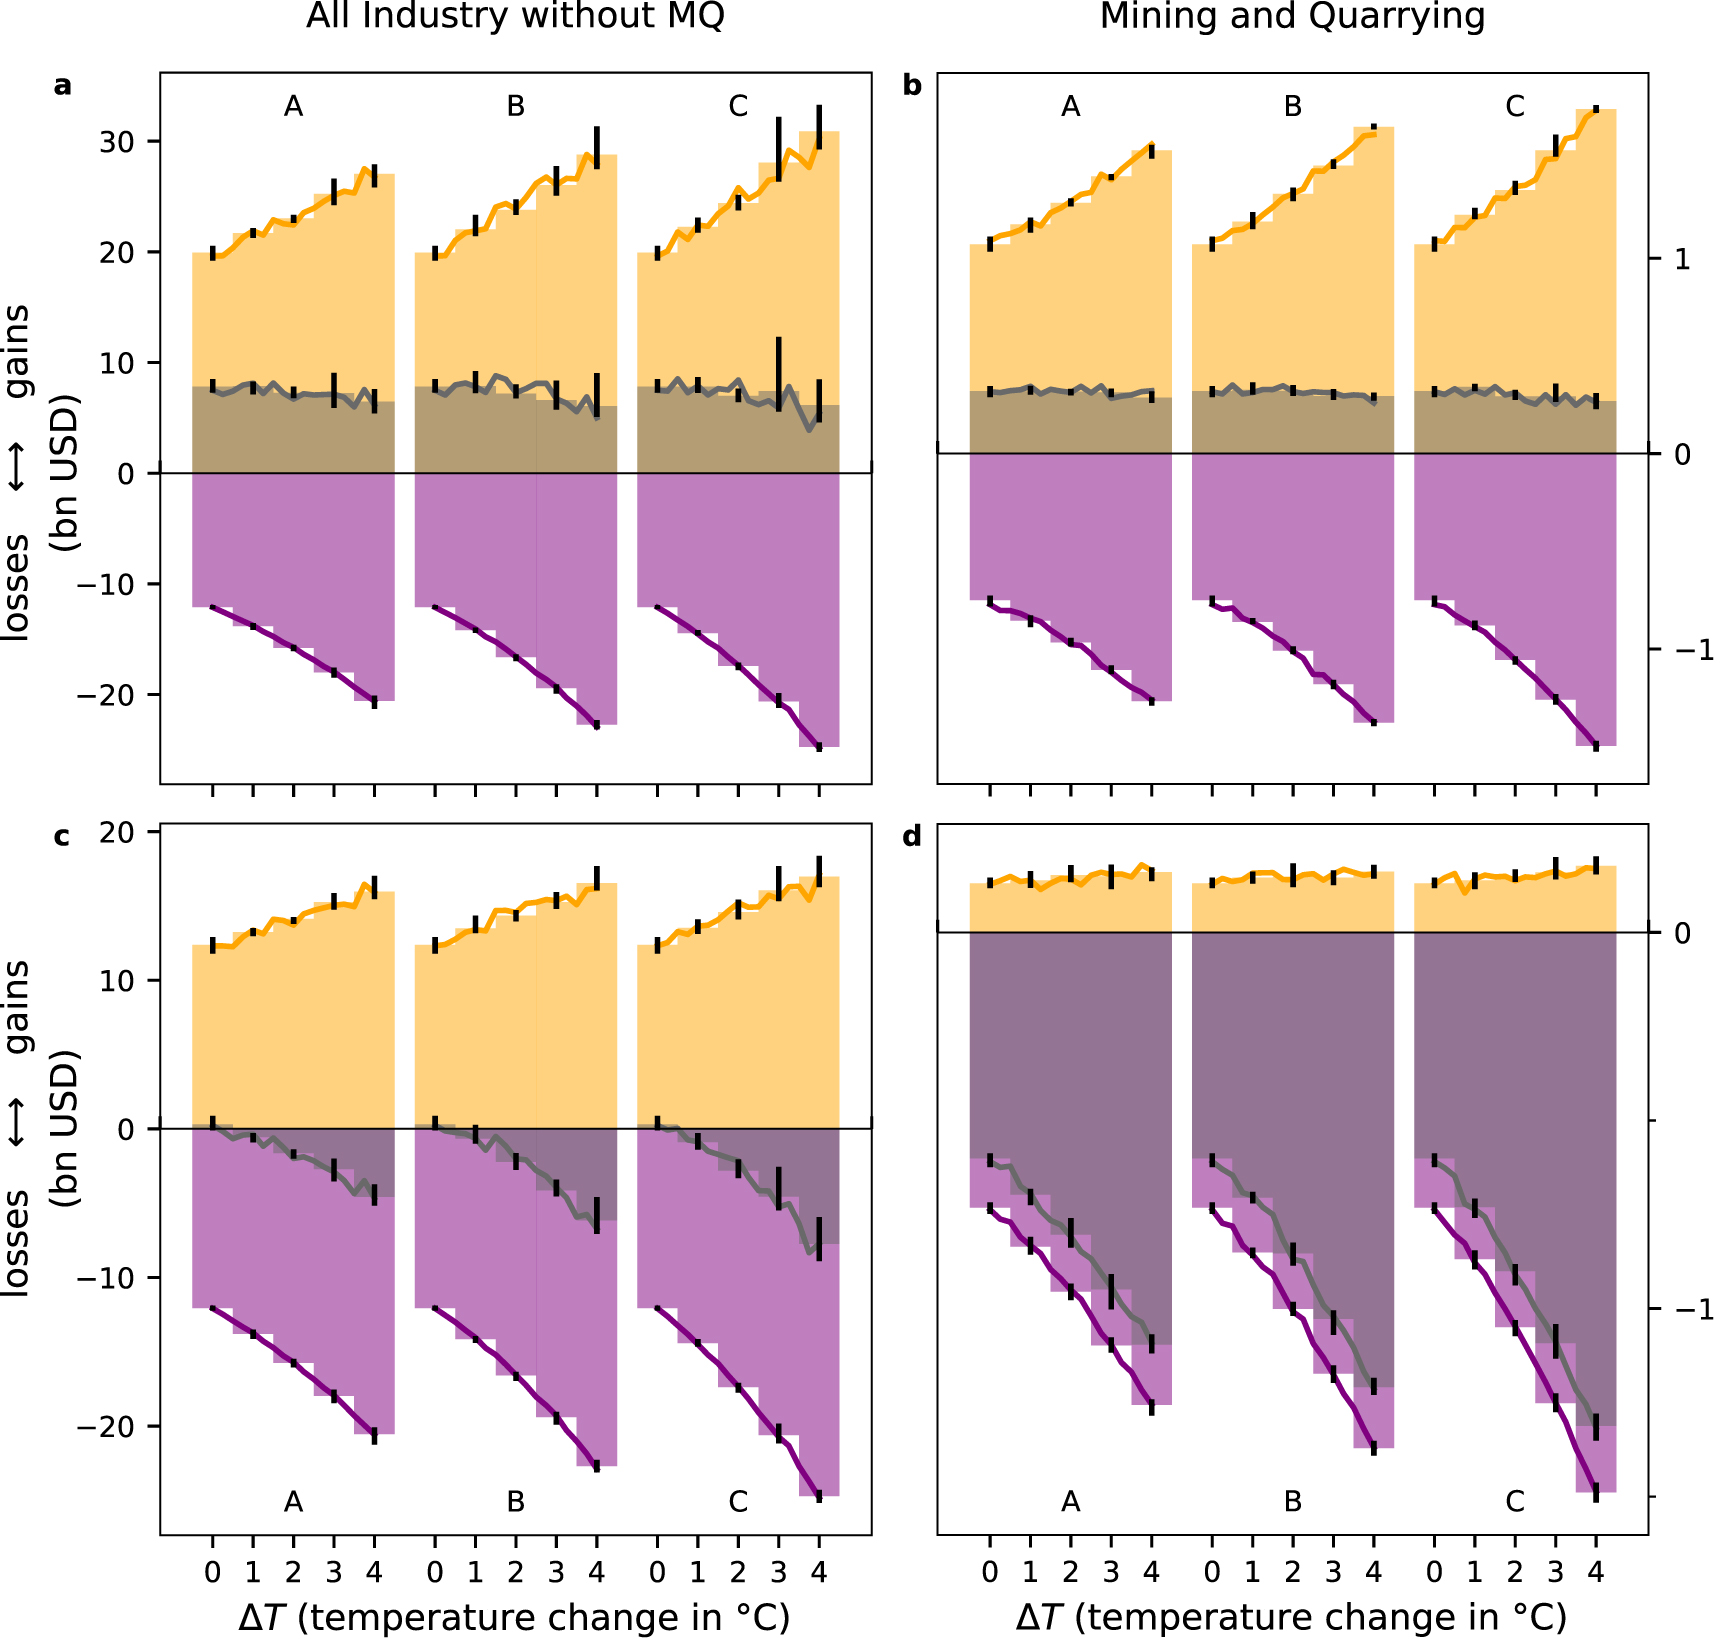
Standard image High-resolution imageOn a global level, the increasing gains offset direct losses under all temperature increases and assumed slopes (figure 3), resulting in net production gains (grey shading in upper panels) in all sectors. Gains in all sectors—both the aggregated sectors and mining and quarrying—increase at a slower pace than losses throughout all simulated scenarios, resulting in a slight decrease of net gains. The United States, on the other hand, can only just compensate for losses in all sectors excluding mining and quarrying under the original, unscaled hurricane scenario. Under all considered slopes, future warming results in net losses (panel (c)). As stated above, the US can in no scenario compensate for mining and quarrying losses on a national level (panel (d)) and net losses in this sector intensify under future warming. In particular, unlike the other sectors, mining and quarrying gains in the US only increase moderately compared to the losses in this sector. This suggests that other US states have reached a limit to which they can compensate for losses in Texas, even in the unscaled scenario.

Figure 3. Absolute gains and losses in the US and globally. Gains (orange) and losses (purple) as well as their sum (grey) (upper panels) globally and (lower panels) in the US are shown for (left) an aggregate of all sectors excluding the mining and quarrying sector and (right) for only this sector. Values are shown for the same slopes A, B and C as in figure 2. Vertical bars represent value range of mini ensembles for temperature changes in steps of 1 ∘C. Solid lines show (linearly interpolated) values for temperature change values in steps of 0.25 ∘C.
Download figure:
Standard image High-resolution image3. Remote regions reach compensation limit under climate change
We further investigate which regions compensate for losses in Texas under climate change, both in the mining and quarrying sector and the aggregate of all other sectors. For this, we calculate the shares of global gains for different groups of regions (figure 4), which we group according to their total export volume excluding the mining and quarrying sector (AI-MQ) as well as the export volume only in the latter. Regions are grouped such that they make up 50%, 75% and 95% of global exports. In addition to this, we also explicitly show shares for the US which ranges in the top 50% exporters for the aggregate of all industries except mining and quarrying sector and in the top 75% of mining and quarrying exporters. For each of these groups and all considered radius-temperature relationships, we calculate absolute gains and the share of global gains in the according sector (or sector group, respectively) that the regions were grouped by. Absolute gains and shares of the respective other sectors can be found in the supplements (supplementary figures 1 and 2).
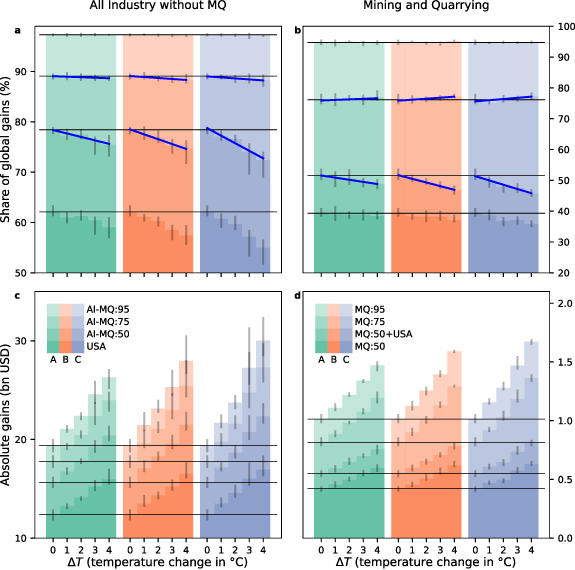
Figure 4. Gains of regions grouped by export volume. Gains are shown for groups of regions that make up 50%, 75% and 95% of global exports (left) in all aggregated sectors except the mining and quarrying sector (AI-MQ, supplementary table 1) and (right) only the mining and quarrying sector (MQ, supplementary table 2). (Upper panels) Relative shares of global gains and (lower panels) absolute values. Legends for upper panels are in respective lower panel. Bar height denotes mean values of gains from the fine-grained simulations along slopes A, B and C as in figure 2, with the full range of values shown as vertical error bars. Horizontal lines mark mean values without global warming. Solid blue lines are linear fits for the AI-MQ:50 and AI-MQ:75 or MQ:50 + USA and MQ:75 groups, respectively.
Download figure:
Standard image High-resolution imageWe find that while global gains continually increase for each of the considered region groups with global warming (lower panels), there is a shift in gain distribution towards smaller regions (i.e. regions with less exports in the baseline state, upper panels). This shift is most prominent with the strongest assumed radius-temperature relationship (scenario C) although shifts can be observed across all slopes with similar qualitative behaviour. Most prominently, the mining and quarrying exporters that are in the top 75% group but not in the 50% + USA group increase their share of gains in this sector under climate change (panel (b), blue trend lines) while shares of the largest exporters (top 50%) generally decrease, both in this sector as well as the other sectors (panel (a)). This suggests that the degree to which large exporters can (cost-efficiently) compensate for losses in Texas diminishes with a stronger climate-induced direct impact. The latter reach their compensation limits and other (smaller) regions take up increasing shares of compensation. This shift from (export-wise) larger regions to smaller regions is more pronounced for the mining and quarrying sector than the remaining aggregated sectors, suggesting that large exporters in this sector reach their compensation limits earlier. This behaviour can be explained with the high regional aggregation of this sector both in the US and globally and the larger relative share of global production that is lost with the direct impact. Therefore, the degree to which the remaining US states can profit from global gains is also smaller in the mining and quarrying sector compared to the other sectors and gains are mostly realized outside of the US. However, we observe the same qualitative behaviour of increasing gain shares for smaller exporters in the top 75% group also in the aggregated remaining sectors (trends in panel (a)). It is less pronounced for these sectors (because regional aggregation is not as high as for the mining and quarrying sector) but is generally applicable to all sectors.
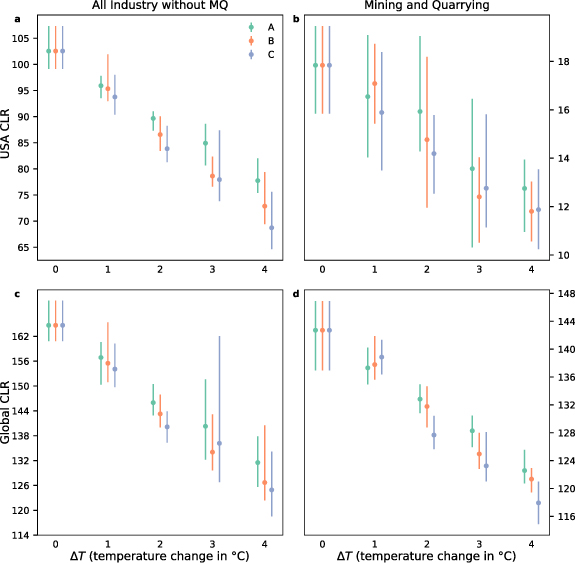
While gains (i.e. compensation efforts) outside of Texas generally increase both in the US and the rest of the world, we now quantify the degree to which these gains balance out losses. We define the compensation to loss ratio (CLR) as the ratio between a region's or region group's gains and losses, considering a specific sector or a group of sectors. A CLR above 100% means that losses are (over-) compensated, a negative CLR below this threshold indicates that losses are not (fully) offset. We compute the CLR on a US and global level (figure 5), again for the aggregate of all sectors except mining and quarrying as well as only this sector. As previously shown, for the US as a whole, direct losses in the aggregated sectors can be compensated for in the unscaled scenario, while this is no longer the case with climate change (CLR below 100%, panel (a)). This finding is consistent along all assumed slopes for the radius increase although full compensation lies within the range of uncertainty until 1 ∘C of additional warming after 2017 (i.e. ∼2 ∘C compared to pre-industrial temperatures) for scenario A. For the mining and quarrying sector (panel (b)), the CLR on a US level lies continually at ∼18% or below. Production in this sector being highly regionally aggregated in Texas, other US states have not the capacity to compensate for direct losses under any of the considered scenarios.
Figure 5. Compensation to loss ratio CLR. Production gains, relative to losses (upper panels) for the US only and (lower panels) globally (including US) for (left) an all industry aggregate without the mining and quarrying sector and (right) only the mining and quarrying sector. Mean values and the value range are shown for the fine-grained simulations along slopes A, B and C as in figure 2.
Download figure:
Standard image High-resolution image
On a global level, gains outweigh losses both for the aggregated sectors as well as the mining and quarrying sector. This is reflected in a CLR well above 100% with all considered scenarios (lower panels in figure 5), albeit with decreasing trend for ongoing global warming. Hence, while the economic system of the US is not capable to compensate for losses, the world as the superordinate economic system is. Globally, the CLR in the mining and quarrying sector for the unscaled scenario starts at a much lower value than in the aggregated other sectors, which is due to the relatively larger importance of Texas in this sector on a global level. Therefore, to compensate for losses in Texas in mining and quarrying, other regions reach their compensation limits earlier in this sector than in the aggregated remaining sectors.
4. Discussion
Our findings from simulating the projected global economic impact of Hurricane Harvey under climate change illustrate how direct production losses from a strong local economic shock are offset, i.e. compensated for, in the global economic system. We find that the US, as the directly affected country, cannot compensate for direct losses of the hurricane under further global warming, leaving the US at a competitive disadvantage. Other regions take over to offset these losses until reaching their own compensation limits, with compensation shares gradually shifting from large to smaller exporters as global warming continues.
These are not hard limits, but rather a matter of cost effectiveness. In the model used here, marginal production costs increase in production extension (i.e. production above baseline), making compensation efforts more expensive. This reflects the fact that, in practice, a region cannot increase production infinitely but is bound by production capacity which in turn is limited by, e.g. availability of labour and production assets. A sensitivity analysis of some important model parameters like the price increase in production extension is provided in supplement B: sensitivity analysis. We find that our results are robust to these parameter variations. Changes in magnitudes of gains and losses are small compared to the changes resulting from climate variation.
Of course, the modelling of the shock is rather stylized and the direct impact may vary in reality, both with regards to the unscaled scenario as well as the scaled scenarios. In particular, the quantitative relationship between radius of the hurricane and temperature is unknown, although it is likely for a hurricane like Harvey to grow larger under progressing climate change. For this reason, we assumed different possible relationships between temperature increase and radius change and found our results to be qualitatively consistent across these relationships, with slightly different magnitude. Main driver in the magnitude of the results is the change in temperature and associated precipitation increase.
Applying the same direct impact to all sectors is a strong simplification. However, we do not claim to have modelled the economic shock exactly like it happened historically. Rather, we were interested in the global economic repercussions to a shock with magnitudes like Hurricane Harvey and how these change under global warming in a storyline/counterfactual approach. In particular, we chose to investigate the mining and quarrying sector in comparison to the remaining economy. Of course, this sector will likely play a very different role in the future and we emphasize that it was chosen due to its strong regional concentration in Texas and the US. Even though this may change in the future, findings may be generalized to any such high regionally concentrated economic sector. We argue that applying identical shocks to this sector as to all others is a reasonable approach to investigate how the underlying structural differences regarding the sectors impact the economic response.
A source of uncertainty is the EORA MRIO table which we use as underlying network, comprising 26 industry sectors and final consumption. While more detailed MRIO tables are available for specific regions, global coverage inevitably comes at the cost of lower sectoral detail. As a result, e.g. production of oil, natural gas, and coal are all contained in the mining and quarrying sector, making these goods interchangeable in the model. In this comparably coarse resolution the model assumptions of goods being perfect complements and the network structure itself being fixed (i.e. demand and supply can only be shifted between existing supply relations without creating new ones) are reasonable.
Accordingly, the amounts of compensation globally and in the US should be regarded with care due to uncertainties in the modelling of the direct impact as well as the used model. However, we stress the qualitative findings of our research and their relevance to disaster impact analysis. Stronger direct impacts from major hurricanes like Harvey under climate change (with otherwise unaltered socioeconomic conditions) will at some point exceed the compensation capabilities of the US. The exact temperature, however, is subject to uncertainties. While we investigated a specific TC in the United States, our findings are likely applicable for any country that is threatened by major localized extreme weather events. These countries will be in a position of economic disadvantage, especially with regards to sectors with strong exposure and high level of regional concentration. Besides climate mitigation, economic adaptation in the form of regional distribution of production capacities is therefore advised. For sectors where this proves challenging, sufficient buffers are necessary to reduce dependencies on other regions for compensation.
We here looked into the temporary global redistribution of production volumes in the disaster aftermath. It has been shown that hurricanes can also affect growth patterns [50] with long-lasting effects [51], which we cannot model here due to a static economic baseline. However, shifts in production towards other regions may steer investments, thereby perpetuating these regions' economic advantages. We plan to investigate this in the future by implementing an investment scheme and thus adding endogenous growth to our model.
Acknowledgments
We thank Michael Wehner and three anonymous reviewers for their very constructive and valuable feedback to this work. This research has received funding from the Horizon 2020 Framework Programme of the European Union project RECEIPT (Grant Agreement 820712) and the German Federal Ministry of Education and Research (BMBF) under the research projects CLIC (01LA1817C), SLICE (01LA1829A), and QUIDIC (01LP1907A).
Data availability statement
The data that support the findings of this study are available from the corresponding author upon request. GADM region shape files can be found at http://www.gadm.org. Storm track retrieved from IBTrACS database at http://ibtracs.unca.edu/.
The data that support the findings of this study will be openly available following an embargo at the following URL/DOI: 10.5281/zenodo.5848439.
Code availability
The implementation of the Acclimate model is available as open source on https://github.com/acclimate/acclimate with identifier 10.5281/zenodo.853345. The code for data processing and analysis scripts is available from the corresponding author upon request.
Author contribution
R M designed the method and conducted the analysis. S W and C O developed the Acclimate model. R M, S W, and A L analysed and interpreted the results. R M wrote the manuscript with contributions from all authors. All authors discussed the results.
Conflict of interest
The authors declare that they have no competing interests.
Footnotes
Supplementary data (4.0 MB PDF)